Abstract
The geodetic and geotechnical techniques were accepted for monitoring and measurement of unique hydro-technical structures, i.e. of pier stability. The designed monitoring system for pier damage prevention has been realized at the experimental object of Klaipeda State Seaport. Cracks of pier concrete constructions were identified, measured and continuously observed by the application of crack-gauges for experimental measurement. The analysis of the results shows that cracks of chosen locations depend upon meteorological conditions, such as, for example, temperature. It influences the width of cracks in the pier concrete. The relations were obtained according to the created monitoring system of hydro-technical structure which estimates the influence of cracks of pier concrete to the structural damages.
1. Introduction
The piers of seaports are of several types and their functions are very important for the protection of the coast from the negative effect of the sea waves and storms. Mostly, main constructions of piers are made of stones that is why even a small damage of such a construction can cause painful subsequences. Therefore, a regular control of pier state is necessary in order to avoid the damages of any type of piers [1].
The main task is to determine the motion and frequency value of construction elements. The reason of such movements (displacements) can be settlements of pier foundations, degradation of the pier constituent elements or the influence of storms. Special attention should be devoted to the available erosion of the pier, like, for example, the measurement and evaluation of the width changes of the pier cracks. Adequate estimation of the changes in the pier crack width and the establishment of its functional relations with the temperature and wind influences allows to determine premises for the qualitative estimation methodology and, ultimately, for the structural damage prevention. The biggest threat that these negative factors can cause is the destruction of the object.
Recent modern monitoring systems that include the possibility of geotechnical and geodetic monitoring [2, 3], now effectively allow a preliminary assessment in order to identify and predict the state of objects in real time. Two methodologies ‒ geodetic and geotechnical monitoring are accepted for measurement of unique hydro-technical structure (pier) stability [4]. Geodetic monitoring is a point’s position determination by the application of electronic geodetic instrument (tachometer) of high accuracy [5]. The tachometer is fixed on support and mounted inside a special cabin (box) with openings for the prevention of the environment actions. The cabin protects the instrument from snow, rain, and vandalism. The electronic tachometer performs measurements automatically according to the indicated cycle. The nighttime is recommended for measurements thus avoiding refraction influence when working at daytime. Before each cycle of measurements, the targeting of the tachometer with reference to particular points is done automatically, which is necessary for recalculating the coordinates of the stations. The accumulator collects data of the measurements and transmits them to the main server. The points for monitoring are arranged in the spatial mode by prisms. The special program is used for processing of the measurement results.
Geotechnical monitoring includes the usage of such instruments/ sensors as: tilt sensors, crack-gauges and piezometer. All these sensors are connected to a single network [6]. The software “Settop Auscultation” is used for data processing, visualization and report preparation from all sensors. The presentation of the measurement results in graphics (diagrams) and numerical forms is enabled [7]. A warning system is active, and information is transmitted immediately, if damages of objects exceed indicated standards. All the results of measurements are presented at internet environment in real time.
The goal of the research is to develop a system for evaluation and monitoring of hydro-technical construction (pier) damages. The main task is the estimation of the cracks of pier concrete at Klaipeda State Seaport, and on the basis of the experimental results to monitor procedures in relation to the temperature and wind influences and to prove their effectiveness.
2. Experimental procedures on test area and method
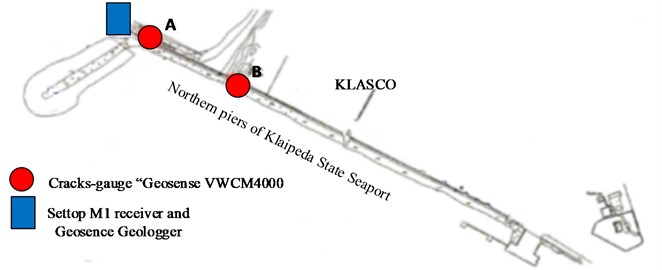
The object for experimental investigation is Northern piers of Klaipeda State Seaport (Fig. 1) in the period of 2014 - 2016. General characteristics: the structures are of inclined dams, reinforced by stones, concrete slabs and tetrapod; the pier is 733 m long, built in 1834-1858; reconstructed in 2002. When inspecting the piers construction cracks of the concrete surface at the object were found (Fig. 2). The crack-gauges “Geosense VWCM4000” with accumulator “Wi-SOS400 VWNode” were located in places: A where crack’s width is about 7 mm; B – 10 mm (Fig. 3). Instruments were calibrated before measurements and the required accuracy ±0.1 % of measured value was fixed. The points were observed once per 24 hours; at night time ‒ on 0.00 hr.
Fig. 1Northern zoomed (from Google Earth application)
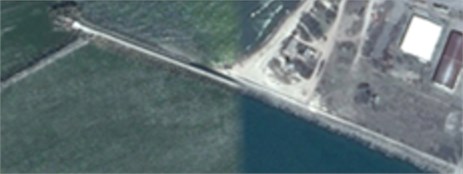
Fig. 2Cracks of the concrete surface at the object
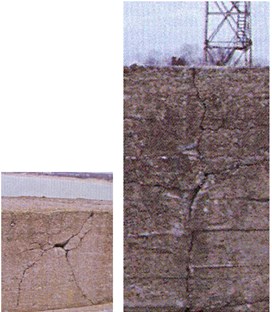
Fig. 3The location places of crack-gauges
After collecting and observing the survey data it is necessary to conduct a statistical analysis of the measured results. At the first stage we propose to exclude rough mistakes using analysis for monotonicity of measurement series [8, 9]. At the second stage in order to determine the accuracy of measured values and directions it is efficient to use correlative analysis of measurement results in the A and B places. Extra attention is devoted to the wind influence. For this purpose in the correlative analysis two average intervals of wind, such as: under 10 m/s and above 10 m/s were applied. Examining the correlative relationships between crack width and temperatures makes it possible to evaluate the reliability of measurements and allows to draw a conclusion about the quality of the relation. If the correlation is strong we can establish a line of best fit that explains the potential relationship between an independent variable (temperature) and a dependent variable (crack width change ratio with initial, %) using least squares method [10-13]. In this manner we have identified a linear dependence between the crack width and the temperatures according to the definite wind speed interval:
where – crack width change in accordance with the available temperature and the allowable wind speed, % (crack width change quantity according to the equation %); – temperature, ℃; , – constant for certain crack.
We propose to take into account crack of concrete structure change by Eq. (1) in geotechnical monitoring systems data analysis to determine real width of crack:
where – real crack width, mm (crack width according to the measurement of the crack-gauge); – initial crack width, mm. (crack width measured at the beginning of the experiment mm).
So, a prediction rule of crack condition can be:
where – allowable crack width, mm. (absolute measure of the allowable crack width, mm).
The determination of the allowable crack width can be obtained by modelling a crack of a concrete structure under the temperatures and wind applying FEM analysis [14, 15].
In our case it is significant to continue to employ the results of the crack measurement in the monitoring process. It means, that it makes an influence on the reliability and accuracy of the observation system. On the other hand, the insufficient number of measurements and inadequate statistical data may produce an incorrect assessment of the observation results. That is why a digital modelling of the data methodology [16] is suggested to be applied, which allows to present precise statistical parameters adequate for the selected reliability level and permits to evaluate possible arithmetical deviations of the parameter. With the application of methodology [16] experimental data can be treated as the sequences of contingent entities the statistically grounded averages of which have to be selected. A contingency in this respect can be related to the distribution of measured parameter, and an adequate statistical estimation of the limited quantity of data is indispensable. Let us admit that the temperature is a contingent entity , and the crack width change percentage is . Let us admit that the contingent entity is distributed according to the law of normality, i.e. the distribution function is expressed as follows:
where – mean value; – dispersion, – symbol of distribution.
Due to methodology [16] and with its application to the issue analized the received statistical outcome arrangement can be accomplished in the following two ways:
1) In case when the received experimental data amount s is sufficiently abundant;
2) In case when the received experimental data amount s is limited and scares it is suggested to be increased, i.e. the data sequence is to be expanded without changing the data structure.
In the first case, having determined the level of reliability as 0.05, a reliability interval of entities , due to temperature as a contingent entity in relation to the extent , with the distribution according to the law of normality can be identified as follows:
where:
In that case, we can assume approximately that:
Firstly, we can assume that:
where – sequence, approximation function.
In the second case, having applied methodology [16] and having approximated the sequence of the crack change data according to a certain function , which is not contingent but determined, we can generate the sequence as follows: , , which is distributed according to the law of normality and can be calculated as: , and is able to formulate a histogram for the sequence , . An important role belongs to the assessment of entities ir , when a sequence of data has to be extended. According to [16] we can state by Eqs. (5) and (6) with an adequate precision the received expressions of , , quantities. Thus, it means that according to the Eq. (1), we can make predictions and at the same time estimate the changes of the crack width, as well as real measurement parameters depending on the temperature in a definite interval of the wind speed.
3. Results
The results of the tests with crack-gauges “Geosense VWCM4000” which were located in places A and B are given as diagrams where the vertical axis represents crack width change ratio with the initial crack width (%), whereas the horizontal axis shows the temperature in situ. The crack width change ratio with the initial crack width (%) relationship with wind speed (under 10 m/s; above 10 m/s) and temperature in crack-gauges A (where initial crack width is about 7 mm) is illustrated in Fig. 4 and Fig. 5. Note that sign minus means crack width decrease.
The crack width change ratio with the initial width (%) relationship with wind speed (under 10 m/s; above 10 m/s) and temperature in crack-gauges B (where the initial crack width is about 10 mm) is illustrated in Fig. 6 and Fig. 7.
The prediction of the condition and influence to structural damages in pier concrete of the Northern part of Klaipeda State Seaport can be accomplished with Eqs. (4-6). These procedures can be added in the geotechnical monitoring systems by applying the parameters which are given in Table 1.
Fig. 4The crack width change relationship with temperature in crack-gauges A when wind speed is under 10 m/s
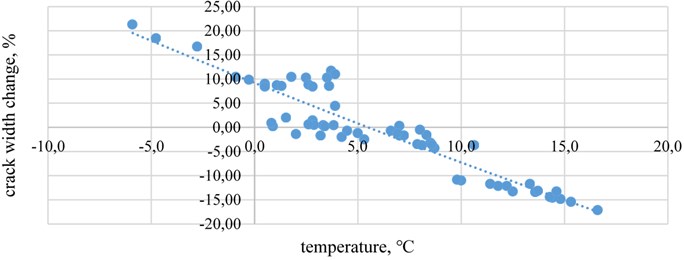
Fig. 5The crack width change relationship with temperature in crack-gauges A when wind speed is above10 m/s
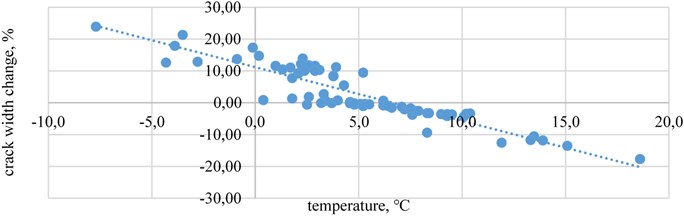
Fig. 6The crack width change relationship with temperature in crack-gauges B when wind speed is under10 m/s
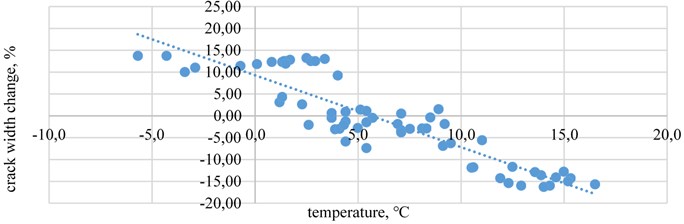
Fig. 7The crack width change relationship with temperature in crack-gauges B when wind speed is above 10 m/s
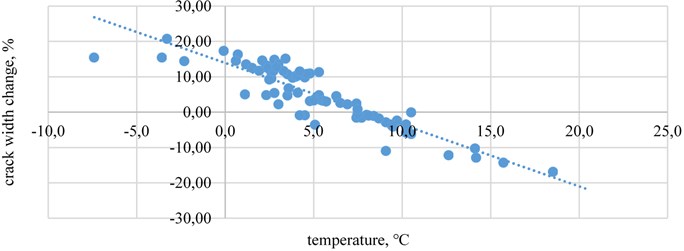
Table 1The parameters for calculation
Crack-gauge place | Constant | Constant | Coefficient of determination |
Then wind speed under 10 m/s | |||
A | –1,63 | 9,11 | 0,86 |
B | –1,64 | 9,26 | 0,81 |
Then wind speed above 10 m/s | |||
A | –1,69 | 11,18 | 0,82 |
B | –1,74 | 13,92 | 0,80 |
4. Conclusions
The developed method for geotechnical monitoring system involves all the required procedures for the crack prevention and for the realization of all technical requirements for pier observation. During the experimental period a huge data set was constructed for analysis of relationships between crack width and temperatures in the distinguished wind speed intervals. It allows a full assessment of observed construction elements and permits to estimate the influence of cracking of pier concrete to structural damages predetermined by temperature and wind speed. From the analyses of the test results it is seen that the significant changes of pier cracks of chosen locations were not detected. All measured elements remain stable, no deformations or slumps were observed. However, stability of the measured elements could be but temporary, and a recommendation is that pier monitoring should be carried out continuously with the proposed method of crack relation with temperatures in a distinguished wind speed interval.
The above suggested methodology allows to improve the data interpretation of pier monitoring system while more objectively assessing the available cracks predetermined by the environmental temperature and wind speed characteristics, and, at the same time, it creates prognostic premises for more advanced predictions of pier structural damages alongside with the prevention of consequences.
References
-
Code of practice for maritime structures, Part 7_ Guide to the design and construction of breakwaters. British Standard, 6349-7, 1991.
-
Kaloop M. R., Beshr A. A., Elshiekh M. Y. Using total station for monitoring the deformation of high strength concrete beams. 6th International Conference on Vibration Engineering, Dalian, 2008, p. 411-419.
-
Grapenthin R., Freymueller J. T., Kaufman A. M. Geodetic observations during 2009 eruption of Redoubt Volcano, Alaska. Journal of Volcanology and Geothermal Research, Vol. 259, 2013, p. 115-132.
-
Grossauer K., Schubert W., Sellner P. The importance of displacement prediction. ITA-AITES World Tunnel Congress, Underground Space Use – Analysis of the Past Lessons for the Future, London, Vol. 2, 2005, p. 1239-1244.
-
Elhassan I. M., Ali A. S. Comparative study of accuracy in distance measurement using: optical and digital levels. Journal of King Saud University – Engineering Sciences, Vol. 23, 2011, p. 15-19.
-
Chen J., Zhao W., Luo H., Li P., Wen Y. A real-time system for monitoring distant dynamic displacement of structures. Geo-Spatial Information Science, Vol. 11, Issue 1, 2008, p. 49-55.
-
SettopSurvey M1. User Manual, Vol. 2, 2014, p. 55-59.
-
Schäfer T. Deformation measurement using terrestrial laser scanning at the hydropower station of Gabeikovo. INGEO 2004 and Regional Central and Eastern European Conference on Engineering Surveying, 2004, p. 11-13.
-
Schneider D. Terrestrial laser scanning for area based deformation analysis of towers and water damn. 3rd IAG/12th FIG Symposium, 2006, p. 22-24.
-
Rencher A. C., Christensen W. F. Methods of Multivariate Analysis. Wiley Series in Probability and Statistics. 3rd Edition, John Wiley and Sons, 2012.
-
Lai T. L., Robbins H., Wei C. Z. Strong consistency of least squares estimates in multiple regression. Journal of Multivariate Analysis, Vol. 9, Issue 3, 1979, p. 343-361.
-
Tofallis C. Least squares percentage regression. Journal of Modern Applied Statistical Methods, 2009, p. 526–534.
-
Del Pino G. The unifying role of iterative generalized least squares in statistical algorithms. Statistical Science, Vol. 4, Issue 4, 1989, p. 394-403.
-
Sukumar N. D., Chopp L., Moran B. Extended finite element method and fast marching method for three-dimensional fatigue crack propagation. Engineering Sciences and Applied Mathematics, Vol. 70, Issue 1, 2003, p. 29-48.
-
Asadpoure A., Mohammadi S., Vafai A. Modeling crack in orthotropic media using a coupled finite element and partition of unity methods. Finite Elements in Analysis and Design, Vol. 42, 2006, p. 1165-1175.
-
Baltrunas I. I., Volkovas V. V. Reliability of experimental results for a limited number of measurements. Vibration Engineering, 1990, p. 215-224.
Cited by
About this article

