Abstract
To comprehensively consider and study the seismic performance of the self-center mortise-tenon segmental pier, its vulnerability under earthquake is evaluated. The reliability of the model is verified by comparing the cyclic pseudo-static test results with the finite element models. The model is used as the basis for vulnerability analysis. Taking the maximum displacement of the pier top as a damage index. Different damage states are described. The damage index limits , , , and of different damage levels are determined. The time history analysis of cast-in-place pier and mortise-tenon segmental piers under different earthquake actions is carried out by using finite element software. The probabilistic seismic demand model is established through IDA curves. And the seismic vulnerability analysis is carried out. The influence of various parameters on the seismic vulnerability of mortise-tenon segmental pier is studied by changing the longitudinal reinforcement ratio, axial compression ratio, and aspect ratio. The results show that the seismic vulnerability of the two types of piers designed according to the principle of equivalence is similar under different damage states. It can be considered that it has better seismic performance. The longitudinal reinforcement ratio, axial compression ratio, and aspect ratio have a great impact on the vulnerability of piers.
Highlights
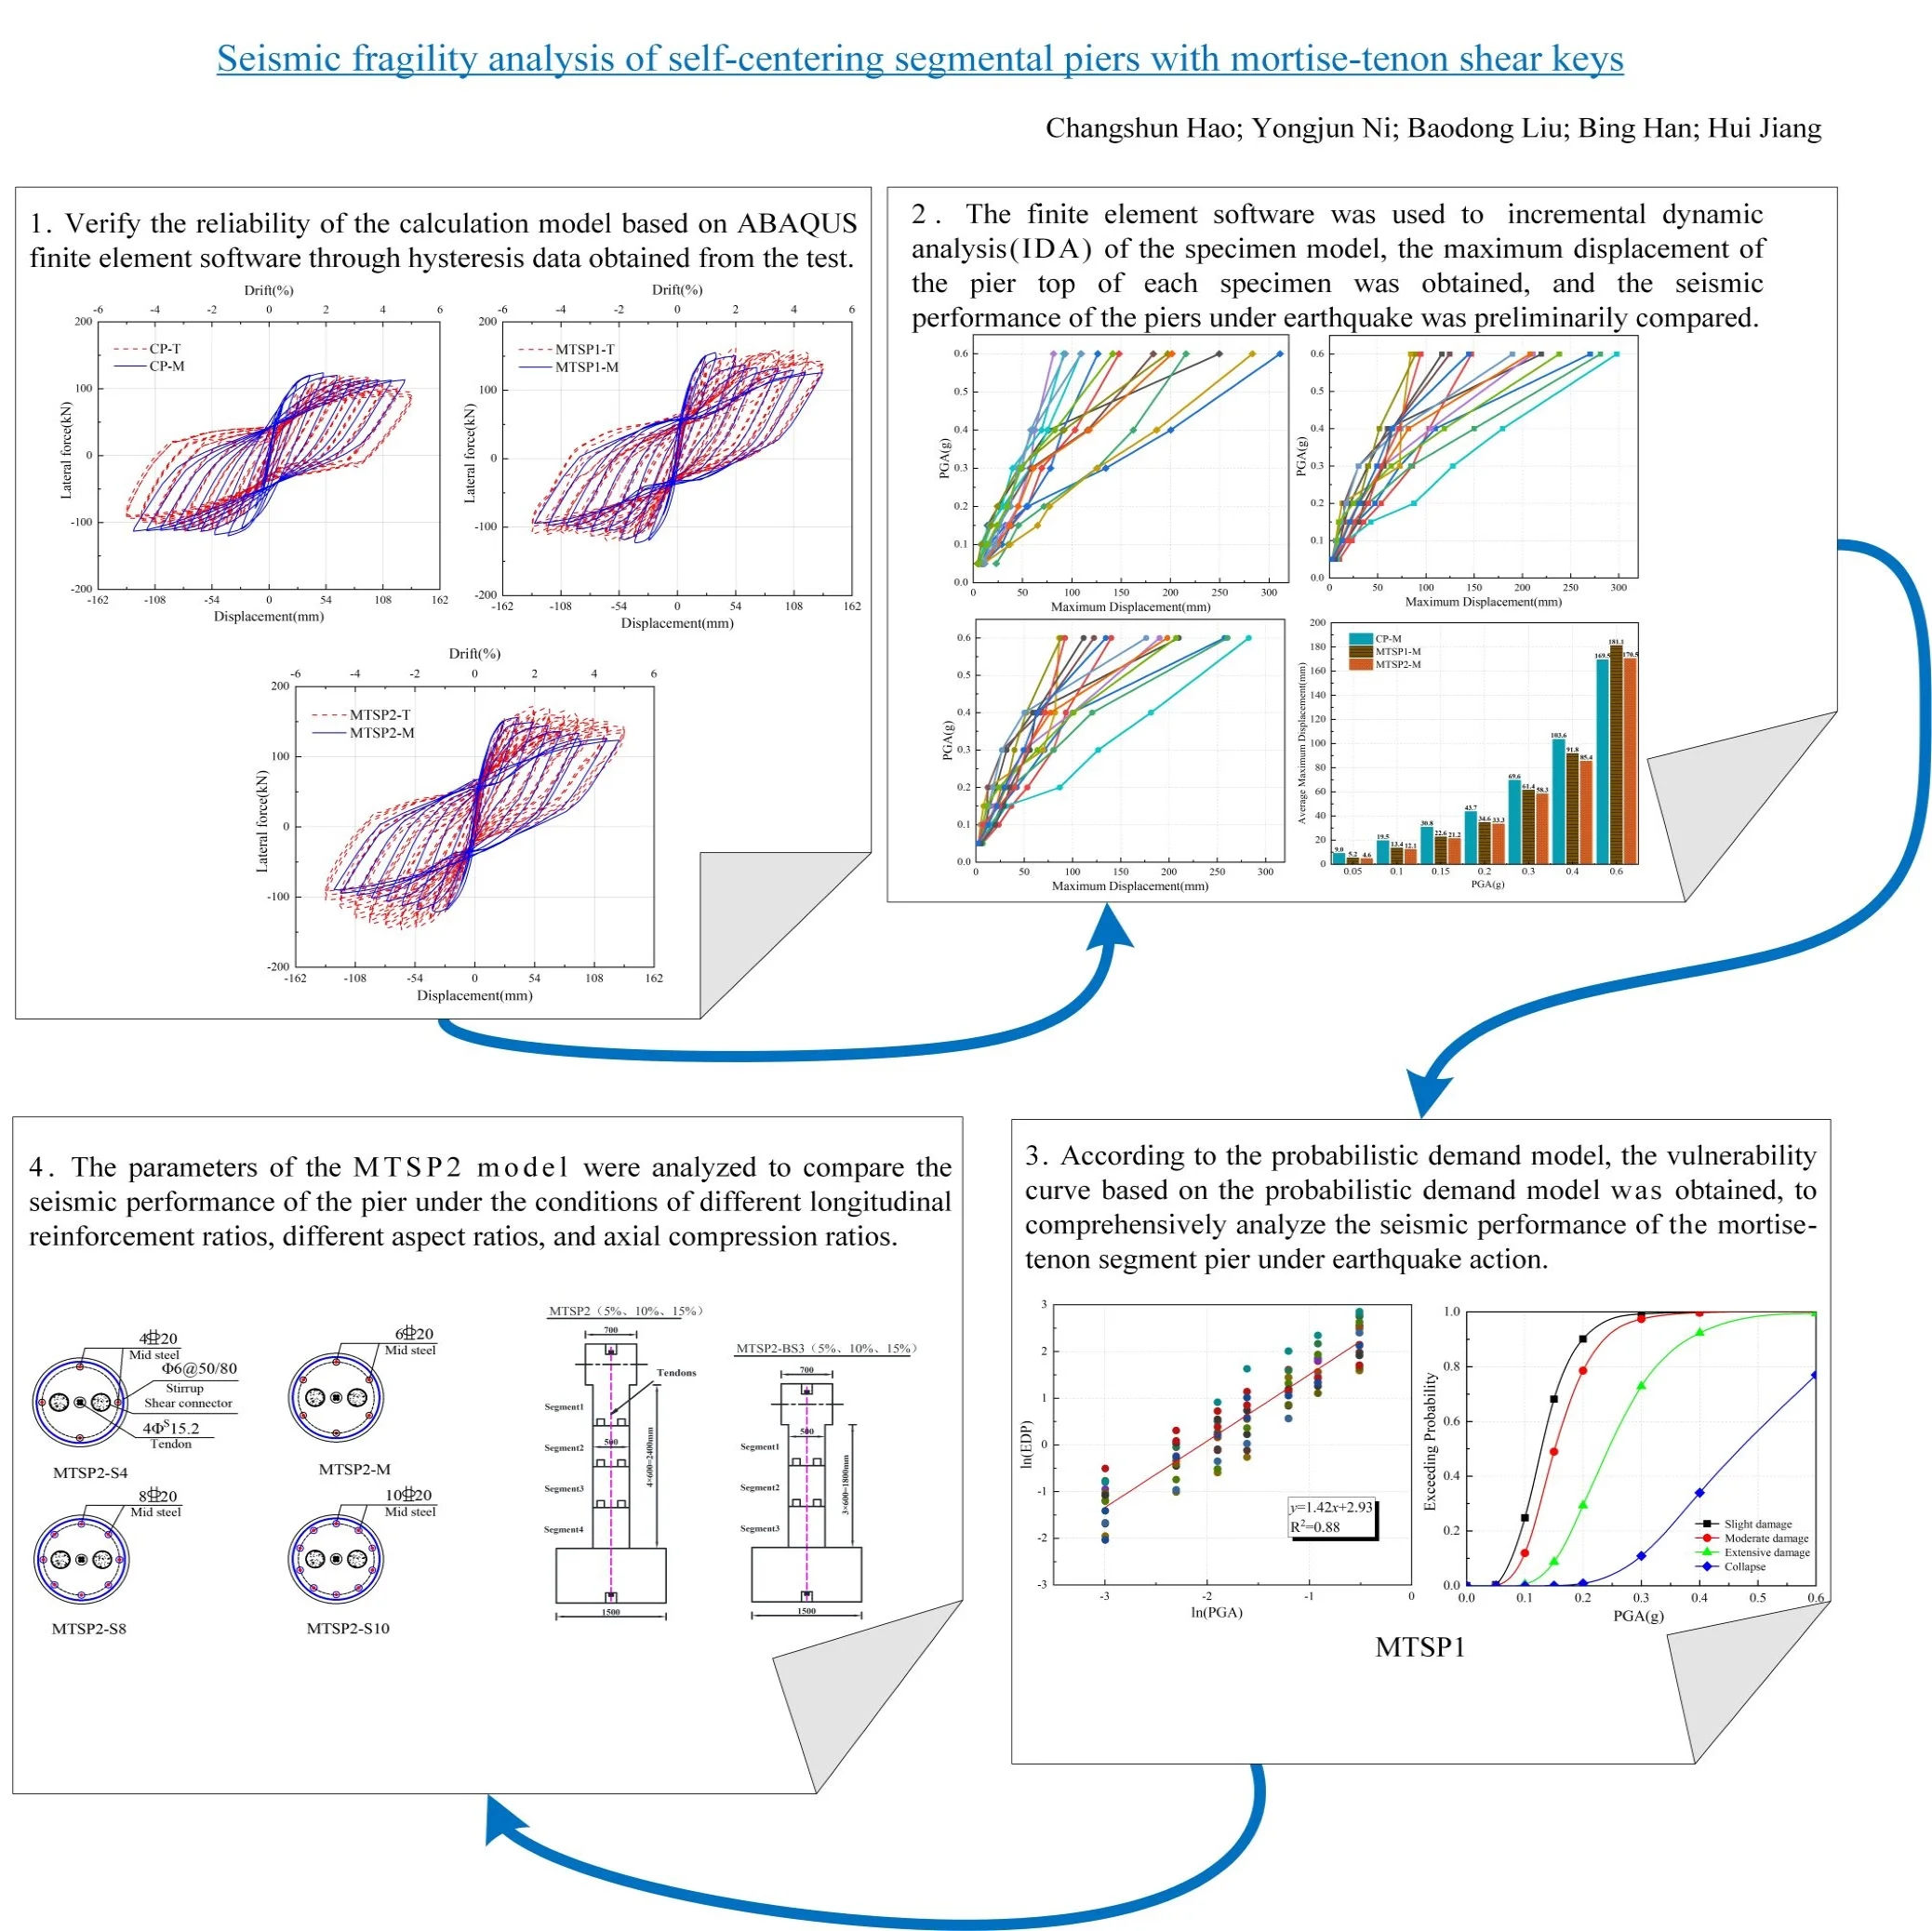
- The finite element software was used to incremental dynamic analysis of the specimen model.
- The probabilistic demand model was established.
- The seismic performances of piers were evaluated comprehensively by analyzing their vulnerability.
- The more sensitive parameters of MTSP were analyzed.
1. Introduction
To overcome the difficulties of concrete pouring and maintenance in cold and high altitude areas, facilitate standardized construction, and reduce carbon emission costs, construction noise, and environmental pollution [1-3], various prefabricated components have been proposed. The main forms include prefabricated box girders, prefabricated piers, prefabricated caisson foundations, etc. [4]. However, due to the imperfection of the test and theory, precast piers are less used in areas with medium and high seismic intensity [5].
With the development of science and technology, the demand of society, the rise of safety, and the concept of rapid construction, scholars at home and abroad have carried out more in-depth research on precast segmental piers. Some scholars have carried out pseudo-static test research on segmental piers. They found that the seismic performance of segmental piers can be enhanced by using continuous longitudinal reinforcement and prestressed reinforcement [6]. Adding shear keys can improve the shear resistance between segments. The opening and closing behavior between segments are helpful to absorb seismic energy and reduce the damage degree of the pier shaft [7]. The PSP equipped with unbonded prestressed tendons has a good self-centering capacity and good energy dissipation capacity [3]. The existing tests on piers mainly focus on the seismic performance of various parameters. There are few studies on quantifying the impact of various parameters on segmental piers during earthquakes. At present, the research on segmental piers is generally dry joints, and large slippage may occur between segments. The numerical model of the pseudo-static test cannot directly reflect the seismic performance of the two structures during the actual earthquake [8].
Seismic vulnerability analysis is to quantify the damage probability of the structure during different earthquakes from the perspective of the probability demand model and then obtains the vulnerability curve. Then quantitatively evaluating the seismic performance of components [9]. Muntasir Billah and Shahria Alam set SMA reinforcement in the plastic hinge area of the pier, established a vulnerability curve, and elaborated on the influence of SMA on the failure probability of the pier [10]. Yibin He et al. analyzed the vulnerability of single-column piers with the corrosion rate of different reinforcement and found that within a certain range, the greater the reinforcement corrosion rate, the greater the damage probability [11]. Y. Ding et al. carried out numerical vulnerability investigations and found that RC bridge piers constructed with high-strength steel bars have lower low-cycle fatigue and ductility performance compared to that constructed with conventional steel bars, which is particularly problematic for RC bridge piers in highly seismic regions [12]. Seismic vulnerability analysis is of great significance to evaluate the safety of piers during actual earthquake actions [13-15]. Existing studies have analyzed the vulnerability during actual earthquake actions relatively less, and the quantitative analysis of the impact of various parameters is less, which is not conducive to the comprehensive evaluation of the seismic performance of piers.
Therefore, according to the pseudo-static test results of different types of piers, this paper uses ABAQUS finite element software to conduct numerical simulations and compare them with the test results to verify their effectiveness. And then analyzes the seismic vulnerability. Makes quantitative analysis and comparison of the vulnerability of different types of piers. And comprehensively evaluates the seismic performance of mortise-tenon segmental piers. Finally, the influence of various parameters on vulnerability is analyzed by changing the ratio of longitudinal reinforcement, axial compression ratio, and shear span ratio.
2. Cyclic pseudo-static analysis of self-centering segment piers with mortise-tenon shear keys
2.1. Introduction of test piece
To study the seismic performance of self-centering segment piers with mortise-tenon shear keys, three equal size model piers were designed and manufactured. The structural diagram is shown in Fig. 1. There was one cast-in-place pier (CP) and two assembled mortise-tenon segment piers (MTSP). The cast-in-place pier was mainly for the comparative analysis. The pretension stress levels of two assembled mortise-tenon segment piers were different. And the pretension of MTSP1 was 70 % ultimate strength standard values of steel strand. The pretension of MTSP2 was 80 % ultimate strength standard values of steel strand.
The test piece is designed with a 1:3 large-scale model. The code and description are shown in Table 1. The CP test piece is composed of a rigid foundation (long × wide × height = 1500 mm × 800 mm × 850 mm), pier shaft (diameter R = 500 mm, height H = 2400 mm), loading end (700 mm × 700 mm × 600 mm) as a whole. From experience, to prevent the plastic hinge from moving up to the second section of the pier bottom, the height of the first section of the pier bottom should be greater than 1.5 times the length of the plastic hinge area. According to the JTG/T2231-01-2020 [16], the equivalent plastic hinge length formula of a single column pier is:
The equivalent plastic hinge length of the segmental pier [17] is:
where: is the height of the cantilever pier or the distance from the plastic hinge section to the reverse bending point (cm); is the short side size of the rectangular section or the diameter of the circular section (cm); is the standard value of tensile strength of longitudinal reinforcement (MPa); is the diameter of longitudinal reinforcement (cm)
After calculation, 333 mm for the cast-in-place pier specimen. 250 mm for the segmental pier specimens, that is, the height of the first segment at the pier bottom should be at least 375 mm.
The foundation of MTSP1 and MTSP2 test pieces is the same as that of CP test pieces, while the pier body and loading end are composed of four segments. The pier specimens were a circular section with a diameter of 500 mm, the height of the pier specimens was 2400 mm, and the effective loading height of the piers was 2700 mm. The shear span ratio of specimens was 5.4. To simplify the treatment, the loading pier cap was precasted together with the top segment 1. This segment had two mortise holes at the bottom and no tenon. There were two cylindrical tenons with 100 mm diameter and 90 mm height, two mortise holes with 100 mm diameter and 90 mm depth in segment 2 and segment 3. Segment 4 was the bottom segment without mortise holes. And the top of it had the same tenons as segment 2 and segment 4. The layout of the tenons was consistent with the loading direction. The design strength of the concrete was C40.
Fig. 1Geometry and section details for the tested specimens (units: mm)
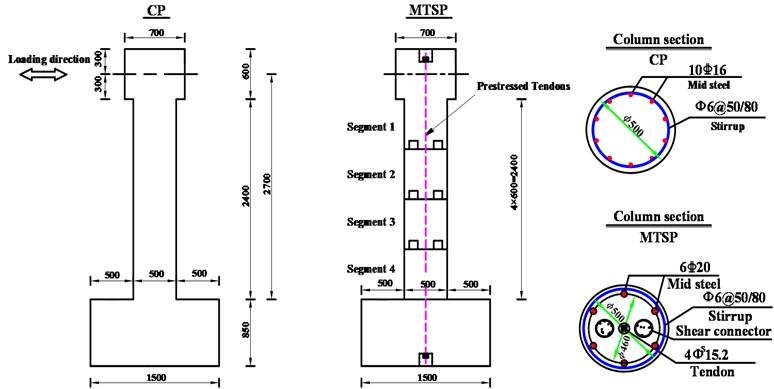
Table 1Serial numbers and characters of all specimens
Specimen name | Specimen description |
CP | Cast-in-place Pier |
MTSP1 | Mortise-Tenon Segmental Pier with 70 % pretension |
MTSP2 | Mortise-Tenon Segmental Pier with 80 % pretension |
Table 2 is specific relevant parameters of components. The longitudinal energy dissipation reinforcements of the CP pier shaft are made of 16mm diameter HRB400 hot-rolled ribbed reinforcement. The longitudinal energy dissipation reinforcements of the MTSP pier shaft are made of 20 mm diameter HRB400 hot-rolled ribbed reinforcement. The stirrups are made of 6 mm diameter HPB300 hot-rolled plain steel, with a stirrup spacing of 80 mm and a protective layer thickness of 30 mm (the stirrup densification area is set at the bottom of the pier shaft, with a densification height of 600 mm and a spacing of 50 mm). The average compressive strength of specimen concrete is 43.87 MPa. The average yield strength of longitudinal reinforcement is 436.67 MPa, and the ultimate strength is 624.92 MPa.
Table 2Specimen design parameters
Specimen name | Column height (mm) | Longitudinal reinforcement | (%) | Tendons | (%) | Stirrup spacing (mm) | (%) |
CP | 2700 | 10D16 | 1.02 % | NA | NA | D6@50/80 | 0.49/0.31 |
MTSP1 | 2700 | 6D20 | 0.98 % | 4D15.2 | 0.29 | D6@50/80 | 0.49/0.31 |
MTSP2 | 2700 | 6D20 | 0.98 % | 4D15.2 | 0.29 | D6@50/80 | 0.49/0.31 |
2.2. Description of cyclic pseudo-static test process
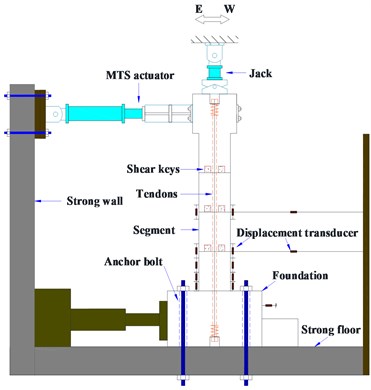
The test loading device is shown in Fig. 2. The pier is applied a dead load vertically, and the axial compression ratio is 10 %. That is, the dead load of the vertical jack is 649 kN. The horizontal load is applied by the MTS actuator with a maximum thrust of 500 kN. The horizontal displacement is controlled according to the horizontal loading system.
Fig. 2Pseudo-static test setup and loading
The failure phenomena of the CP specimen and MTSP specimens are shown in Fig. 3. The failure processes and phenomena of MTSP specimens are different from those of the CP specimen. When the drift of the CP specimen is large, the cracks first increase and expand, and even form through annular cracks. When it is damaged, serious concrete spalling and crushing occur in the plastic hinge area. With the drift ratio increased, the opening of the joints between the segments was increasing. In addition, there was a minor slippage between the segments of MTSP specimens. The main reason was that there was a dry connection between the two segments. However, the integrity of MTSP specimens was strengthened by unbonded prestressed tendons. Special mortise-tenon shear keys were set for the connections of segments played an important role in shear resistance and greatly reduced the slippage between the segments.
Fig. 3Failure mode [18]
![Failure mode [18]](https://static-01.extrica.com/articles/23003/23003-img3.jpg)
3. Analysis method of seismic vulnerability
3.1. Selection of analytical methods
The vulnerability analysis method is used as a means to describe the seismic performance during different earthquake input strengths. The vulnerability curve describes the possibility that the structure is damaged beyond a specific damage level during a given earthquake intensity, which can be expressed as [10]:
where: is the limit state or damage state (DS) of the structure; is the ground motion intensity index. Generally, the ground motion peak acceleration (PGA) is the index to measure the ground motion intensity; is the realization condition of the ground motion intensity index; is the cumulative probability function of standard normal distribution; is the median of the seismic demand of members; is the median of the seismic performance of members; is the standard deviation of the seismic demand of components; is the logarithmic standard deviation of the seismic performance of components.
Based on seismic vulnerability analysis can better quantify the seismic performance of piers. The advantages and disadvantages of seismic performance of piers can be shown by vulnerability curves, visually. To develop vulnerability curves, scholars have proposed some methods and done a series of research, which are mainly divided into two types:
(1) According to the data obtained after the earthquake, the vulnerability curve can be generated according to experience, but the situation, environment and site conditions of each bridge are different. The applicability of empirical vulnerability curves is poor [19].
(2) In the absence of data, a variety of methods can be used to obtain vulnerability curves, such as elastic spectrum analysis, Bayesian analysis, nonlinear static analysis, and linear/nonlinear time history analysis [20-22].
In this paper, probabilistic seismic vulnerability curves are generated by nonlinear time history analysis.
It is generally assumed that the median seismic demand follows a lognormal distribution [10]:
where: and are regression coefficients.
The standard deviation of structural seismic demand calculation formula [16]:
where: is the seismic demand value of the component during the th earthquake; is the number of ground motions.
calculation formula:
where: is the coefficient of variation under each damage state.
This paper is based on the recommendations of the HAZUS99 user manual [23]: .
3.2. Establishment of finite element models and comparison of results
In this paper, firstly, ABAQUS finite element software is used to simulate and analyze the test. The plastic damage model can simulate the damage degree and stiffness recovery degree of concrete under cyclic loading of reciprocating tension and compression. Using the plastic damage (CDP) model in ABAQUS can better show the damage situation of concrete from tension to compression. Therefore, the CDP model is used in this paper. The traditional bilinear model is adopted for reinforcement. Concrete is simulated by reduced integral C3D8R solid element. The reinforcements and prestressing tendons are simulated by the truss (T3D2) element. The initial prestress of prestressing tendons is realized by the cooling method. Due to the short interval between the fabrication, splicing, and loading of specimens. There is no bond between the prestressing tendons and the concrete. After calculation, the prestress loss can be ignored. The cooling value is calculated according to the formula:
where: is the expansion coefficient of prestressed reinforcement, and the value is 1.2×10⁻⁵.
Because the prestressing tendons are unbonded, there is no contact relationship between the prestressing tendons and the concrete in the finite element simulation. In the specimens, the prestressing tendons are anchored at the upper and lower ends of the pier through the anchorage. Its two ends are constrained at the bottom of the cushion cap and the top of the loading end through the MPC beam during the simulation.
The energy dissipation reinforcement, stirrup, and other reinforcement are embedded into the concrete in the embedded region method. The friction between the joints of two sections adopts the surface-to-surface contact method. And the tangential adopts the “penalty” friction formula. The friction coefficient is taken as 0.6 according to the American AASHTO specification [25]. The normal behavior adopts “hard” contact due to the opening and closing between the two surfaces. That is, when the contact pressure between the two surfaces is 0 or negative, the contact surface separates and the constraint is canceled. As shown in Fig. 4.
Fig. 4Contact mode between concretes in ABAQUS
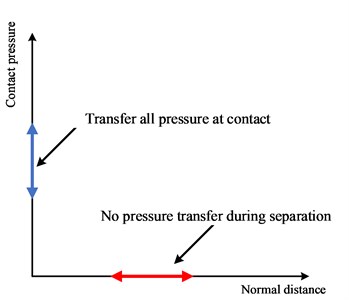
a) Normal behavior
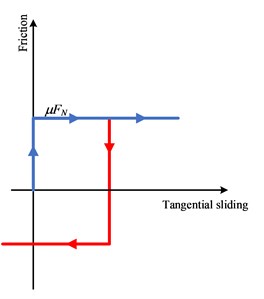
b) Tangential behavior
To simplify the model, the horizontal single cycle displacement is used to simulate the loading process of the specimens. The loading amplitude is 0.125 %, 0.25 %, 0.5 %, 1 %, 1.5 %, 2 %, 2.5 %, 3 %, 3.5 %, 4 %, 4.5 %, 5 %. The loading scheme is shown in Fig. 5.
Fig. 5Loading protocol
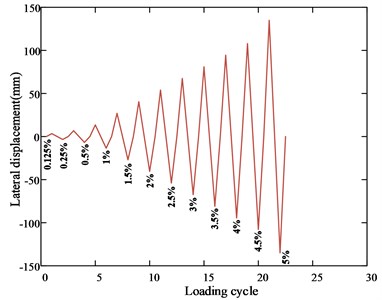
Fig. 6 shows the comparison between the hysteretic curve of simulation results and test results. represents the test results, and represents the simulation results. It can be seen that the consistency of simulation results and test results are high. The comparison results of MTSP1 are shown in Table 3. From the analysis data in the figure, it can be concluded that the consistency of the hysteretic curve, skeleton curve, accumulated energy dissipation, and residual displacement is high. The difference between the maximum horizontal bearing capacity of the simulation results and the test results is 1.96 %. The difference between the maximum accumulated energy dissipation is 7.13 %. The difference in the maximum residual displacement is 10.67 %. With the increase of the drift ratio, the equivalent stiffness coincidence gradually increases.
Fig. 6Comparison of simulation results and test results of specimens
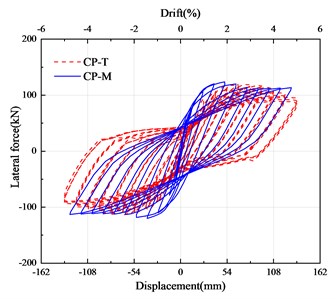
a) Hysteretic curve of CP
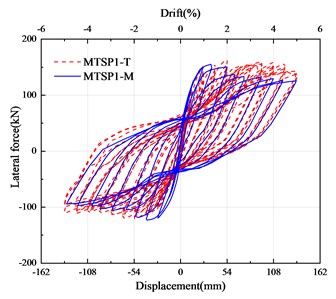
b) Hysteretic curve of MTSP1
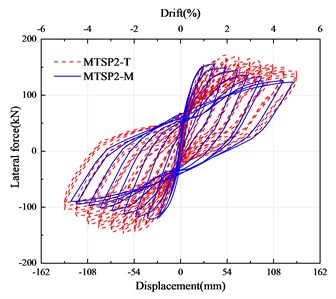
c) Hysteretic curve of MTSP2
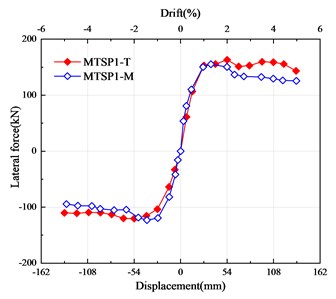
d) Skeleton curve of MTSP1
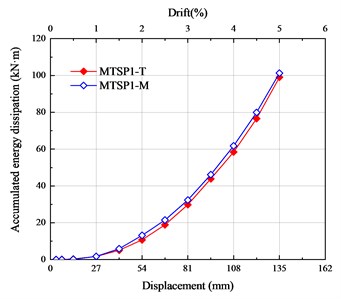
e) Accumulated energy dissipation of MTSP1
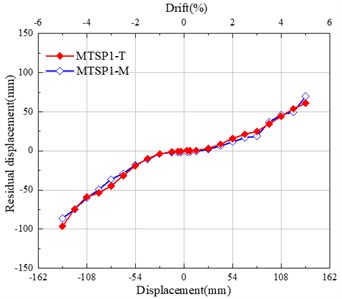
f) Residual displacement of MTSP1
Due to the influence of the objective factors of the test, the hysteretic curve of the mortise-tenon segmental pier appears asymmetric. This is considered in the finite element simulation. The finite element model is eccentric according to the test model. It can be seen from the figure that the finite element model established can accurately simulate the mechanical performance of the MTSP1 specimen in the pseudo-static test. This finite element model is used as the basic model for numerical simulation of seismic performance analysis.
Table 3Comparison results of MTSP1 various parameters
Contrast | Peak horizontal bearing capacity (kN) | Maximum accumulated energy dissipation (kN·m) | Maximum residual displacement (mm) |
Tests | 163.07 | 99.02 | 96.43 |
Simulations | 166.27 | 106.08 | 86.14 |
Difference rates | 1.96 % | 7.13 % | 10.67 % |
3.3. Definition of damage state
Hazus is a standardized method developed by the Federal Emergency Management Agency (FEMA). Hazus-MH [25] allows scholars to access FEMA’s model and define four damage states (slight damage, moderate damage, extensive damage, and collapse) for the structure to further estimate the potential loss caused by the earthquake. In this paper, the damage state of mortise-tenon segmental piers and the cast-in-place pier is defined by using the displacement ductility ratio . The displacement ductility ratio is calculated as follows:
where: is the maximum displacement of pier top obtained from dynamic analysis; is the horizontal residual displacement of pier top after earthquake; is the relative displacement of pier top corresponding to the equivalent yield point obtained from the skeleton curve.
Muntasir Billah et al. [10] quantified the damage state from slight damage to collapse with the displacement ductility ratio. Define no damage as . Slight damage is . Moderate damage as . Extensive damage as . Collapse as . Where is the displacement ductility ratio of the longitudinal bar when it reaches the yield point, is the displacement ductility ratio corresponding to the equivalent yield point obtained from the skeleton curve, is the displacement ductility ratio corresponding to the strength degradation point of the bottom concrete, is the displacement ductility ratio when the pier reaches the limit displacement.
Using the hysteresis analysis of ABAQUS finite element models, as shown in Fig. 7, it can be found that the yield point displacement of the three is 20.85 mm, 15.20 mm, and 14.12 mm, the equivalent yield point displacement is 29.02 mm, 19.50 mm and 18.08 mm, the concrete strength degradation point displacement is 65.00 mm, 38.00 mm and 39.80 mm, and the limit point displacement is 97.92 mm, 95.28 mm and 97.11 mm according to the skeleton curve.
Fig. 7Determination of characteristic points
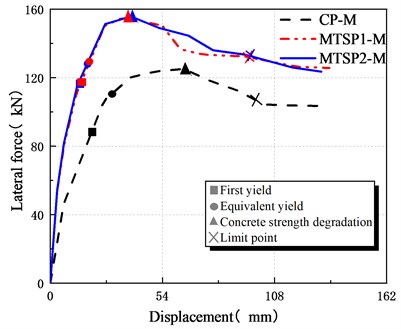
Table 4The characteristic horizontal displacement and displacement ductility coefficient of the numerical models
Code | / mm | / mm | / mm | / mm | ||||
CP-M | 20.85 | 29.02 | 65.00 | 97.92 | 1.00 | 1.39 | 3.12 | 4.70 |
MTSP1-M | 15.20 | 19.50 | 38.00 | 95.28 | 1.00 | 1.28 | 2.50 | 6.27 |
MTSP2-M | 14.12 | 18.08 | 39.80 | 97.11 | 1.00 | 1.28 | 2.82 | 6.88 |
The data in Table 4 are substituted into the damage classification specified by Muntasir Billah et al. [19]. The specific displacement ductility coefficient values for defining the different damage states of cast-in-place piers and mortise-tenon segmental piers are obtained as shown in Table 5.
Table 5Value range of damage index determined by μ∆
Damage state | Performance level | Functional level | Displacement ductility ratio | ||
CP-M | MTSP1-M | MTSP2-M | |||
/ | Intact | Intact | ≤ 1.00 | ≤ 1.00 | ≤ 1.00 |
Slight damage | Crack | Intact | 1.00 <≤ 1.39 | 1.00 <≤ 1.28 | 1.00 <≤ 1.28 |
Moderate damage | Yield | Easy to recover | 1.39 <≤ 3.12 | 1.28 <≤ 2.50 | 1.28 <≤ 2.82 |
Extensive damage | Local failure | Life threatening | 3.12 <≤ 4.70 | 2.50 <≤ 6.27 | 2.82 < ≤ 6.88 |
Collapse | Strength degradation | Collapse | > 4.70 | > 6.27 | > 6.88 |
4. Seismic vulnerability analysis
4.1. Selection and input of ground motion records
This paper adopts the method of selecting ground motion based on the design response spectrum. In ground motions selection, the design acceleration time history shall not be less than three groups to ensure randomness. According to the code for seismic design of highway bridges [16], the time history in the same direction between any two groups shall meet the following formula:
where: and are the values of point of time history and ,respectively.
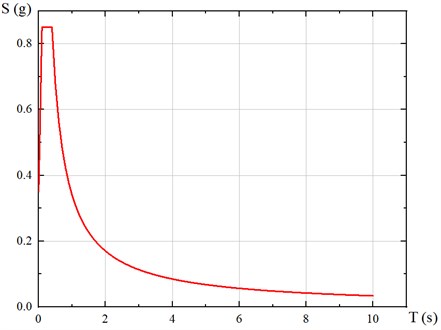
In this paper, according to the code [16], it is assumed that the seismic fortification category of the bridge is B, the seismic fortification intensity is VIII (0.2 g), the seismic measures of the bridge is IV, the site category is III, and the damping ratio of the structure according to the code is 0.05. The design acceleration response spectrum S (T) is determined by the following formula:
where: is the period (s); is the maximum period of the linear rising section of the response spectrum, with a value of 0.1 s; is the characteristic period (s), with a value of 0.40 s.
is the maximum value of the design acceleration response spectrum (g), which is determined by the following formula:
where: is the seismic importance coefficient, with a value of 1.7; is the site coefficient, with a value of 1.0; is the damping adjustment coefficient, which is 1.0 according to the following formula; is the horizontal basic ground motion peak acceleration, with a value of 0.2 g:
From above:
The design acceleration response spectrum is shown in Fig. 8.
Fig. 8Design acceleration response spectrum
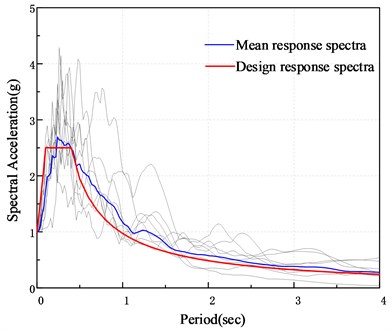
Reasonably selecting seismic waves from a large number of natural wave records is an important part of structural response analysis and vulnerability analysis. According to the code for seismic design of highway bridges [16] and scholars’ research on seismic wave selection [26-29], 10~20 seismic waves should be selected to ensure the reliability of vulnerability analysis results.
In this paper, 15 far-field vibration records with magnitude not less than 6.0 are selected from peer ground motion database [30] and processed by amplitude modulation. Table 6 is detail parameters. The seismic acceleration response spectrum after peak acceleration normalization is shown in Fig. 9.
Table 6Selection of far-field records
Number | RSN | Earthquake name | Time | Station | Magnitude | / km | T90% / s |
1 | 68 | San_Fernando | 1971 | LA-Hollywood_Stor_FF | 6.6 | 22.8 | 13.4 |
2 | 122 | Friuli_Italy-01 | 1976 | Codroipo | 6.5 | 33.4 | 19.0 |
3 | 169 | Imperial Valley-06 | 1979 | Delta | 6.5 | 22.0 | 51.4 |
4 | 721 | Superstition Hills-02 | 1987 | El Centro Imp. Co. Cent | 6.5 | 18.2 | 35.7 |
5 | 737 | Loma Prieta | 1989 | Agnews State Hospital | 6.9 | 24.6 | 27.5 |
6 | 752 | Loma Prieta | 1989 | Capitola | 6.9 | 15.2 | 13.2 |
7 | 1115 | Kobe_ Japan | 1995 | Sakai | 6.9 | 28.1 | 60.1 |
8 | 1220 | Chi-Chi_ Taiwan | 1999 | CHY063 | 7.6 | 72.2 | 43.4 |
9 | 1221 | Chi-Chi_ Taiwan | 1999 | CHY065 | 7.6 | 83.4 | 38.0 |
10 | 3937 | Tottori_ Japan | 2000 | SMN005 | 6.6 | 45.7 | 34.2 |
11 | 4200 | Niigata_ Japan | 2004 | NIG010 | 6.6 | 57.7 | 90.3 |
12 | 4883 | Chuetsu-oki_ Japan | 2007 | Niigata Nishi Kaba District | 6.8 | 29.9 | 51.4 |
13 | 5471 | Iwate_ Japan | 2008 | AKT016 | 6.9 | 48.3 | 40.5 |
14 | 6923 | Darfield_ New Zealand | 2010 | Kaiapoi North School | 7 | 30.5 | 20.1 |
15 | 8133 | Christchurch_ New Zealand | 2011 | SLRC | 6.2 | 31.8 | 15.4 |
Note: is fault distance, T90% is the duration between the time when the accumulated energy reaches 5 % to 95 % | |||||||
Fig. 9Acceleration response spectrum
4.2. Time history analysis results
ABAQUS software is used for dynamic time history analysis of two types of piers. Rayleigh damping is used for damping. The damping ratio is 5 %. The damping matrix expression is:
where: [] and [] is the mass matrix and stiffness matrix of the structure, respectively; is the -th circular frequency of structural vibration; is the -th circular frequency of structural vibration.
Generally is the fundamental frequency of the structure, and is the second frequency.
For the model setting:
The axial force at the pier top and the transverse pseudo-static force are removed. Then the equivalent mass is used to simulate the action of the superstructure, which is still set according to the 10 % axial compression ratio (64.9 t). The linear perturbation analysis step is added to obtain the modal frequency of the structure. Then the Rayleigh damping coefficients and are obtained according to the above formula and substituted into the finite element model.
In the following time history analysis:
The first step is to apply self-weight and prestress. The second step is to apply the acceleration time history data at the bottom of the pier’s base.
Table 7The natural vibration frequency and Rayleigh damping ratio of models
Code | Damping ratio | The primary natural frequency | The second natural frequency | ||
CP-M | 0.05 | 12.93 | 13.11 | 0.65 | 3.84×10⁻³ |
MTSP1-M | 0.05 | 12.54 | 12.76 | 0.63 | 3.95×10⁻³ |
MTSP2-M | 0.05 | 11.02 | 11.35 | 0.56 | 4.47×10⁻³ |
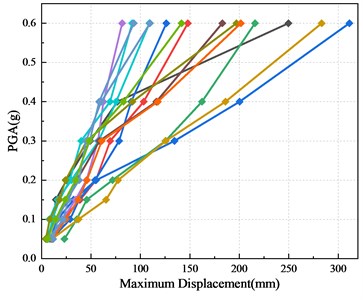
Fig. 10IDA curves of bridge pier models based on displacement ductility coefficient
a) CP-M
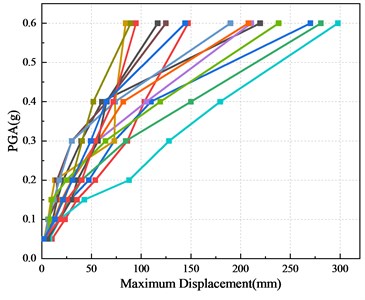
b) MTSP1-M
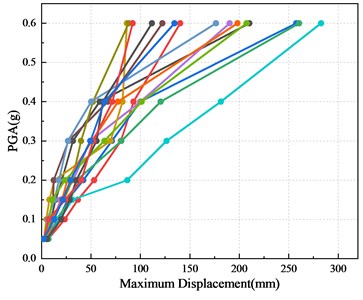
c) MTSP2-M
Based on this model and parameters, the incremental dynamic analysis (IDA) of CP-M, MTSP1-M and MTPS2-M is carried out successively with the selected 15 far-field vibration records. For class B and C bridges, the peak ground acceleration is adjusted to 0.05 g, 0.10 g, 0.15 g, 0.20 g, 0.30 g, and 0.40 g according to the specifications, that is, the corresponding seismic fortification measures are 6, 7, 8 and 9 degrees. To obtain the influence of high earthquake intensity on the performance of piers, the dynamic time history analysis of 0.6 g peak acceleration of piers is also carried out. Fifteen IDA curves can be obtained, as shown in Fig. 10. With the increase of the peak ground acceleration, the maximum displacement response of the pier top is increasing. When the peak ground acceleration is above 0.2 g, the increase rate of the maximum displacement response of the pier top is significantly faster. During the action of different seismic waves, the displacement response of piers is obviously different. The selection of different seismic waves has a great impact on IDA curves.
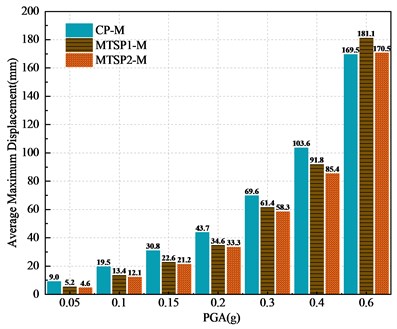
Take the average value of the maximum displacement of the pier top during the action of 15 seismic waves, as shown in Fig. 11. With the increase of PGA, the maximum horizontal displacement of the pier top continues to increase. In the same seismic peak acceleration less than 0.6 g, the average value of the maximum horizontal displacement of CP-M is greater than MTSP1-M and MTSP2-M. The increased initial prestress of the prestressing tendons can reduce the horizontal displacement of the pier top. When the PGA is 0.6 g, the displacement of the pier top of the mortise-tenon segmental pier increases sharply, which is greater than that of the cast-in-place pier. It shows that when the peak acceleration is lower than 0.6 g, the cast-in-place pier will produce a larger displacement response, and the mortise-tenon segmental pier will produce a larger displacement response during strong earthquake. But the specific seismic performance needs to be further studied.
Fig. 11Average maximum displacement of pier models’ cap
4.3. Probabilistic seismic demand models analysis of piers
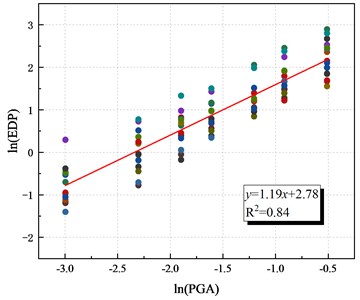
The displacement ductility coefficient data are obtained by IDA curves. Logarithm them. According to formula 6, the regression analysis of three piers based on displacement ductility coefficient is established, as shown in Fig. 12, the probabilistic seismic demand models are obtained. It can be found that there is an obvious linear relationship between the displacement ductility coefficient index of the logarithm processed data and PGA. is greater than 0.8, which has considerable reliability. Table 8 summarizes the parameters of the seismic demand model of each pier. The probability demand models of the two segmental piers based on the displacement ductility coefficient are relatively similar. The difference with the cast-in-place pier is not obvious.
Table 8Parameters of probabilistic seismic demand model
Code | ||
CP-M | 16.12 | 1.19 |
MTSP1-M | 18.73 | 1.42 |
MTSP2-M | 16.44 | 1.45 |
Fig. 12Probabilistic seismic demand model based on displacement ductility coefficient of bridge piers
a) CP-M
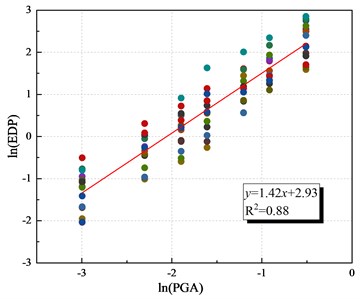
b) MTSP1-M
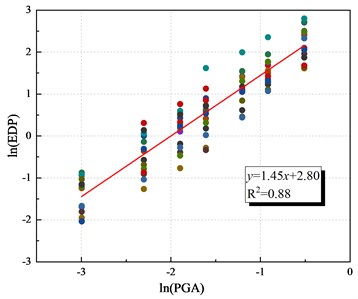
c) MTSP2-M
4.4. Vulnerability curves
The obtained coefficients and are substituted into Eq. (6b) to obtain the value of the median of seismic demand during the action of specific PGA. The lower limit value of damage index in different damage states is taken as , as shown in Table 9.
Table 9Sc of different damage states
Code | Damage states | |||
Slight damage | Moderate damage | Extensive damage | Collapse | |
CP-M | 1.00 | 1.39 | 3.12 | 4.70 |
MTSP1-M | 1.00 | 1.28 | 2.50 | 6.27 |
MTSP2-M | 1.00 | 1.28 | 2.82 | 6.88 |
The vulnerability curves of the three piers are shown in Fig. 13. It can be seen that with the increase of the PGA, the exceeding probability of the four damage states corresponding to the two types of piers increases. When the PGA is the same, the exceeding probability decreases in turn, the exceeding probability of slight damage is the largest, and the exceeding probability of collapse is the smallest.
Fig. 13Vulnerability curves of piers based on displacement ductility coefficient
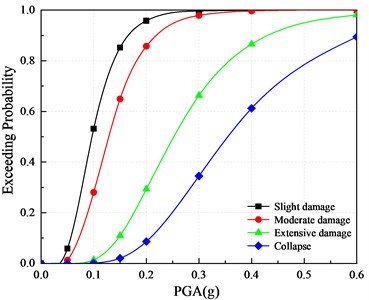
a) CP-M
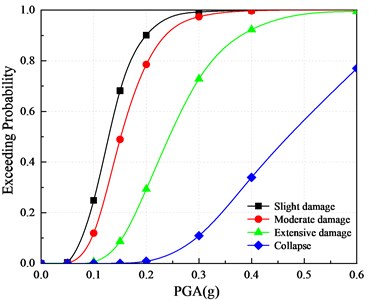
b) MTSP1-M
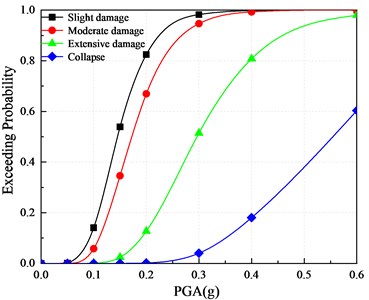
c) MTSP2-M
Fig. 14 shows the comparison of three models’ vulnerability curves for far-field seismic action with respect to the displacement ductility coefficient . It can be found that with the increase of PGA, the exceeding probability of slight damage, moderate damage and, collapse of mortise-tenon segmental piers are less than these of the cast-in-place pier. The increased initial prestress of prestressing tendons can reduce the exceeding probability of damage. For example, when the PGA is 0.2 g, the exceeding probability of slight and moderate damage in CP-M is 95.81 % and 85.73 %, in MTSP1-M is 90.13 % and 78.55 %, and in MTSP2-M is 82.45 % and 66.94 %. The exceeding probability of extensive damage for the two piers is similar, relatively. The exceeding probability of mortise-tenon segmental piers’ collapse is less than that of the cast-in-place pier, and the increase of initial prestress can reduce the exceeding probability of extensive damage. For example, during the seismic action with the PGA of 0.3 g, the exceeding probabilities of the collapse of CP-M, MTSP1-M, and MTSP2-M are 34.49 %, 10.93 %, 4.02 %.
It shows that under the condition that the displacement ductility coefficient is taken as the damage index of the three piers designed by the equivalence principle, the exceeding probability of slight damage, moderate damage, and collapse of the mortise-tenon segmental piers are less than these of the cast-in-place pier. The increased initial prestress can reduce the exceeding probability of the four damage states.
5. Analysis of different parameters
According to the numerical simulation of pseudo-static parameter analysis, the ratio of longitudinal reinforcement, shear span ratio, and axial compression ratio have a great impact on the seismic performance of mortise-tenon segmental piers. Through comparison, it is found that MTSP2-M has better seismic performance during all levels of earthquake actions, so this paper selects MTSP2-M as the basic model for parameter analysis to further expand the influence of longitudinal reinforcement ratio, shear span ratio, and axial compression ratio parameters on vulnerability curve.
Fig. 14Comparison of vulnerability curves of each pier based on displacement ductility coefficient
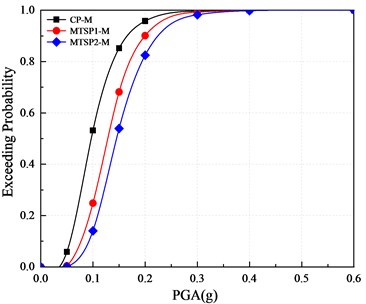
a) Slight damage
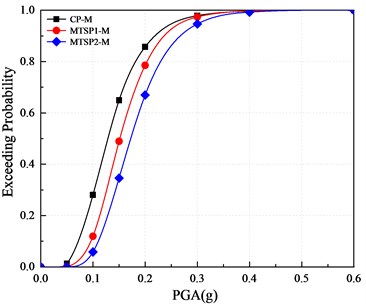
b) Moderate damage
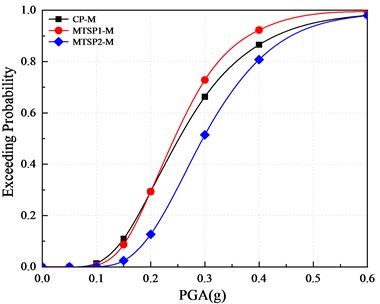
c) Extensive damage
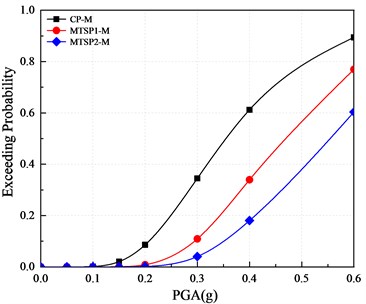
d) Collapse
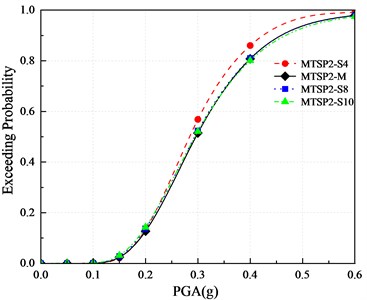
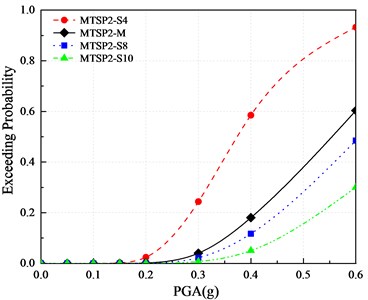
5.1. Longitudinal reinforcement ratios
In this paper, the longitudinal reinforcement ratio is 0.65 % (MTSP2-S4), 0.98 % (MTSP2-M), 1.31 % (MTSP2-S8), and 1.64 % (MTSP2-S10), as shown in Fig. 15. First, the damage quantification index limit is obtained by pseudo-static analysis, as shown in Table 10 and Table 11.
Table 10The characteristic horizontal displacement and displacement ductility coefficient of the numerical models
Code | / mm | / mm | / mm | / mm | ||||
MTSP2-S4 | 14.54 | 18.88 | 40.00 | 61.58 | 1.00 | 1.30 | 2.75 | 4.24 |
MTSP2-M | 14.12 | 18.08 | 39.80 | 97.11 | 1.00 | 1.28 | 2.82 | 6.88 |
MTSP2-S8 | 17.93 | 24.31 | 38.67 | 108.90 | 1.00 | 1.36 | 2.16 | 6.07 |
MTSP2-S10 | 19.38 | 25.45 | 37.62 | 130.52 | 1.00 | 1.31 | 1.94 | 6.73 |
According to the vulnerability assessment method, the vulnerability assessment is carried out for four mortise-tenon segmental piers with different longitudinal reinforcement ratios. The vulnerability curves are drawn as shown in Fig. 16. According to the curves, the influence of different longitudinal reinforcement ratios on the damage probability is obtained to assess its impact on the damage degree. It can be seen from Fig. 16 that the longitudinal reinforcement ratio has a great impact on the vulnerability of mortise-tenon segmental piers. With the increase of the reinforcement ratio, the exceeding probabilities of slight damage, moderate damage, extensive damage, and collapse are decreasing, constantly. Increasing the longitudinal reinforcement ratio can reduce the exceeding probabilities of the four damage states.
Fig. 15Comparison details of reinforcement ratio parameters of different energy dissipation reinforcements (units: mm)
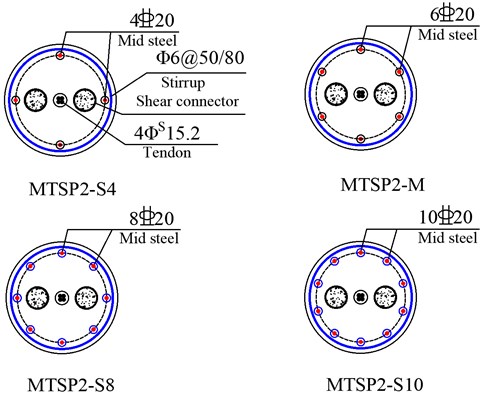
Fig. 16Comparison of vulnerability curves of each pier based on displacement ductility coefficient
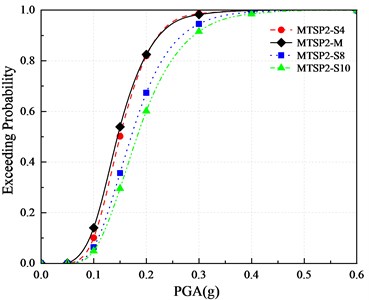
a) Slight damage
b) Moderate damage
c) Extensive damage
d) Collapse
Table 11Value range of damage index determined by μ∆
Damage state | Performance level | Functional level | Displacement ductility ratio | |||
MTSP2-S4 | MTSP2-M | MTSP2-S8 | MTSP2-S10 | |||
/ | Intact | Intact | ≤ 1.00 | ≤ 1.00 | ≤ 1.00 | ≤ 1.00 |
Slight damage | Crack | Intact | 1.00 < ≤ 1.30 | 1.00 < ≤ 1.28 | 1.00 < ≤ 1.36 | 1.00 < ≤ 1.31 |
Moderate damage | Yield | Easy to recover | 1.30 < ≤ 2.75 | 1.28 < ≤ 2.82 | 1.36 < ≤ 2.16 | 1.31 < ≤ 1.94 |
Extensive damage | Local failure | Life threatening | 2.75 < ≤4.24 | 2.82 < ≤ 6.88 | 2.16 < ≤ 6.07 | 1.94 < ≤ 6.73 |
Collapse | Strength degradation | Collapse | > 4.24 | > 6.88 | > 6.07 | > 6.73 |
5.2. Aspect ratios and axial compression ratios
To study the influence of aspect ratios and axial compression ratios on the seismic performance of mortise-tenon segmental piers, six working conditions including test correction models are comprehensively considered and designed. The axial compression ratios are 5 %, 10 % and 15 %, respectively. The aspect ratios are 5.4 and 4.2, respectively. The number of segments is 4 and 3, respectively. As shown in Fig. 17. For MTSP2-M, the axial compression ratio is 10 %, the shear span ratio is 5.4, and the number of segments is 4. It is used as the comparative analysis model. First, the damage quantification index limit is obtained by pseudo-static analysis, as shown in Table 12 and Table 13.
Fig. 17Detailed comparison of aspect ratios and axial compression ratios of specimens
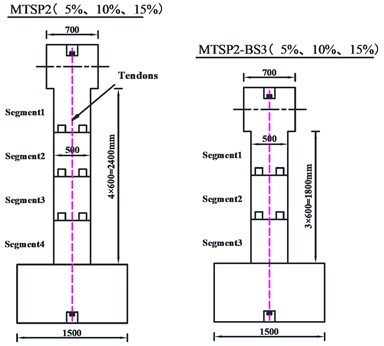
Table 12The characteristic horizontal displacement and displacement ductility coefficient of the numerical models
Code | / mm | / mm | / mm | / mm | ||||
MTSP2 (5 %) | 17.37 | 21.93 | 52.51 | 70.89 | 1.00 | 1.26 | 3.02 | 4.08 |
MTSP2-M | 14.12 | 18.08 | 39.80 | 97.11 | 1.00 | 1.28 | 2.82 | 6.88 |
MTSP2 (1 5%) | 14.70 | 18.27 | 36.25 | 60.61 | 1.00 | 1.24 | 2.47 | 4.12 |
MTSP2-BS3 (5 %) | 13.35 | 15.47 | 27.42 | 57.48 | 1.00 | 1.59 | 2.05 | 4.31 |
MTSP2-BS3 (10 %) | 9.73 | 11.23 | 26.53 | 42.71 | 1.00 | 1.15 | 2.73 | 4.39 |
MTSP2-BS3 (15 %) | 11.16 | 13.69 | 26.44 | 48.41 | 1.00 | 1.23 | 2.37 | 4.34 |
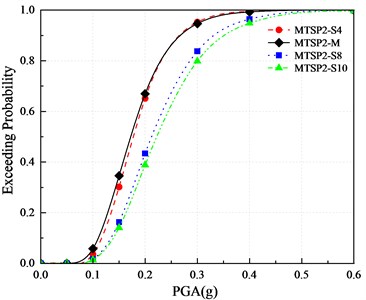
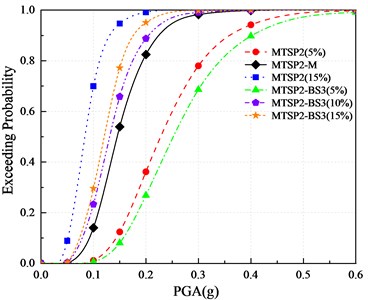
According to the vulnerability assessment method, the vulnerability assessment is carried out for 6 mortise-tenon segmental piers with different axial compression ratios and aspect ratios. The vulnerability curves are drawn as shown in Fig. 18. According to the curves, the influence of different axial compression ratios and aspect ratios on the damage probabilities are obtained to evaluate its influence on the damage degree.
Table 13Value range of damage index determined by μ∆
Damage state | Performance level | Functional level | Displacement ductility ratio | |||||
MTSP2 (5 %) | MTSP2-M | MTSP2 (15 %) | MTSP2-BS3 (5 %) | MTSP2-BS3 (10 %) | MTSP2-BS3 (15 %) | |||
/ | Intact | Intact | ≤ 1.00 | ≤ 1.00 | ≤ 1.00 | ≤ 1.00 | ≤ 1.00 | ≤ 1.00 |
Slight damage | Crack | Intact | 1.00 < ≤ 1.26 | 1.00 < ≤ 1.28 | 1.00 < ≤ 1.24 | 1.00 < ≤ 1.59 | 1.00 < ≤ 1.15 | 1.00 < ≤ 1.23 |
Moderate damage | Yield | Easy to recover | 1.26 < ≤ 3.02 | 1.28 < ≤ 2.82 | 1.24 < ≤ 2.47 | 1.59 < ≤ 2.05 | 1.15 < ≤ 2.73 | 1.23 < ≤ 2.37 |
Extensive damage | Local failure | Life threatening | 3.02 < ≤ 4.08 | 2.82 < ≤ 6.88 | 2.47 < ≤ 4.12 | 2.05 < ≤ 4.31 | 2.73 < ≤ 4.39 | 2.37 < ≤ 4.34 |
Collapse | Strength degradation | Collapse | > 4.08 | > 6.88 | > 4.12 | > 4.31 | > 4.39 | > 4.34 |
Fig. 18Comparison of vulnerability curves of each pier based on displacement ductility coefficient
a) Slight damage
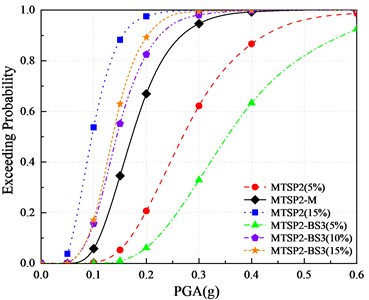
b) Moderate damage
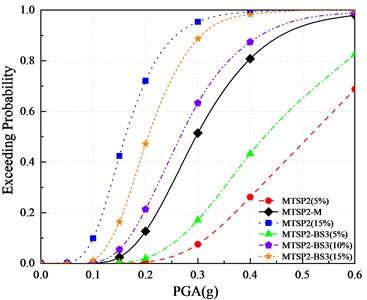
c) Extensive damage
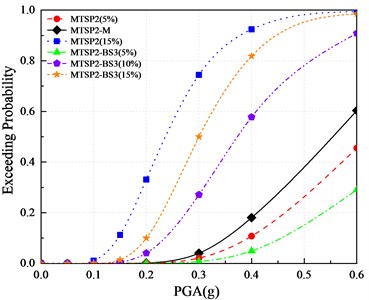
d) Collapse
It can be seen from the figures:
(1) With the increase of axial compression ratios, the exceeding probabilities of the four damage states increases.
(2) When the axial compression ratio is 10 %, the exceeding probabilities of MTSP2-M with a 5.4 aspect ratio are smaller than those of MTSP2-BS3 (10 %) with a 4.2 aspect ratio. When the axial compression ratio is 5 %, MTSP2 (5 %) with a 5.4 aspect ratio has a smaller exceeding probability of extensive damage than MTSP2-BS3 (5 %) with a 4.2 aspect ratio. But in other cases, the increase of aspect ratio increases the exceeding probabilities of four damage states. In general, the increase in aspect ratio is not conducive to improving seismic performance. Setting reasonable aspect ratios and axial compression ratios has a positive impact on seismic performance. MTSP2-M has a low exceeding probability, which can be considered to have good seismic performance.
6. Conclusions and discussions
6.1. Conclusions
In this paper, two types of piers (CP-M, MTSP1-M, MTSP2-M) are designed. The damage states are described and analyzed by pseudo-static tests. The damage index of seismic vulnerability analysis is determined. ABAQUS finite element software is used to establish finite element models of cast-in-place piers and mortise-tenon segmental piers and verify their accuracy. The incremental dynamic analysis of the finite element models is carried out. The seismic vulnerability assessment is carried out based on the probabilistic demand model. The effects of various parameters on the vulnerability of mortise-tenon segmental piers are studied by changing the reinforcement ratios of longitudinal bars, the axial compression ratios, and the aspect ratios. The conclusions are as follows:
1) According to the pseudo-static cyclic loading test results, the plastic hinge zone of MTSP specimens had less damage and no annular cracks. The cracking degrees of MTSP specimens were less than that of the CP specimen.
2) The exceeding probabilities of slight damage, moderate damage, and collapse of mortise-tenon segmental piers are less than those of cast-in-place piers. The increased initial prestressing force can reduce the exceeding probabilities of four damage states, which can be considered that mortise-tenon segmental piers have better seismic performance.
3) The longitudinal reinforcement ratios, axial compression ratios, and aspect ratios have a great impact on the vulnerability of mortise-tenon segmental piers. With the reduction of reinforcement ratios or the increase of axial compression ratios, the damage probability is increased. The increase in aspect ratio is not conducive to improving the seismic performance of mortise-tenon segmental piers.
6.2. Discussions
Generally, the damage index was obtained based on a great deal of data. Recently, there are not enough testing cases of prefabricated segmental bridge piers. And the result in the paper was obtained from only two numerical models. There could be some inevitable errors in the results, which are within the acceptable range. Further research need to be conducted for the damage index of prefabricated segmental bridge columns based on more experimental and numerical models. And the results would be more precise.
Due to the calculation problem of ABAQUS, this paper selects 15 seismic waves for research, which can fully meet the requirements of the code. However, the more extensive seismic waves are selected, the more accurate the research on seismic performance will be. Therefore, the selection of seismic waves can be further expanded.
Seismic vulnerability analysis should be carried out for segmental piers with multiple parameters to obtain the optimal design scheme for this type of pier. This paper mainly conducts in-depth research on the parameters with greater influence and less research on the parameters with less sensitivity. More parameter analysis should be carried out in the later stage.
References
-
C. S. Shim, C.-H. Chung, and H. H. Kim, “Experimental evaluation of seismic performance of precast segmental bridge piers with a circular solid section,” Engineering Structures, Vol. 30, No. 12, pp. 3782–3792, Dec. 2008, https://doi.org/10.1016/j.engstruct.2008.07.005
-
Y. Zhai and Y. Zhang, “Damage index analysis of prefabricated segmental bridge columns under cyclic loading,” Latin American Journal of Solids and Structures, Vol. 15, No. 11, Dec. 2018, https://doi.org/10.1590/1679-78254986
-
T. Li, H. Qu, Z. Wang, H. Wei, and S. Jiang, “Seismic performance of precast concrete bridge columns with quasi-static cyclic shear test for high seismic zones,” Engineering Structures, Vol. 166, pp. 441–453, Jul. 2018, https://doi.org/10.1016/j.engstruct.2018.03.086
-
E. Nikbakht and K. Rashid, “Investigation on seismic performance and functionality of self-centring post-tensioned segmental columns,” Structure and Infrastructure Engineering, Vol. 14, No. 6, pp. 730–742, Jun. 2018, https://doi.org/10.1080/15732479.2017.1359632
-
S. Motaref, M. S. Saiidi, and D. Sanders, “Shake table studies of energy-dissipating segmental bridge columns,” Journal of Bridge Engineering, Vol. 19, No. 2, pp. 186–199, Feb. 2014, https://doi.org/10.1061/(asce)be.1943-5592.0000518
-
C. Shim, S. Lee, S. Park, and C. Koem, “Experiments on prefabricated segmental bridge piers with continuous longitudinal reinforcing bars,” Engineering Structures, Vol. 132, pp. 671–683, Feb. 2017, https://doi.org/10.1016/j.engstruct.2016.11.070
-
H.-H. Hung, Y.-C. Sung, K.-C. Lin, C.-R. Jiang, and K.-C. Chang, “Experimental study and numerical simulation of precast segmental bridge columns with semi-rigid connections,” Engineering Structures, Vol. 136, pp. 12–25, Apr. 2017, https://doi.org/10.1016/j.engstruct.2017.01.012
-
Weixiang Sun, “Numerical study on structure type and seismic performance of assembling pre-stressed bridge piers,” (in Chinese), Beijing Jiaotong University, 2019.
-
Zhen Wang, “Research on seismic performance and design method of self-centering precast segmental UHPC hollow bridge piers,” (in Chinese), Southeast University, 2018.
-
A. H. M. Muntasir Billah and M. S. Alam, “Seismic fragility assessment of concrete bridge pier reinforced with superelastic shape memory alloy,” Earthquake Spectra, Vol. 31, No. 3, pp. 1515–1541, Aug. 2015, https://doi.org/10.1193/112512eqs337m
-
He Yibin et al., “Seismic fragility estimation of corroded reinforced concrete girder bridges,” (in Chinese), Journal of Beijing University of Technology, Vol. 40, No. 8, pp. 1144–1150, 2014.
-
Y. Ding, D. Wu, J. Su, Z.-X. Li, L. Zong, and K. Feng, “Experimental and numerical investigations on seismic performance of RC bridge piers considering buckling and low-cycle fatigue of high-strength steel bars,” Engineering Structures, Vol. 227, p. 111464, Jan. 2021, https://doi.org/10.1016/j.engstruct.2020.111464
-
M. Salkhordeh, E. Govahi, and M. Mirtaheri, “Seismic fragility evaluation of various mitigation strategies proposed for bridge piers,” Structures, Vol. 33, pp. 1892–1905, Oct. 2021, https://doi.org/10.1016/j.istruc.2021.05.041
-
N.-L. Tran, T.-H. Nguyen, V.-T. Phan, and D.-D. Nguyen, “Seismic fragility analysis of reinforced concrete piers of steel box girder bridges: A parametric study,” Materials Today: Proceedings, Vol. 38, pp. 2310–2315, 2021, https://doi.org/10.1016/j.matpr.2020.06.414
-
E. Ahmadi and M. M. Kashani, “Seismic vulnerability assessment of precast post-tensioned segmental bridge piers subject to far-fault ground motions,” Structures, Vol. 34, pp. 2566–2579, Dec. 2021, https://doi.org/10.1016/j.istruc.2021.09.041
-
“Codes for Seismic Designs of Highway Bridges,” (in Chinese), TG/T 2231-01-2020, People’s Communications Press, Beijing, 2020.
-
M. J. N. Priestley, F. Seible, and G. Calvi, Seismic Design and Retrofit of Bridges. New York: John Wiley & Sons, 1996.
-
Y. Ni, C. Hao, and Y. Xu, “Seismic performance analysis of self-centering segment piers with mortise-tenon shear connectors based on cyclic pseudo-static test,” Journal of Vibroengineering, Vol. 23, No. 7, pp. 1621–1639, Nov. 2021, https://doi.org/10.21595/jve.2021.22029
-
Z. He, “Study on seismic behavior and seismic fragility evaluation of prefabricated assembled bridge piers of socket connection with UHPC materials,” (in Chinese), Beijing Jiaotong University, 2020.
-
D. H. Tavares, J. E. Padgett, and P. Paultre, “Fragility curves of typical as-built highway bridges in eastern Canada,” Engineering Structures, Vol. 40, pp. 107–118, Jul. 2012, https://doi.org/10.1016/j.engstruct.2012.02.019
-
K. Ramanathan, R. Desroches, and J. E. Padgett, “A Comparison of pre – and post-seismic design considerations in moderate seismic zones through the fragility assessment of Multispan bridge classes,” Engineering Structures, Vol. 45, pp. 559–573, Dec. 2012, https://doi.org/10.1016/j.engstruct.2012.07.004
-
O.-S. Kwon and A. S. Elnashai, “Fragility analysis of a highway over-crossing bridge with consideration of soil-structure interactions,” Structure and Infrastructure Engineering, Vol. 6, No. 1-2, pp. 159–178, Feb. 2010, https://doi.org/10.1080/15732470802663870
-
“HAZUS99 user’s manual,” National Institute of Building Science, Washington, D C Federal Emergency, 1999.
-
“Guide specifications for design and construction of segmental concrete bridges,” American Association of State Highway, Transportation Officials (Aashto), Washington, 2003.
-
“HAZUS-MH software,” Federal Emergy Management Agency (Fema), Washington, 2003.
-
S. Li, “Selection and Scaling of Ground Motion Records Based on Target Spectra in Xi’an Region,” (in Chinese), Harbin Institute of Technology, 2016.
-
D. Wang, “Ground Motion Records Selection Methods for Structural Seismic Fragility Analysis,” (in Chinese), Harbin Institute of Technology, 2016.
-
F. Xie, “Study and Evaluation on Selecting and Scaling of Ground Motions,” (in Chinese), Harbin Institute of Technology, 2015.
-
Z. Hu et al., “Seismic vulnerability analysis of precast segmental bridge piers,” (in Chinese), China Civil Engineering Journal, Vol. 55, No. 1, pp. 89–99, 2022, https://doi.org/10.15951/j.tmgcxb.2022.01.006
-
“PEER Strong Motion Database.” Pacific Earthquake Engineering Research Center. http://peer.berkeley.edu/peer_ground_motion_database
About this article

The authors have not disclosed any funding.
The datasets generated during and/or analyzed during the current study are available from the corresponding author on reasonable request.
Changshun Hao is mainly responsible for writing and testing. Yongjun Ni is responsible for the guidance of finite element technology and test. Baodong Liu is responsible for the guidance of finite element. Bing Han and Hui Jiang is responsible for the guidance of test.
The authors declare that they have no conflict of interest.
