Abstract
In the past decades, more and more precast piers have been used in actual engineering, which brings convenience in construction and standardization of production. However, precast piers still have some shortcomings, such as shear slip between segments and poor energy dissipation. Thus, a self-centering mortise-tenon segmental bridge pier was proposed in this paper. To research the seismic performance of the self-centering mortise-tenon segment piers, three scaled model piers with their scale ratio as 1:3 were designed and prefabricated, namely as a cast-in-place model pier (CP) and 2 self-centering mortise-tenon segment model piers (designated as MTSP1 and MTSP2) with the initial pretension of 1302 MPa and 1488 MPa, respectively. The cyclic pseudo-static tests of the three piers were carried out. The comparison analysis was made respecting to the test results including the damage form, hysteretic characteristics, skeleton curve, energy dissipation capacity, residual displacement and equivalent stiffness of the three specimens. It was shown that MTSP specimens had higher horizontal bearing capacity. While the yield load, ultimate load, displacement ductility coefficient and initial stiffness of MTSP1 and MTSP2 were higher than those of CP. The MTSP had better performance considering the above aspects. The mean value of the residual displacement of MTSP2 was lower than that of CP 21.14 % and 29. 72 % respectively, as the drift ratio reaching 5 %. The MTSP specimens had better self-centering capacity due to the increased pretension stress which reducing the residual displacement greatly. The energy dissipation reinforcements improved the energy dissipation capacity of the segmental assembled piers. Based on the ABAQUS model, the numerical simulation was carried out and compared with the experimental data. MTSP had great energy dissipation capacity and self-centering capacity. It was suggested that MTSP should be used to make up for the deficiency of segmental assembled pier and improve the seismic performance of segmental assembled pier.
Highlights
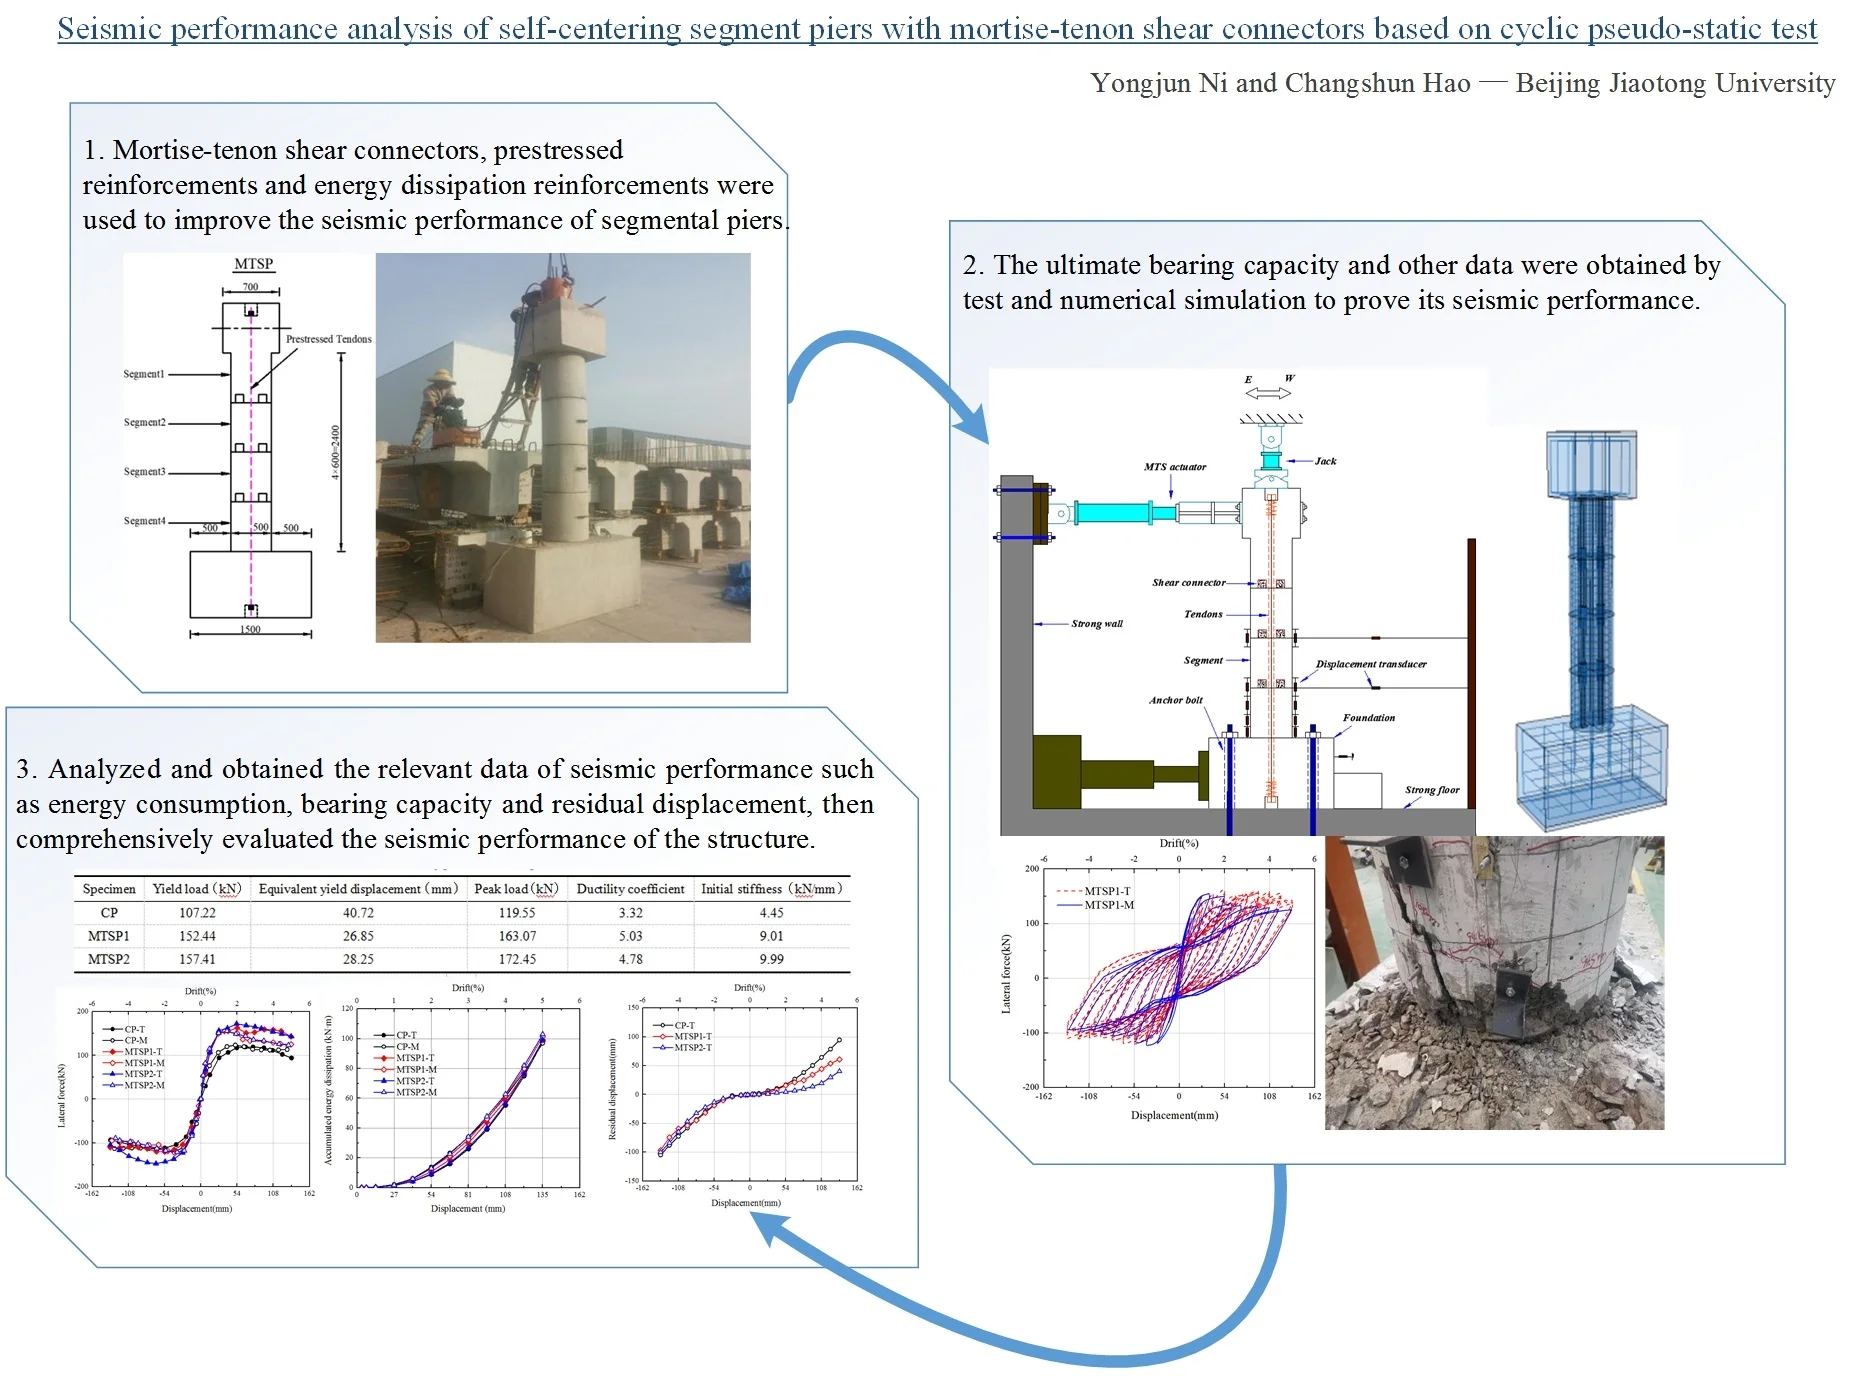
- Self-centering mortise-tenon segment model piers have two mortise-tenon shear connectors, prestressed reinforcements and energy dissipation reinforcements to improve the seismic performance.
- The ultimate bearing capacity and other data were obtained by test and numerical simulation to prove its seismic performance.
- Based on the test and simulation data, the seismic performance of mortise-tenon segment piers are comprehensively evaluated.
- The structure is a new type of structure.
- The mortise-tenon segmental pier was compared with the traditional cast-in-place pier.
1. Introduction
The prefabricated bridge components such as beams and piers were applied to the actual bridge engineering, attribute to the advantages such as the standardized construction and maintenance, the low carbon emission and environmental pollution, and the much fewer site occupation as well [1-3]. Mainly in the form of precast box girder, precast pier, precast caisson foundation, etc. [4]. However, due to the insufficient research on the seismic design method, the precast segment piers are rarely used in high and medium seismic design intensity areas [5].
The first segmental bridge – JFK Causeway in Corpus Christi, Texas was constructed in 1971. After that, the precast concrete members were widely used in low seismic intensity areas in the United States [6, 7]. Many scholars analyzed the seismic performance of segmental piers through the pseudo-static tests or shaking table tests combined with the results from the finite element analysis. The segmental piers were assembled by the precast segments and prestressed steel bars. And the assembling quality could be guaranteed. While there were some shortcomings such as the insufficient energy dissipation capacity and the large residual displacement under strong earthquake [8, 9].
To reduce the residual displacement, some scholars have carried out a series of studies. Hewes et al. [10] used the steel sleeve concrete in the plastic hinge area to reduce the residual displacement at the bottom of the pier and to increase the ductility of piers. Billington et al. [11] used the fiber reinforced concrete composite in the plastic hinge area of segmental piers to reduce the residual displacement and improve the bearing capacity. Bu Zhanyu [12] compared the difference of failure mode between the prestressed segment pier and the integral cast-in-place pier, and discussed the influence of energy dissipation reinforcement on the hysteretic characteristics of the precast segment piers. It was shown that the prestressed segment piers reduced the residual displacement effectively, while the energy dissipation capacity was still insufficient. Xia Zhanghua et al. [13] designed segmentally assembling piers with double columns. They analyzed the seismic performance of the piers with three connection modes as well. It was found that the seismic capacity of fabricated double column pier with the increased prestress bars could be close to that of cast-in-place pier.
To enhance energy dissipation capacity, some scholars have carried out a series of studies. Chou, C. et al. [14] allocated the energy dissipation device of steel bar brace at the bottom segment to enhance the energy dissipation capacity. Ou et al. [15, 16] selected the method of built-in energy dissipation reinforcements to increase the energy dissipation capacity of prestressed segment piers. Through the test, it was known that the more the amount of energy dissipation reinforcements, the lower the yield strength, the stronger the energy dissipation capacity of piers, while the residual deformation also increased accordingly. Zhang Yuye et al. [17] found that the semi cast-in-place and semi precast segmental pier had strong self-centering capacity. By using numerical model analysis, it was found that the reasonable determination of axial compression ratio and longitudinal reinforcement ratio improved the energy dissipation capacity of pier. Mo Jinsheng et al. [18] designed two identical 1:2.5 large-scale models to carry out the pseudo-static test of UHPC connected segmental piers. The test results showed that the ductility and energy dissipation capacity of the structure were improved greatly.
The balance between self-centering capacity and energy dissipation capacity is a highlighted issue. Zheng Wang et al. [19] pointed out that the increase of the axial compression ratio and the initial pretension stress was an effective way to reduce the residual displacement. Cai Zhong Kui et al. [20] proposed a method of using FRP bars as longitudinal bars to reduce the residual displacement after the earthquake. CFRP bars achieved smaller residual displacement and higher energy dissipation capacity. Weiding Zhu [21] proposed that the seismic performance could be improved by using high-strength steel bar to replace the ordinary reinforcing bars in the same area.
These tests and simulations promoted the development and application of the assembled segment piers, while there were some difficulties between the energy dissipation capacity and self-centering capacity. Increasing energy dissipation capacity reduced self-centering capacity, while reducing residual displacement reduced energy dissipation capacity [22] as well.
The innovations and main contributions of this paper are described as follows.
The experiment and finite element simulation of mortise-tenon segment piers were carried out to analyze their seismic performance.
In this paper, the mortise-tenon shear connectors and initial prestressing force were added to improve the shear performance and reduce the residual displacement.
By comparing and analyzing the damage mechanism, the seismic performance such as the bearing capacity, the energy dissipation capacity and the self-centering capacity of the assembled mortise-tenon segment piers, could reach a much balanced result in this paper.
2. Experimental program
2.1. Specimen design
To study the seismic performance of self-centering segment piers with mortise-tenon shear connectors, three equal size model piers were designed and manufactured. There were one cast-in-place pier (CP) and two assembled mortise-tenon segment piers (MTSP). The cast-in-place pier was mainly for the comparative analysis. The pretension stress levels of two assembled mortise-tenon segment piers were different. And the pretension of MTSP1 was 70 % ultimate strength standard values of steel strand. The pretension of MTSP2 was 80 % ultimate strength standard values of steel strand. The primary descriptions of specimens are shown in Table 1.
Table 1Serial numbers and characters of all specimens
Specimen name | Specimen description |
CP | Cast-in-place Pier |
MTSP1 | Mortise-Tenon Segmental Pier with 70 % pretension |
MTSP2 | Mortise-Tenon Segmental Pier with 80 % pretension |
The tests were designed with 1:3 large-scale models. As shown in Fig. 1, the pier specimens were a circular section with a diameter of 500 mm, the height of the pier specimens was 2400 mm, the effective loading height of the piers was 2700 mm. And the shear span ratio of specimens was 5.4. To simplify the treatment, the loading pier cap was precasted together with the top segment 1. This segment had two mortise holes at the bottom and no tenon. There were two cylindrical tenons with 100 mm diameter and 90 mm height, two mortise holes with 100 mm diameter and 90 mm depth in segment 2 and segment 3. Segment 4 was the bottom segment without mortise holes. And the top of it had the same tenons as segment 2 and segment 4. The layout of the tenons were consistent with the loading direction. The design strength of concrete was C40.
Fig. 1Geometry and section details for the tested specimens (units: mm)
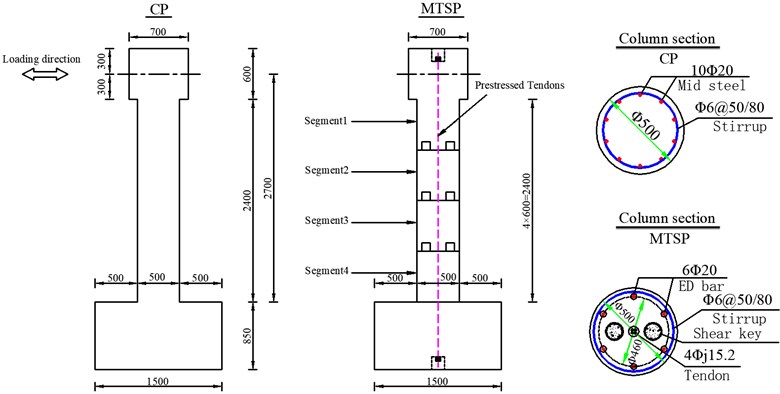
During the making of the MTSP model specimens, the PVC pipes with 50 mm diameter were embedded in pier caps, pier segments and foundations. Four Ø 15.2 steel strands were set in the PVC pipes. The effective area of the single prestressed bar was 140 mm2. Each segment was fixed with 6 metal pipes before the concrete placement to reserve 6 Ø60 mm connected pipes for the reinforcing bars. The single mental pipe was equipped with one HRB400 hot rolled ribbed longitudinal energy dissipation steel bar with a 20mm diameter. And the energy dissipation steel bars between two sections were grouted in the mental pipes. The reinforcement ratio of energy dissipation reinforcements was 0.96 %. The stirrups adopted the hot rolled plain bars with 6 mm diameter, with the spacing of 80 mm. The volume stirrup ratio was 0.31 %. And the protection layer thickness was 3 cm. The segment piers were finally assembled successfully after the prestressing and the pipes grouting. The specific parameters of the specimens are shown in Table 2. Ten hot rolled plain bars with 6mm diameter were added as the longitudinal bars and 4 mm diameter hot rolled plain round bars with 50mm spacing were added as stirrups to the improved shear capacity of shear connectors.
Table 2Specimen design parameters
Specimen name | Column height (mm) | Longitudinal reinforcement | (%) | Tendons | (%) | Stirrup spacing (mm) | (%) | Concrete compression strength (MPa) | Longitudinal reinforcement (MPa) |
CP | 2700 | 10D20 | 1.6 % | NA | NA | D6@50/80 | 0.49/0.31 | 43.87 | 436.67/624.92 |
MTSP1 | 2700 | 6D20 | 0.96 % | 4D15.2 | 0.29 | D6@80 | 0.31 | 43.87 | 436.67/624.92 |
MTSP2 | 2700 | 6D20 | 0.96 % | 4D15.2 | 0.29 | D6@80 | 0.31 | 43.87 | 436.67/624.92 |
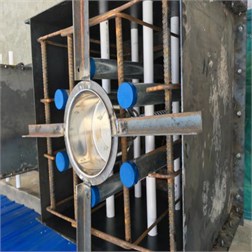
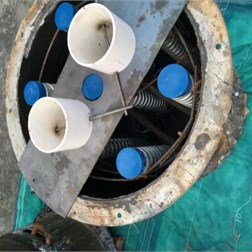
Fig. 2Specimen construction
a) Preparation of mold for the segment 1 and load-end
b) Preparation of mold for the segments
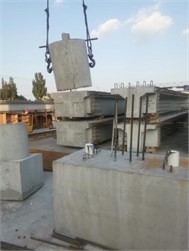
c) Specimen assembling 1
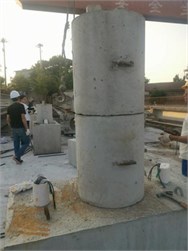
d) Specimen assembling 2
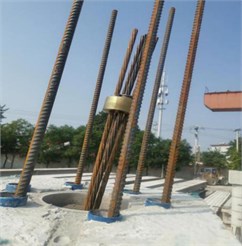
e) Preparation of prestressed tendons
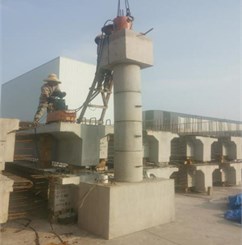
f) Prestressing tension operation
2.2. Construction process
For the CP and MTSP specimens, the segments were all prefabricated in advance and assembled in the factory. The processes are illustrated in Fig. 2 for them. Fig. 2(a-b) shows the preparation of the reinforcement cage, formwork and casting. Fig. 2(c-d) shows the assembling of MTSP. The segments were assembled by the gantry crane and the rings on each segment. Fig. 2(e) shows the preparation of prestressed tendons. Four prestressed tendons were installed into the ducts and then specific tensioning anchors were used. The prestressing tension operation shown in Fig. 2(f) was unidirectional tensions. The pre-tensile stress values of two specimens were 1302 MPa and 1488 MPa, respectively.
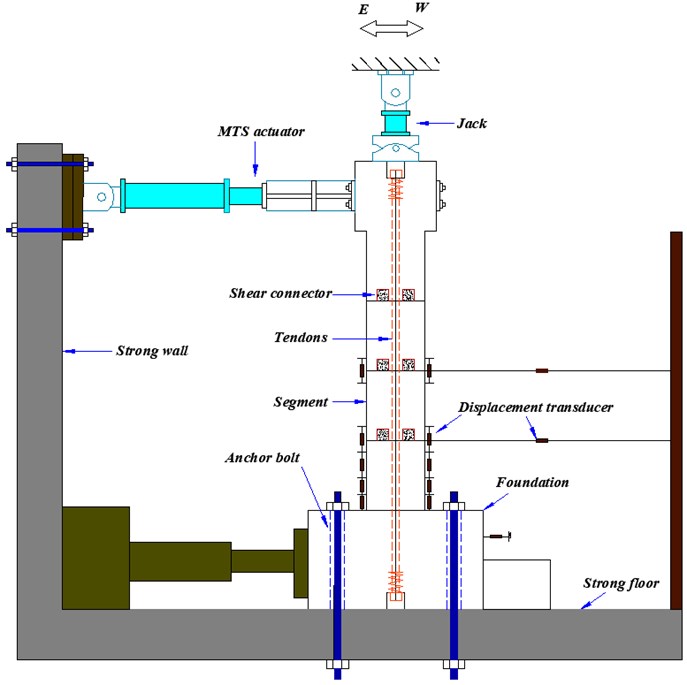
2.3. Test set-up and loading protocol
A schematic picture of the loading device was shown in Fig. 3. The 100 t vertical hydraulic jack was used for vertical loading. The axial compression ratio was 10 %. The horizontal force was loaded by the 50 t MTS servo actuator. Before the test, strain gauges were set at the bottom of the pier for the longitudinal reinforcements of the three specimens to measure the yielding values of the longitudinal reinforcements. However, most of the strain gauges were damaged during the test. So, the strain data of the longitudinal reinforcements could not be extracted. The displacement transducers located between the segments and in the plastic hinge areas at the bottom were used to measure the opening degree of the segments and calculate the curvature of the plastic hinge areas.
Fig. 3Pseudo-static test setup and loading
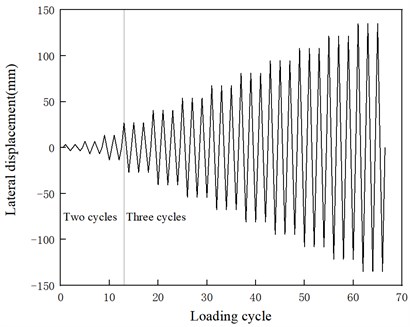
As shown in Fig. 4, the horizontal pseudo-static scheme of this test adopted the loading mode of displacement control, and it was specified that the westward direction was the positive value. The initial displacement amplitudes were ±3.375 mm, ±75 mm and ±5 mm, that is, the drift ratios were 0.125 %, 0.25 % and 0.5 %. The loading rate was 0.5 mm/s. Each stage was loaded twice. The drift ratio levels were increased from 1 % to 7 % with a tolerance of 0.5 %. The loading rate was increased to 1mm/s. And each stage was loaded three times. The phenomenon observation, recording and crack marking were carried out when the horizontal pseudo-static loading was loaded into the end of ±3.375 mm, ±6.75 mm, ±13.5 mm, ±27 mm, ±40.5 mm, ±54 mm, ±67.5 mm, ±81 mm, ±94.5 mm, ±108 mm, ±121.5 mm, ±135 mm, ±148.5 mm, ±162 mm, ±175.5 mm, ±189 mm. Considering that the horizontal bearing capacity of assembled segment pier did not varied significantly even as the drift was relatively large, and the maximum drift ratio of pier top was between 3 % and 5 % under the rare-occurred earthquake. The destructive large drift ratio could cause damage to superstructure [10, 14]. Thus, the 5 % drift ratio was designated as the allowable drift ratio, namely that, the maximum horizontal displacement of pier top was 135 mm. In conclusion, the test would be ended provided as the drift ratio reached 5 % or the bearing capacity dropped to 85 % of the maximum horizontal bearing capacity.
Fig. 4Loading protocol
3. Discussion of simulations and tests
3.1. The damage description of specimens
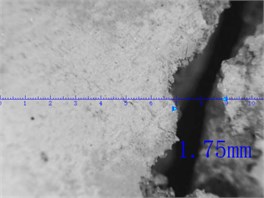
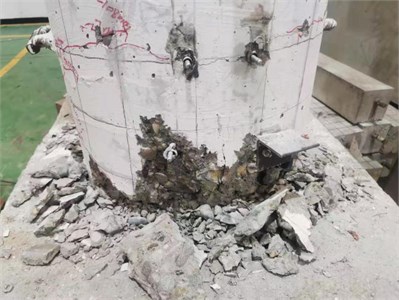
CP specimen failure was mainly in the bottom plastic hinge area. At the beginning stage of the test, multiple horizontal microcracks appeared in the plastic hinge area. With the increase of displacement, the cracks gradually increased and widened. When the displacement reached a certain degree, the cracks no longer increased any more. But the crack width gradually increased. As shown in Fig. 5(a), the maximum crack width reached 1.42 mm. In the intermediate stage of the test, the cracks gradually spread and extended. The annular cracks appeared in the plastic hinge area. The vertical cracks appeared and connected with the transverse cracks. The concrete at the bottom appeared spalling phenomenon, and the width of the transverse cracks reached 3 mm. As shown in Fig. 5(b), the maximum crack width reached 3.54 mm when loading to 94.5 mm. As shown in Fig. 6, the stirrups and longitudinal reinforcements were exposed. The horizontal bearing capacity of the pier specimen was reduced to 85 % of the maximum bearing capacity. The CP specimen was damaged.
The test processes of two assembled MTSP specimens were essentially same as the CP specimen. The failure process and the phenomenon of two MTSP specimens were similar, but different from that of the CP specimen.
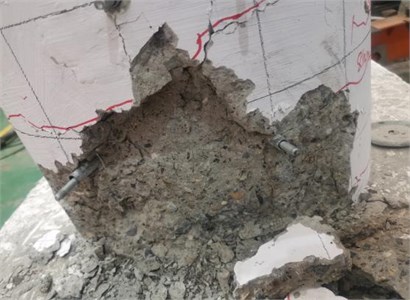
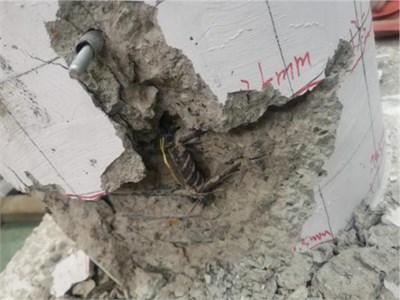
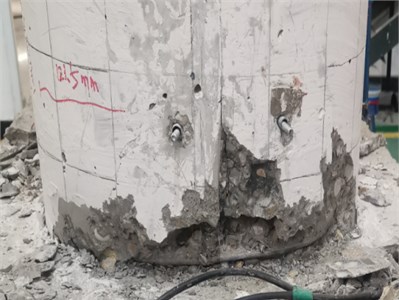
For MTSP1, there was no obvious crack at the initial stage of the test. The mortar dropped at the joint. When the displacement of the pier top reached 27 mm (drift ratio was 1 %), the opening appeared at the joint between the cushion cap and the bottom segment. The opening width was 1.33 mm. Before the displacement of the pier, the top reached 54 mm (drift ratio was 2 %), the joint between the cushion cap and the bottom segment opened and closed. A slight opening occurred at the joint of segments 2, 3 and the joint of segments 3, 4. As shown in Fig. 7(a) and Fig. 7(b), when the loading displacement amplitude was 40.5 mm, the maximum crack width was 0.6 mm. When the loading displacement amplitude was 54 mm, the joint opening width of segments 3,4 was 0.74 mm. In the middle stage of the test, the width and number of cracks increased gradually with the increase of the drift ratio. But there was no penetrating crack. The bottom concrete appeared spalling phenomenon. The specimen was finally judged as a failure when the bottom concrete was crushed, the height of the crush was about 20 cm. As shown in Fig. 7(c), the maximum crack width was 4.75 mm when the displacement amplitude reached 94.5 mm. The bottom stirrups were exposed. Compared with the CP specimen, the concrete spalling degree of MTSP1 specimen was lower. The number and width of cracks were far less than them of the CP specimen. As shown in Fig. 8. For MTSP2, the test phenomenon was similar to that of MTSP1. The final failure phenomenon was shown in Fig. 9.
Fig. 5The crack width of CP
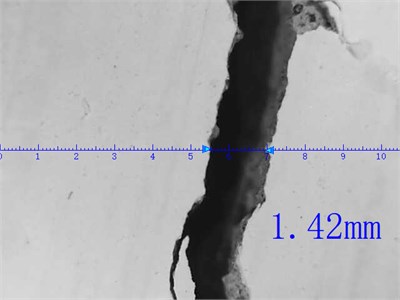
a) Maximum crack width at 54 mm loading amplitude
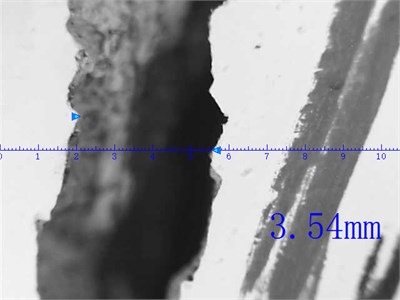
b) Maximum crack width at 94.5 mm loading amplitude
Fig. 6The failure mode of CP
a) East
b) West
In general, the failure of the CP specimen occurred in the plastic hinge area. The damage was accumulated within the concrete. The specimen was significantly damaged when the drift ratio reached 5 %. The damage of the plastic hinge area was greatly reduced by the continuous opening and closing of the joints. With the drift ratio increased, the opening of the joints between the segments was increasing. In addition, there was a minor slippage between the segments of MTSP specimens. The main reason was that there was a dry connection between the two segments. However, the integrity of MTSP specimens was strengthened by unbonded prestressed tendons. Special mortise-tenon shear connectors were set for the connections of segments played an important role in shear resistance and greatly reduced the slippage between the segments.
Fig. 7The crack width of MTSP1
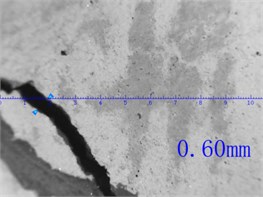
a) Maximum crack width at 40.5mm loading amplitude
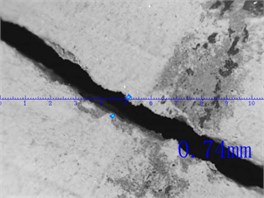
b) Width of joint opening of 3 and 4 segments under 54 mm loading amplitude
c) Maximum crack width at 94.5 mm loading amplitude
Fig. 8The failure mode of MTSP1
a) East
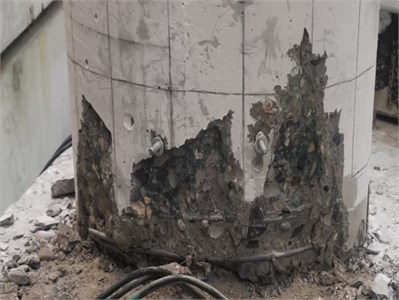
b) West
Fig. 9The failure mode of MTSP2
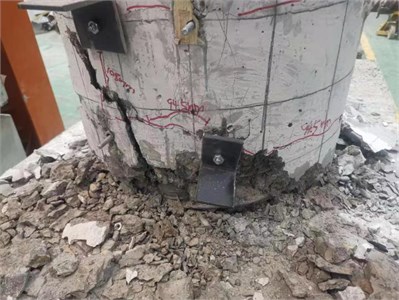
a) East
b) West
In conclusion, the failure processes and phenomenons of MTSP specimens were different from them of the CP specimen. When the drift ratio of the CP specimen was large, the number of cracks was increased, the length and the width of cracks were expanded, even though the annular cracks occurred. When the CP specimen was damaged, the plastic hinge area appeared serious concrete crushing and serious damage. The main damages of MTSP specimens were the opening and closing between joints of segments, between joint of segment and cushion cap. Due to the existence of mortise-tenon shear connectors, the slip between segments was minor. When the failure occurred, the concrete at the bottom segments appeared spalling. The damage degree was far less than that of the CP specimen. When the bearing capacity was reduced to 85 %, it could be repaired and reinforced. This method did not affect the normal operation.
3.2. Finite element software analog computation
ABAQUS software was used to establish the finite element model and simulated the results of pseudo-static cyclic loading. Among them, the basic tension compression curve formula [25] was selected for concrete constitutive material. The calculation formula of stress-strain curve of concrete under uniaxial compression:
where: is the parameter value of the descending section of the stress-strain curve of concrete under uniaxial tension, which is provided according to table C in the specification. Here, the value is 2.0027. According to the calculation formula of concrete elastic modulus, the elastic modulus is obtained. 105/(2.2+34.7/) = 3.34×10⁴. is the measured value of uniaxial tensile strength of concrete 0.395 0.55(1–1.645)0.45= 2.53 MPa, which is taken as the measured value of C40 concrete, where is the brittleness reduction factor of high strength concrete, and the value is 1.0. is the coefficient of variation, which can be calculated according to the formula /(1–1.645) of compressive strength test value and standard value 0.237. is the peak tensile strain of concrete corresponding to the measured value of uniaxial tensile strength, which is taken as 1.08×10⁻⁴ according to the interpolation method in table C of the code. is the damage evolution parameter of concrete under uniaxial tension.
The calculation formula of stress-strain curve of concrete under uniaxial compression was as follows:
where: is the parameter value of the descending section of the stress-strain curve of concrete under uniaxial compression. Fang Zihu et al. [26] of Shenzhen University put forward the calculation formula of the parameter value, and calculated = 0.1570.785– 0.905 = 2.15 according to the formula. is the measured value of uniaxial compressive strength of concrete, which is taken as the measured value = 43.87 MPa of C40 concrete. is the peak compressive strain of concrete corresponding to the measured value of uniaxial compressive strength, which is taken as 1.84×10⁻³ according to the interpolation method in table C of the code. is the damage evolution parameter of concrete under uniaxial compression.
There are three types of concrete models that can be used directly in ABAQUS. The concrete damage plastic (CDP) model in ABAQUS can show the damage of concrete from tension to compression. Thus, CDP model was used in the concrete model. The double broken line model was adopted in the steel constitutive model.
The pre-stress of prestressed reinforcement was realized by cooling method, and the cooling value was calculated according to the formula:
where is the expansion coefficient of prestressed reinforcement, and the value is 1.0×10⁻⁵.
The embedded region method was used to embed the energy consuming steel bars and stirrups into the concrete. The friction between the joints of two segments and between the segments and the pier bottom adopted the surface to surface contact method, and the “penalty” friction formula was used in the tangential direction.
3.3. Hysteresis behavior
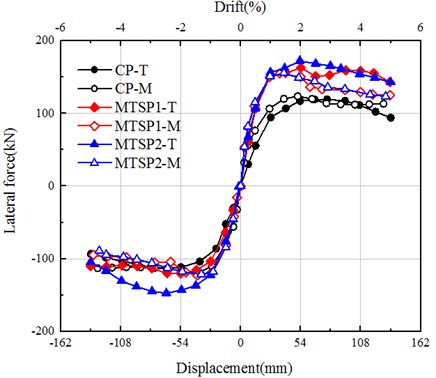
The hysteretic curves of horizontal reaction-displacement of pier top are shown in Fig. 10.
In Fig. 10, the represents the test results and the represents the finite element simulation results. It can be see from the hysteretic curve that the key points and energy dissipation capacity of ABAQUS simulation are similar to the tests, so the simulation model can be used as the basis for the follow-up pseudo-static simulation of mortise-tenon segmental piers.
With the increase of pier top displacement, the horizontal bearing capacity and energy dissipation of the specimens increased gradually. The results showed that the maximum horizontal bearing capacity of the pier top was decreased due to concrete cracking and joints opening. The hysteretic curves of the three have obvious strength degradation.
The pinching effects of MTSP1 and MTSP2 were mainly due to two reasons. The joints and cracks could be restored to the closed state with less force when the specimens were loaded reversely. And the sliding phenomenon appeared between the energy dissipation reinforcements and concrete, between the corrugated pipes and concrete. Thus, the force required when the displacement was restored to zero was smaller.
When the two specimens were loaded in the east-west direction, the vertical loading was eccentric due to the error of assembling components. The error caused the inconsistent horizontal bearing capacity of MTSP1 and MTSP2 in the hysteresis curves. In the numerical simulation of the finite element model, the eccentric force was considered. The axial pressure was loaded to the east side eccentric. The numerical simulation results were similar to the experimental results. There were no other differences in parameter setting except for different pre-stretching stress in MTSP1 and MTSP2. Thus, the hysteresis curves of MTSP1 and MTSP2 were similar.
The energy dissipation capacity of segmental piers was weak. To enhance the energy dissipation capacity, the energy dissipation reinforcements were connected by a grouting sleeve between segments. The horizontal bearing capacity and self-centering capacity of mortise-tenon segmental piers were increased due to the arrangement of prestressed steel bars and mortise-tenon shear connectors between segments. In the case of the same displacement, the residual displacement was low.
Fig. 10Lateral force-drift curve
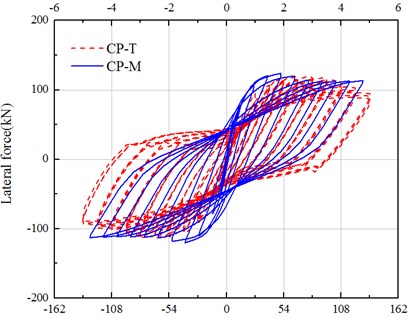
a) CP
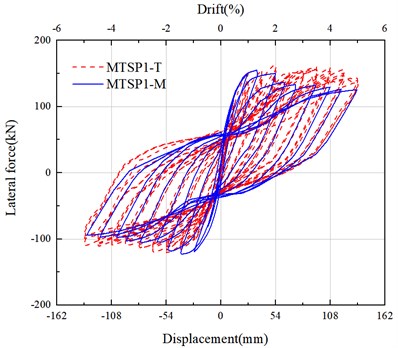
b) MTSP1
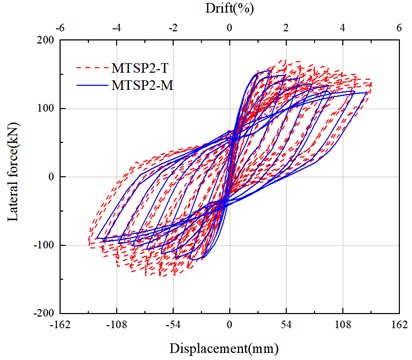
c) MTSP2
3.4. Envelope curve of load-displacement hysteretic loops
The skeleton curve was obtained by connecting the vertices of each hysteresis loop on the hysteretic curve. The peak bearing capacity and ultimate bearing capacity of the component could be obtained by the skeleton curve. The yield load, yield displacement, equivalent stiffness and ductility coefficient of the component could be obtained by calculation. So as to paved the way for the further research of mortise-tenon segmental piers. The displacement ductility coefficient was usually used as a quantitative index to evaluate the ductility of structures:
where is the ultimate displacement and is the yield displacement.
The yield displacement was obtained by R. Park method [27], and the correlation coefficient was defined as 0.85. The calculation method was as follows: the peak bearing capacity is multiplied by the park method correlation coefficient to obtain , and then the point A with the vertical coordinate is found in the rising section of the curve. The horizontal line extending OA to the point C passing through point B. The vertical line passing through point B intersects with the curve at point D. And point D is the yield point.
As shown in Fig. 12 and Table 3, it can be seen that the shapes of the skeleton curves of the three were similar. The horizontal bearing capacity of MTSP was greater than that of the CP. The horizontal bearing capacity of MTSP2 was slightly larger than that of MTSP1, which was mainly due to the higher pretension stress that enhanced the horizontal bearing capacity of MTSP.
Fig. 11The method of determining the yield point
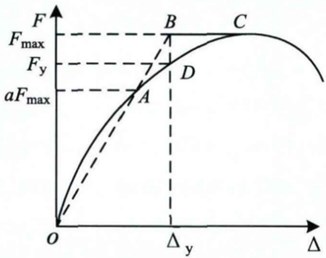
Table 3The key points of envelope curve
Specimen | Yield load (kN) | Equivalent yield displacement (mm) | Peak load (kN) | Ductility coefficient | Initial stiffness (kN/mm) |
CP | 107.22 | 40.72 | 119.55 | 3.32 | 4.45 |
MTSP1 | 152.44 | 26.85 | 163.07 | 5.03 | 9.01 |
MTSP2 | 157.41 | 28.25 | 172.45 | 4.78 | 9.99 |
Fig. 12Envelope curve of load-displacement hysteretic loops
3.5. Effective stiffness
The effective stiffness is the slope of the line between any point on the skeleton curve and the origin point, that is, the ratio of the horizontal and horizontal coordinates of the point, which is expressed as:
where is the positive and negative peak load of the corresponding load level when the -th load level is loaded; and is the positive and negative peak displacement of the corresponding load level when the -th load level is loaded.
The comparison of the effective stiffness of the three specimens is shown in Fig. 13. It can be seen that the effective stiffness of MTSP was significantly greater than that of the CP. The initial stiffness of MTSP2 and MTSP1 was 9.99 kN/mm and 9.01 kN/mm respectively, which were far greater than that of CP by 4.45 kN/mm. The increased pretension stress enhanced the initial stiffness and effective stiffness of MTSP.
Fig. 13Effective stiffness
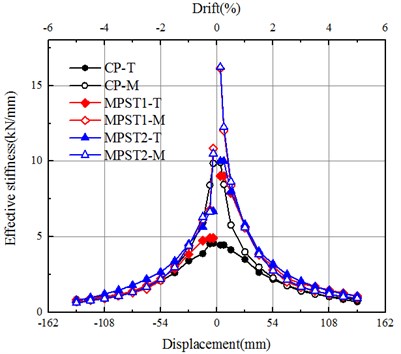
Fig. 14Accumulated energy dissipation
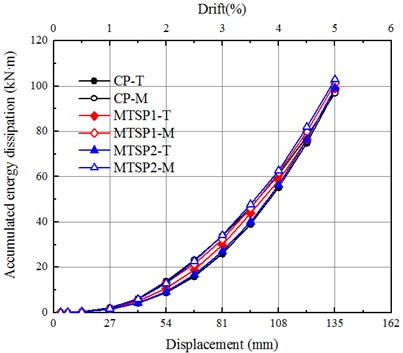
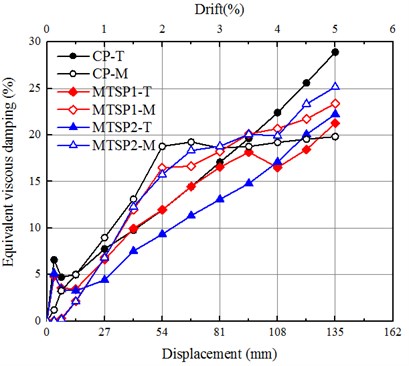
Fig. 15Equivalent viscous damping
3.6. Energy dissipation capacity
In the elastic-plastic deformation of the structure, the energy dissipation capacity is an important part to evaluate the seismic performance of the structure. The accumulated area of hysteresis loops in the hysteretic curves is the accumulated energy dissipation. The accumulated energy dissipation is stronger and the seismic performance of the structure is better when the surrounding area is larger.
The accumulated energy dissipation of the three specimens is shown in Fig. 14. The accumulated energy dissipation curves of CP and MTSP specimens were similar. The energy dissipation capacity of the segment-assembled pier was generally smaller than that of the CP. However, the test showed that the energy dissipation capacity of MTSP was slightly higher than that of the CP because of the energy dissipation reinforcements. The accumulated energy dissipation capacity of MTSP1 specimen with 80 % ultimate strength tensile prestressed reinforcements was less than 70 % of MTSP1 specimen with 80 % ultimate strength tensile prestressed reinforcements. The main reason was that the prestressed reinforcements enhanced the self-centering capacity and integrity, reduced the energy dissipation capacity of the MTSP2 specimen. The energy dissipation of the structure is weaker when the pretension stress is greater than before.
The equivalent viscous damping ratio can reflect the energy dissipation performance of joints:
where is the area enclosed by the hysteretic curve, is the equivalent stiffness, and are the positive and negative maximum displacement of the hysteresis loop in the hysteresis curve.
The equivalent viscous damping ratios of the three specimens are shown in Fig. 15. With the increase of drift ratios, the equivalent viscous damping ratios were increasing. It indicated that with the cracking and crushing of concrete, the energy dissipation of energy dissipation reinforcements was increasing. The equivalent viscous damping ratios of MTSP specimens were less than that of the CP when the pseudo-static displacements were the same. The equivalent viscous damping ratio of MTSP1 was larger than that of MTSP2, which indicated that the increase of prestressing stress was not conducive to energy dissipation.
3.7. Residual displacement
The residual displacement is the displacement value when the specimen is loaded from zero to the maximum displacement and then unloaded to zero of the cycle in this direction. The deformation after the residual displacement is irreversible plastic deformation. The pier is mainly manifested in the pier top, between segments, between the segment and the pier bottom. The lower residual displacement is, the stronger the self-centering capacity is. Low residual displacement is beneficial to post-earthquake repair of structures.
Fig. 16Residual displacements of specimens
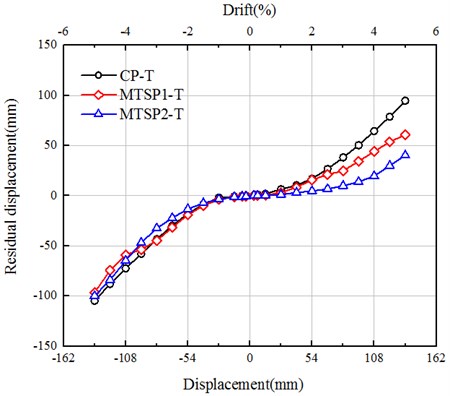
As shown in Fig. 16. When the drift ratio was less than 1 %, the residual displacements of the three specimens were similar. With the increase of displacements, the residual displacement of the CP increased obviously, and the curves of MTSP specimens gradually flattened. The construction error of the energy dissipation reinforcements in the preset grouting sleeves and the error of assembling segments leads to the eccentric stress of the specimens. Therefore, the variation law of the residual displacements in the pseudo-static tests was asymmetric. As shown in Fig. 16. When the drift ratio was greater than 1 %, the residual displacements of the two specimens were far less than that of the CP specimen. There are several main reasons. The existence of prestressed tendons made the self-centering capacity of the mortise-tenon segmental assembled piers stronger. The existence of mortise-tenon shear connectors made the shear resistance between segments stronger and the relative slip between segments smaller. The pretension stress of MTSP2 was greater than that of MTSP1, so the residual displacement was lower. The increased pretension stress enhanced its self-centering capacity.
3.8. Curvature
In the test, the displacement of both sides of piers in the loading direction could be measured by the displacement meter, and then the curvature change in the measured height could be obtained by calculation. The curvature was calculated as follows:
where, is the curvature, is the distance between displacement meters, is the height of curvature calculation position. As shown in Fig. 17.
The curvature distributions of the specimens are shown in Fig. 18. When the displacement of the CP specimen was low, the curvature was approximately linear distribution. And when the displacement was large, the curvature distribution was mainly concentrated at the pier bottom. The curvature distributions of MTSP specimens were mainly in the joints between segments and between segments and cushion cap. The curvatures of pier shafts were small. The curvature distributions of MTSP1 and MTSP2 specimens were similar.
3.9. Joint-opening
As shown in Fig. 19. With the increase of displacement, the opening amount between segment 4 and cushion cap increased gradually. When the drift ratio reached 5 %, the opening amount between segment 4 and cushion cap reached more than 10 mm. The joint openings of the two specimens were similar. The main reason was that the two specimens were the same except for the initial pretension stress of prestressed reinforcements. The existence of energy dissipation reinforcements, prestressed reinforcements and shear connectors reduced the opening degree between the joints of segments.
Fig. 17Diagram of curvature calculation
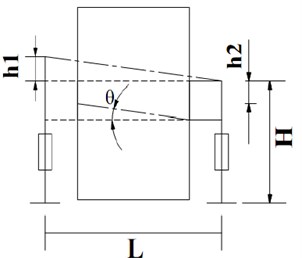
Fig. 18Distribution of curvature
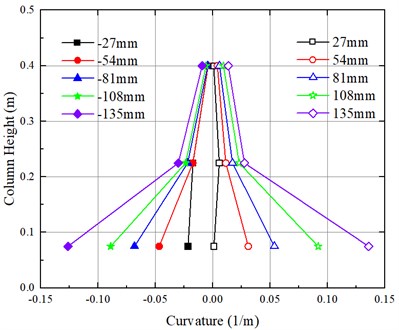
a) CP
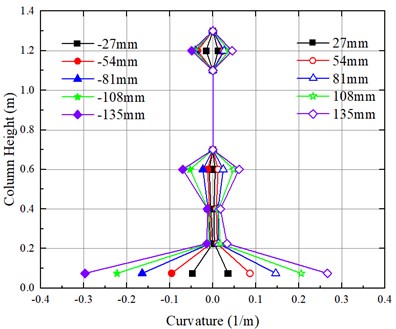
b) MTSP1
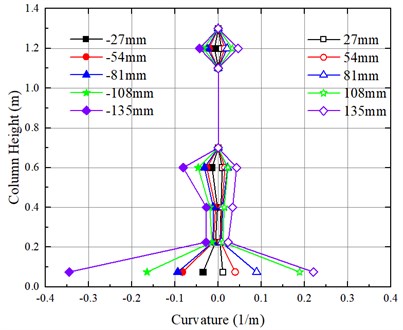
c) MTSP2
Fig. 19Joint-opening maximum of MTSP
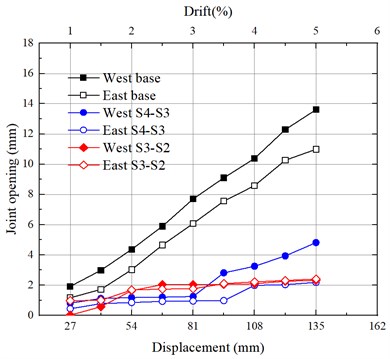
a) MTSP1
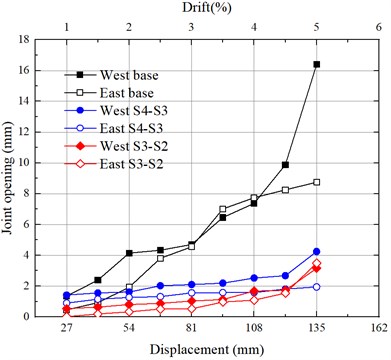
b) MTSP2
4. Conclusions
In this paper, the self-centering mortise-tenon segmental bridge piers were designed. Three specimens were tested under pseudo-static cyclic loading, and the finite element software ABAQUS was used to established the model to compare and analyze the test results.
The damage level, hysteretic characteristics and energy dissipation capacity were studied through the parameter analysis of specimens, some conclusions were drawn:
1) According to the pseudo-static cyclic loading test results, the plastic hinge zone of MTSP specimens had less damage and no annular cracks. The cracking degrees of MTSP specimens were obviously less than that of CP specimen. The MTSP specimens were reinforced with energy dissipation bars to enhanced the energy dissipation capacity. The residual displacements were reduced because of the mortise-tenon shear connectors and the vertical prestressed steel strands. The residual displacement, the cumulative energy dissipation and the equivalent viscous damping ratio of MTSP2 were smaller than those of MTSP1. The equivalent stiffness and horizontal bearing capacity of MTSP2 were larger than that of MTSP1. The test results shown that the self-centering capacity of MTSP was better than CP. And the energy dissipation capacity was similar to CP, which had the great seismic performance. The self-centering capacity, the stiffness and horizontal bearing capacity of the structure would be improved effectively provided the pretension stress was increased properly. While the energy dissipation capacity would be reduced slightly. Further research was needed to find the optimal solution between the two aspects.
2) In addition, the calculated results obtained by ABAQUS modeling were similar to the experimental results. A high coincidence was obtained resulted from the test. The structure type of MTSP improved the seismic performance of segmental assembled piers. But the reinforcement ratio of energy consuming reinforcements, the reinforcement ratio of prestressed tendons, the height of tenons and the number of tenons were the factors affecting its seismic performance.
References
-
C. S. Shim, C.-H. Chung, and H. H. Kim, “Experimental evaluation of seismic performance of precast segmental bridge piers with a circular solid section,” Engineering Structures, Vol. 30, No. 12, pp. 3782–3792, Dec. 2008, https://doi.org/10.1016/j.engstruct.2008.07.005
-
Y. Zhai and Y. Zhang, “Damage index analysis of prefabricated segmental bridge columns under cyclic loading,” Latin American Journal of Solids and Structures, Vol. 15, No. 11, Dec. 2018, https://doi.org/10.1590/1679-78254986
-
C. Li, H. Hao, and K. Bi, “Seismic performance of precast concrete-filled circular tube segmental column under biaxial lateral cyclic loadings,” Bulletin of Earthquake Engineering, Vol. 17, No. 1, pp. 271–296, Jan. 2019, https://doi.org/10.1007/s10518-018-0443-4
-
E. Nikbakht and K. Rashid, “Investigation on seismic performance and functionality of self-centring post-tensioned segmental columns,” Structure and Infrastructure Engineering, Vol. 14, No. 6, pp. 730–742, Jun. 2018, https://doi.org/10.1080/15732479.2017.1359632
-
S. Motaref, M. S. Saiidi, and D. Sanders, “Shake table studies of energy-dissipating segmental bridge columns,” Journal of Bridge Engineering, Vol. 19, No. 2, pp. 186–199, Feb. 2014, https://doi.org/10.1061/(asce)be.1943-5592.0000518
-
S. L. Billington, R. W. Barnes, and J. E. Breen, “A precast segmental substructure system for standard bridges,” PCI Journal, Vol. 44, No. 4, pp. 56–73, Jul. 1999, https://doi.org/10.15554/pcij.07011999.56.73
-
P. W. Denney and F. Linda, “Precast concrete segmental bridges: America’s beautiful and affordable icons,” PCI Journal, Vol. 49, No. 5, pp. 26–39, 2004.
-
T. Tong, W. Zhuo, X. Jiang, H. Lei, and Z. Liu, “Research on seismic resilience of prestressed precast segmental bridge piers reinforced with high-strength bars through experimental testing and numerical modelling,” Engineering Structures, Vol. 197, p. 109335, Oct. 2019, https://doi.org/10.1016/j.engstruct.2019.109335
-
T. Guo, Z. Cao, Z. Xu, and S. Lu, “Cyclic load tests on self-centering concrete pier with external dissipators and enhanced durability,” Journal of Structural Engineering, Vol. 142, No. 1, p. 04015088, Jan. 2016, https://doi.org/10.1061/(asce)st.1943-541x.0001357
-
J. T. Hewes, “Seismic design and performance of precast concrete segmental bridge columns,” University of California, San Diego, 2002.
-
S. L. Billington and J. K. Yoon, “Cyclic response of unbonded posttensioned precast columns with ductile fiber-reinforced concrete,” Journal of Bridge Engineering, Vol. 9, No. 4, pp. 353–363, Jul. 2004, https://doi.org/10.1061/(asce)1084-0702(2004)9:4(353)
-
Z.-Y. Bu, Y.-C. Ou, J.-W. Song, N.-S. Zhang, and G. C. Lee, “Cyclic loading test of unbonded and bonded posttensioned precast segmental bridge columns with circular section,” Journal of Bridge Engineering, Vol. 21, No. 2, p. 04015043, Feb. 2016, https://doi.org/10.1061/(asce)be.1943-5592.0000807
-
Xia Zhanghua et al., “Biaxial quasi-static test of grouted corrugated pipe prefabricated PC double column pier,” (in Chinese), Chinese Journal of highway and transport, Vol. 34, No. 1, pp. 93–103, 2021, https://doi.org/10.19721/j.cnki.1001-7372.2021.01.009
-
C.-C. Chou and Y.-C. Chen, “Cyclic tests of post-tensioned precast CFT segmental bridge columns with unbonded strands,” Earthquake Engineering and Structural Dynamics, Vol. 35, No. 2, pp. 159–175, Feb. 2006, https://doi.org/10.1002/eqe.512
-
Y.-C. Ou, J.-C. Wang, K.-C. Chang, and G. C. Lee, “Experimental evaluation of pre-cast pre-stressed segmental concrete bridge columns,” in Structures Congress 2006, pp. 1–10, Oct. 2006, https://doi.org/10.1061/40889(201)80
-
Y.-C. Ou, P.-H. Wang, M.-S. Tsai, K.-C. Chang, and G. C. Lee, “Large-scale experimental study of precast segmental unbonded posttensioned concrete bridge columns for seismic regions,” Journal of Structural Engineering, Vol. 136, No. 3, pp. 255–264, Mar. 2010, https://doi.org/10.1061/(asce)st.1943-541x.0000110
-
Y. Zhang, G. Wu, and D. Dias-Da-Costa, “Cyclic loading tests and analyses of posttensioned concrete bridge columns combining cast-in-place and precast segments,” Bulletin of Earthquake Engineering, Vol. 17, No. 11, pp. 6141–6163, Nov. 2019, https://doi.org/10.1007/s10518-019-00714-0
-
Mo Jinsheng et al., “Quasi static test of UHPC connected segmental assembled pier,” (in Chinese), Structural Engineer, Vol. 34, pp. 88–95, 2018, https://doi.org/10.15935/j.cnki.jggcs.2018.s1.014
-
Z. Wang, J. Wang, J. Zhu, G. Zhao, and J. Zhang, “Energy dissipation and self‐centering capacities of posttensioning precast segmental ultra‐high performance concrete bridge columns,” Structural Concrete, Vol. 21, No. 2, pp. 517–532, Apr. 2020, https://doi.org/10.1002/suco.201900024
-
Z.-K. Cai, W. Yuan, Z. Wang, and S. T. Smith, “Seismic behavior of precast segmental bridge columns reinforced with hybrid FRP-steel bars,” Engineering Structures, Vol. 228, p. 111484, Feb. 2021, https://doi.org/10.1016/j.engstruct.2020.111484
-
Weiding Zhuo, “Hysteretic energy dissipation and seismic resiliency of precast piers with high-strength bars,” (in Chinese), Southeast University, 2019, https://doi.org/10.27014/d.cnki.gdnau.2019.003814
-
H. Dawood, M. Elgawady, and J. Hewes, “Behavior of segmental precast posttensioned bridge piers under lateral loads,” Journal of Bridge Engineering, Vol. 17, No. 5, pp. 735–746, Sep. 2012, https://doi.org/10.1061/(asce)be.1943-5592.0000252
-
Cai Zhongkui, “Seismic performance and design method of hybrid reinforced precast segmental bridge columns,” (in Chinese), Harbin Institute of Technology, 2018, https://doi.org/10.7666/d.d01585661
-
Z. Bu, J. Guo, R. Zheng, J. Song, and G. C. Lee, “Cyclic performance and simplified pushover analyses of precast segmental concrete bridge columns with circular section,” Earthquake Engineering and Engineering Vibration, Vol. 15, No. 2, pp. 297–312, Jun. 2016, https://doi.org/10.1007/s11803-016-0323-3
-
G. 50010-2010-2015, Code for Design of Concrete Structures. Beijing, China: China Construction Industry Press, 2015.
-
Fang Zihu et al., “Choose of ABAQUS concrete stress-strain curve,” (in Chinese), Building Structure, Vol. 43, pp. 559–561, 2013, https://doi.org/10.19701/j.jzjg.2013.s2.128
-
R. Park, “Evaluation of ductility of structures and structural assemblages from laboratory testing,” Bulletin of the New Zealand Society for Earthquake Engineering, Vol. 22, No. 3, pp. 155–166, Sep. 1989, https://doi.org/10.5459/bnzsee.22.3.155-166
Cited by
About this article

The authors would like to acknowledge the financial support from the General project of Beijing Natural Science Foundation “Study on Performance Optimization and Seismic Design Method of Self-centering Precast Pier of Urban Bridge in High-Intensity Areas” (Grant No. 8192035).
