Abstract
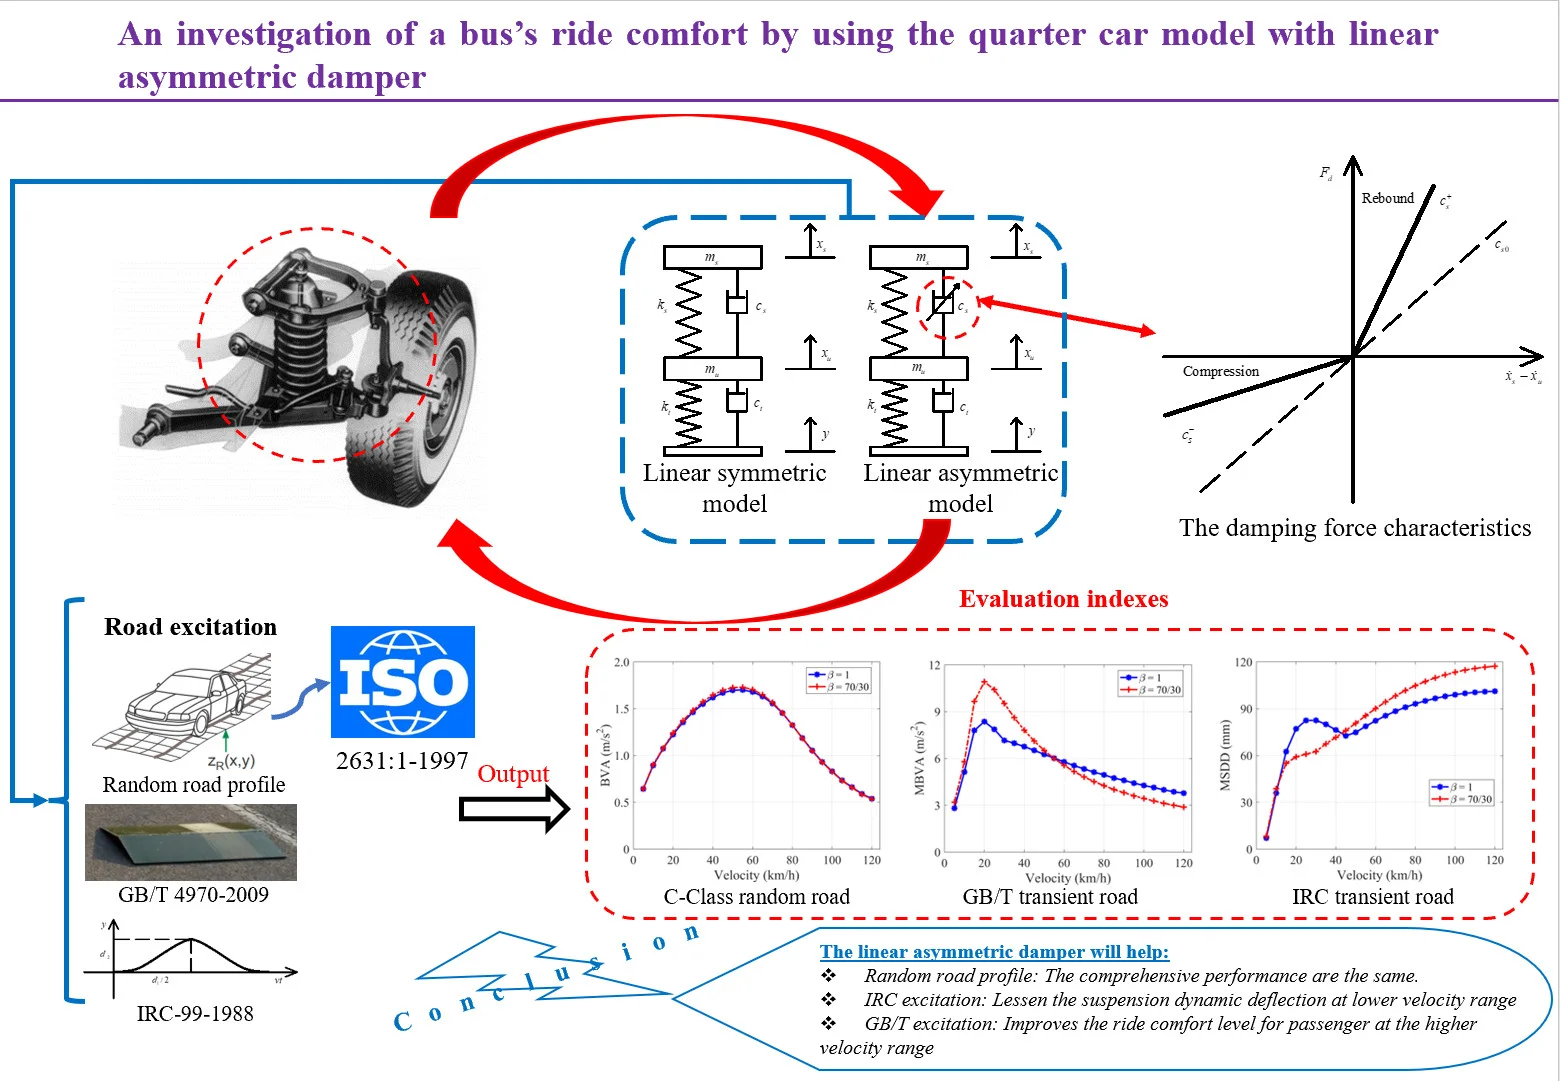
The linear asymmetric damper’s effects on the ride comfort, safety, and handling control were investigated to get full understanding of the suspension system design processes of an inner-city bus. The dynamic responses were analyzed for both two cases of linear symmetric and linear asymmetric dampers using the quarter car model with two degrees of freedom (2 DOFs) subjected to random road profiles and single bump cases of triangular and sine-squared bumps. The obtained results show that the linear symmetric damper performs the same as that of the linear asymmetric one in terms of comprehensive performance when the vehicle is subjected to a random road profile. The ride comfort, the working space have been significantly improved in specific range of velocity in case of the linear asymmetric damper. However, in general, slightly better performance has been obtained in the linear symmetric damper case.
Highlights
- The influence of the asymmetric damper on the ride comfort, safety, and handling control, when the vehicle is subjected to the random road profile, could be negligible.
- The linear asymmetric damper provides an improved ride comfort level at the higher velocity of about 60(km/h), in case of the GB/T excitation.
- The linear asymmetric damper will specially aid to reduce the working space at a regular working velocity, in case of the IRC excitation.
1. Introduction
Vibration influences all kinds of traffic participants, particularly vehicle users (both passengers and drivers) on all types of transportation (road, rail, air, and water). In general, drivers of public transport are considered to be in dangerous working condition, which could threaten their health [1]. When compared to passenger vehicle drivers, long-distance bus drivers are impacted by higher intensity vibrations during their 8-hour working shifts [2]. As consequence, vibration leads to a large number of serious effects (physiological, and psychological illnesses), which are more noticeable, when it influences someone for a long period of time. Because of these harmingful reasons, automotive manufacturers should pay a lot of attention to reducing these kinds of discomfort. With the rapid development of the economy and society, modern vehicles are required to bring a satisfactory level of comfort for passengers by minimizing the movements as well as the vertical accelerations imposed and perceived by passengers.
One of the most crucial systems in a vehicle is the suspension system, which is responsible for achieving comfort, stability, and safety characteristics. The primary goal of this component is to improve the comfort level for vehicle’s occupants, maintain tire-to-road surface contact, and minimize dynamic forces acting on the vehicle structure along the road. And a damper can be clearly considered as one of the most complex parts of the suspension because of its nonlinear behavior, typically having hysteretic nature [3-4], that it influences braking, steering, cornering control, and overall stability. Because of the cost restrictions, the most prevalent form of suspension used in buses is still passive suspension, in which stiffness and damping coefficients can’t be varied by external force. Selecting the spring and damper specifications must minimize vibration felt by the driver and passengers while ensuring permanent contact between the wheels and the road. In fact, manufacturers have always implemented this suspension’s optimization process by two key approaches: by measurement and simulation as well.
When collecting vibrational data are challenging to undertake due to different mechanical restrictions, simulations will be the better method for lowering costs in design progress. Many researchers have simulated and sought to determine appropriate damper values based on vehicle model to achieve better compromises among criteria such as ride comfort, suspension deflection, and road-holding stability. For example, a two DOFs vibration model, which is created in accordance with the vehicle dynamics theory for determining how the suspension parameter affects the comfort of the ride [5]. A linear oscillatory bus model is employed to examine how spring stiffness and shock absorber damping affected the driver’s body’s vertical acceleration, suspension deformation, and dynamic wheel load [6]. More complex vehicle models are built for the same purposes with a four DOFs model using genetic algorithms to identify a set of parameters that would significantly improve the driver’s performance based on a combination of head acceleration, crest factor, tire deflection, and suspension deflection [7]. A half-car model and the application of genetic algorithms are used for the optimization of passive suspension characteristics by taking into account the competing demands: minimizing the vehicle’s exposure to vibration and preserving continuous wheel-to-road contact [8].
One striking point is that asymmetric dampers, which are characterized by higher values of damping coefficient in rebound than compression, are commonly equipped in almost all vehicle’s passive suspensions. In fact, the ratio of compression to rebound damping, also known as the asymmetric damping ratio, is typically about 30/70 for passenger vehicles but may range from 20/80 to 50/50 [9]. Although the above researchers have provided pieces of advantageous advice for enhancing passive suspension damper design, the findings were mostly made based on a linear damper model with a constant equivalent damping coefficient that the asymmetric ratio tends to be only around 50/50, whereas the different asymmetric characteristics were abandoned in most of these investigations.
This paper aims to highlight the different responses between linear symmetric and linear asymmetric dampers of a typical bus subjected to a random road excitation in range of the common working velocity, and the single bump road profile cases also with triangular and sine-squared bumps. The 2 DOFs quarter car models with both the linear asymmetric damper and linear symmetric one are employed to investigate. The different effects of linear symmetric and asymmetric damping characteristics on the ride comfort, safety, and handling control of a typical and common kind of bus in Viet Nam are fully obtained.
Various researchers have different opinions on vehicle comfort evaluation, and there are a large number of arguments, but all essentially adhere to International Standard ISO 2631-1:1997 (Mechanical Vibration and Shock-Evaluation of Human Exposure to Whole-Body Vibration). This standard uses root mean square of weighted acceleration (RMS) as a vibration comfort indicator [10], and the obtained results are mostly evaluated based on these criteria.
The paper is organized as follows: Section 2 introduces both the models of linear symmetric and linear asymmetric dampers employed for the simulations. In the next subsection, the method for generating a random road profile in time domain, which is useful for computing and analyzing, is presented. Then, a series of evaluation indexes are proposed to evaluate the performance of the model examined. Next, the ISO 2631-1:1997, and the calculation flowchart are also demonstrated. In the Section 3, these pieces of information are used for comparing the dynamic responses between the linear symmetric and linear asymmetric dampers based on the obtained results. Additionally, the obtained results with transient road input are investigated for deeper understanding. Finally, the work’s highlights are summarized in the last section.
2. Theory and simulation model
2.1. Quarter car model
The quarter car model is commonly employed in automotive engineering, as shown in Fig. 1, because of its simplicity and the qualitatively correct information it conveys, at least in the initial design stages [11]. On the other hand, to check the preliminary design results, more accurate models [12] and methods [13] need to be employed.
In all circumstances, the vertical displacement of the wheel subsystem and the vehicle’s body is represented by the coordinates and respectively.
Fig. 1Quarter car models [14], where ms, mu: sprung mass, un-sprung mass, (kg), ks, kt: spring stiffness, tire stiffness, (N/m), cs, ct: suspension damping coefficient, tire damping coefficient, (Ns/m), x, x˙, x¨: displacement, velocity and acceleration, (m), (m/s) and (m/s2) respectively, y, y˙: excitation displacement, velocity, (m), and (m/s) respectively
![Quarter car models [14], where ms, mu: sprung mass, un-sprung mass, (kg), ks, kt: spring stiffness, tire stiffness, (N/m), cs, ct: suspension damping coefficient, tire damping coefficient, (Ns/m), x, x˙, x¨: displacement, velocity and acceleration, (m), (m/s) and (m/s2) respectively, y, y˙: excitation displacement, velocity, (m), and (m/s) respectively](https://static-01.extrica.com/articles/22811/22811-img1.jpg)
a) Linear symmetric model
![Quarter car models [14], where ms, mu: sprung mass, un-sprung mass, (kg), ks, kt: spring stiffness, tire stiffness, (N/m), cs, ct: suspension damping coefficient, tire damping coefficient, (Ns/m), x, x˙, x¨: displacement, velocity and acceleration, (m), (m/s) and (m/s2) respectively, y, y˙: excitation displacement, velocity, (m), and (m/s) respectively](https://static-01.extrica.com/articles/22811/22811-img2.jpg)
b) Linear asymmetric model
For the linear symmetric model of Fig. 1(a), the equations of motion can be easily put in the classical matrix form as:
where represents the response vector, whereas the quantities:
represent the mass, damping, and stiffness matrices of the examined system, respectively. In addition, the forcing terms developing from road roughness are included in the vector Particularly, the bus is supposed to drive at a constant horizontal velocity over a road whose profile is . A random process with a statistical distribution is used for depicting this characteristic of the road. As a result, the forcing vector has the form as:
where .
The key difference between the models, which are shown in Fig. 1(a) and Fig. 1(b), is the linear asymmetric damping characteristics, where the value of the suspension damping coefficient switches between two distinct values. More specifically, for this model, the damping force generated between the vehicle’s body and the wheel has the form as mentioned in the next subsection.
2.2. Damper phenomenological model
The suspension damper characterized by linear asymmetric damping properties in compression and rebound is considered in the quarter car model. The force-velocity relations of both the linear symmetric and asymmetric dampers are shown in Fig. 2 [15].
Fig. 2The damping force characteristics
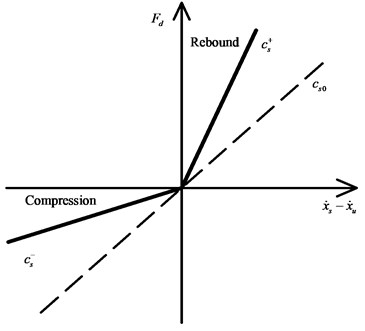
The damping force generated by the linear asymmetric damper can be formulated as [15]:
The different values of the asymmetric ratio represent different damping characteristics, as in Eq. (6).
2.3. Random road profiles
According to ISO 8608, the Power Spectral Density (PSD) values are used for classifying road roughness [16]. The road profile can be generated by a PSD function that the PSD of roads indicate a characteristic drop in magnitude with the wave number. Random road profiles can be approximated by a PSD in the form of:
where (rad/m) describes the angular spatial frequency, is the wavelength. in (m2/(rad/m)) denotes the values of the PSD at the reference wave number = 1(rad/m). is the waviness, for most of the road surface, 2.
The vehicle is assumed to travel with a constant speed over a given road segment with a length , a superposition of sine waves can be used for approximating a random profile of a single track [17]:
The amplitude are defined as follows:
in which, (rad/s), then the series of are determined thanks correspondingly to equal step intervals of In addition, the phase angles are defined as random variables following a uniform distribution in the interval
In this paper, we take the grade C road with 810-6(m2/(rad/m) as an average-quality excitation [10] throughout the velocity interval considered from 5 to 120 (km/h). The nominal parameters of the road are taken to be 100 (m), 256 (waves). The frequency is chosen from 0.5 to 50 (Hz) that the road roughness has the most considerable influence on the oscillatory behavior, then the series of angular spatial frequencies are calculated within this range [18].
2.4. ISO 2631-1:1997
When evaluating the vibration of a vehicle, the variation of vehicle’s acceleration is significant. In addition, the frequency of vibration, and the natural frequency of the human body are needed to be considered carefully. According to VDI 2057 standard, the vertical direction is the main vibrational direction appearing on most road vehicles [19].
As reported by ISO 2631-1:1997, the primary method, which is used for evaluating the human response to vibration levels, is based on the root mean square of acceleration [10], which is calculated by the following formula:
where denotes vertical acceleration in time domain, (m/s2), is the duration time, (s).
The root mean square of acceleration value that does not cause discomfort level for passengers must be less than 0.315 (m/s2) [10]. This is the main basis for evaluating, and selecting appropriate structural parameters of the suspension system.
2.5. Evaluation indexes
For traditional vehicles, the absolute acceleration of vehicle’s body (), the distance between the wheel subsystem and the vehicle’s body, and the force developed between the ground surface and the wheel are generally chosen as the indexes for evaluating ride comfort, safety, and handling control [9]. This paper employs some evaluation indexes for analyzing the dynamic responses of model examined [20]:
a) The root mean square of the vehicle’s body vibration acceleration (BVA) can be expressed as:
b) The root mean square of the tire relative dynamic load (TDL) is given by:
c) The root mean square of the suspension dynamic deflection (SDD) is defined by:
2.6. Calculation flowchart
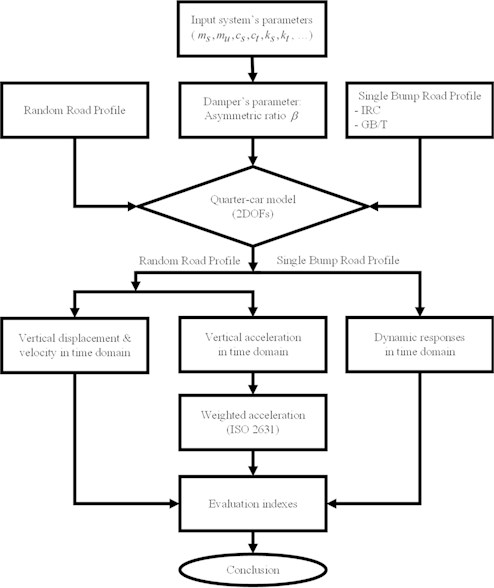
According to the calculation flowchart, as shown in Fig. 3, the random road profile, the single bump road profile, and system parameters are first generated. Then, the output after solving the differential equations of the motion, which are needed to be focused, will be vertical displacement, velocity, and acceleration of the sprung mass in the time domain. In case of random road profile, the weighted acceleration is obtained based on ISO 2631-1:1997. Next, the root mean square (RMS) values of weighted acceleration are conveniently calculated, and the evaluation indexes are obtained. For the case of single bump road profile, dynamic responses in the time domain are also obtained to calculate the evaluation indexes. Then, the maximum values of evaluation indexes are calculated. Finally, the conclusions are drawn, which are based on the calculated results between the linear symmetric damper and the linear asymmetric one.
Fig. 3A simulation flowchart for an investigation of the asymmetric damper’s effects on the bus’s vibrational behavior
3. Calculated results and discussion
In this section, the evaluation indexes of a system examined with different damper characteristics are calculated, and analyzed under the random and transient excitation.
Table 1 provides the meaning of the values of a common bus’s parameters. The technical parameters of a typical bus in Vietnam, the above parameters are appropriate for representing the typical bus’s parameters.
A good-quality (A-Class) and an average kind (C-Class) road with a length of 100 (m), which are created by the process presented in the subsection 2.3, are used for the computation of the ride comfort. The vehicle’s body vibration acceleration (BVA) in the operating velocity range is shown in Fig. 4. The root-mean-square values of weighted acceleration exceeded the comfort level (BVA > 0.315 (m/s2)) in almost the entire vehicle’s running velocity domain.
Table 1The bus’s technical parameters
Bus parameter | Symbol | Value |
Sprung mass | 2000 (kg) | |
Un-sprung mass | 250 (kg) | |
Natural frequency | 1.0 (Hz) | |
Damping ratio | 0.4 | |
Spring stiffness | 85799 (N/m) | |
Tire stiffness | 1000000 (N/m) | |
Equivalent linear damping coefficient | 10053 (Ns/m) | |
Tire damping coefficient | 150 (Ns/m) | |
Linear symmetric ratio | 1 | |
Linear asymmetric ratio | 70/30 |
Fig. 4BVA in case of linear symmetric damper under two different kinds of roads
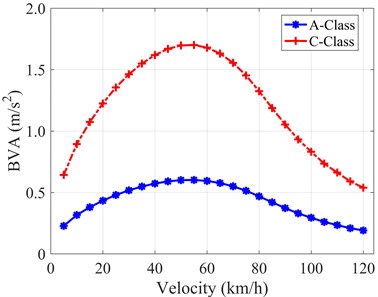
Fig. 5 shows the values of BVA at different kinds of random roads corresponding with velocity of 10 and 60 (km/h). The passengers sitting on the bus will frequently feel uncomfortable during the trip if the bus runs on a bad-quality road for a long period of time, even with the A-Class road profile.
Fig. 5BVA versus class of road profiles at velocities of 10 and 60 (km/h)
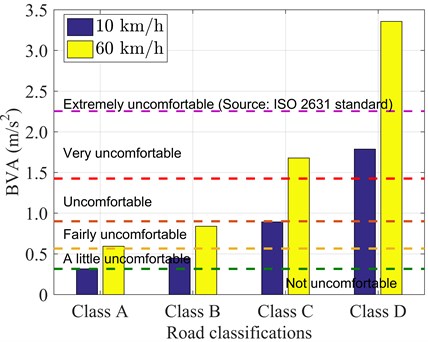
BVA reaches its maximum value at around between 50 and 60 (km/h), and people will feel exceedingly uncomfortable if the bus is running at this range. The two lines of the system’s responses in the velocity domain, when the bus is subjected to A-Class and C-Class roads, have the same trend, and the only distinct point is that the amplitude is dramatically increased, as shown in Fig. 4. Therefore, this paper particularly considers the response of the system under one kind of random road profile that the C-Class is selected for the next computations. The bus’s operating velocity is set to be in range of 5 to 120 (km/h), which is the normal working velocity range. Because the BVA values in this velocity domain are relatively high, the effect of the linear asymmetric damper should be thoroughly investigated.
The value of the asymmetric ratio = 70/30 represents most of the linear asymmetric dampers in reality [9], while = 1 indicates the linear symmetric one. The evaluation indexes are calculated for both kinds of dampers to investigate.
4. Analysis of evaluation indexes
To further intuitively observe the differences among the evaluation indexes, Figs. 6-7-8 depict the evaluation indexes in the velocity domain with two kinds of asymmetric ratios
With the C-Class random road excitation, at the initial increasing of velocity, the higher velocity the higher BVA is obtained. It reaches peak values at about 55 (km/h), and then decreases gradually for both cases, as shown in Fig. 6. The linear symmetric damper yields a slightly better comfort level than that of the linear asymmetric one (only 1.5 %) at a regular working velocity range (40 << 60 (km/h)). In general, the linear asymmetric damper generates the same comfort performance as the linear symmetric one at the entire velocity range.
Fig. 6BVA versus velocity with two types of dampers
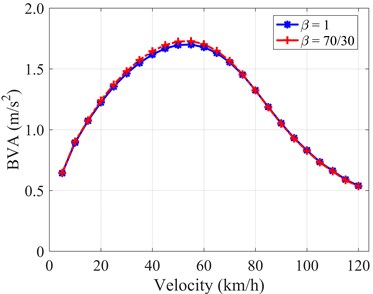
Fig. 7TDL versus velocity with two types of dampers
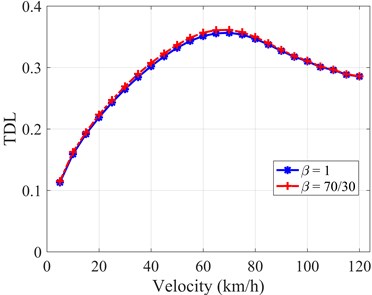
The tire dynamic load (TDL) generally has the same manner when compared to the previous BVA that the value of TDL grows up sharply and hits the highest point at about 65 (km/h), then goes down slightly in both cases. For the entire of velocity range, the use of = 1 is slightly more favorable for reducing TDL, which improves the performance of the tire grounding safety, as shown in Fig. 7. Generally, the effect of the linear asymmetric damper on the handling control is negligible.
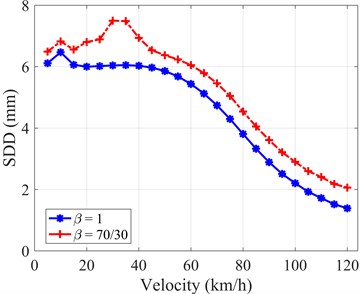
The overall change’s trend of SDD illustrates that the values go down through most of the velocity, as shown in Fig. 8. At the whole velocity interval, the linear symmetric damper yields slightly better working space than the linear asymmetric one. However, the values of SDD, when the bus is subjected to the C-Class random road profile, are extremely insignificant, SDD is less than 10 (mm) where the normal limitation of working space is up to 127 (mm). In other words, the effect of the linear asymmetric damper on the working space will obscured and overlooked.
In summary, the linear symmetric damper yields slightly better performance than that of the linear asymmetric one through most of the velocity range, as shown in Figs. 6-7-8. Nevertheless, the differences in evaluation indexes between the two types of dampers are minor. As a result, the influence of the asymmetric damper on the ride comfort, safety, and handling control, when the vehicle is subjected to the random road profile, could be negligible.
Fig. 8SDD versus velocity with two types of dampers
5. Extended results with the transient road profile
Based on the obtained results in case of random road profile, the linear asymmetric damper will have no substantial impact on the bus’s ride comfort, safety, and handling control. This study continues to investigate another crucial criterion by acting on the vehicle with the transient input.
A bump has a triangular profile defined as the following formula [15]:
where, the parameters are shown as in Fig. 9.
Fig. 9A physical model of triangular bump
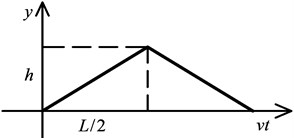
As reported in standard GB/T 4970-2009, the triangular bump has a length of 0.4 (m), and a height of 0.04 (m) [21].
Another transient road profile that has the shape of a sine-squared could be determined by the function as:
where, the parameters are shown as in Fig. 10.
Fig. 10A physical model of sine-squared bump
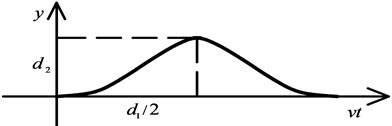
According to standard IRC-99-1988, the sine-squared road surface has a length of 3.7 (m), and a height of 0.1 (m) [22].
Some of the outputs that need to be focused on will be fundamentally familiar evaluation indexes, including the Maximum Body Vibration Acceleration (MBVA), the Maximum Suspension Dynamic Deflection (MSDD), and the Maximum Tire Dynamic Load (MTDL) [15], which are defined as:
Here are some representative results in the velocity domain, when the vehicle is subjected to both cases of the transient road profile.
Fig. 11MBVA versus velocity with two types of dampers under both kinds of transient road profiles
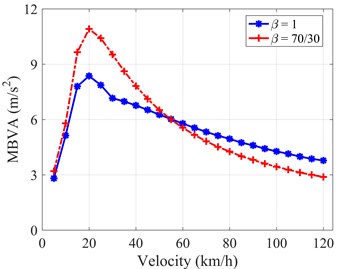
a) GB/T excitation
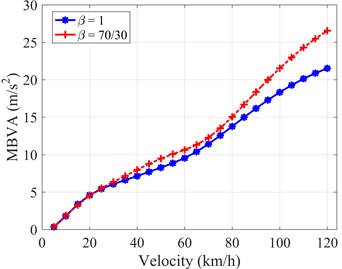
b) IRC excitation
Fig. 11(a) shows that the MBVA value rises initially before falling in both cases of dampers [15]. The linear symmetric damper yields better performance on the MBVA in the lower part of the velocity domain, whereas the linear asymmetric damper performs better for reducing MBVA on another part of the velocity interval, as shown in Fig. 11(a). The most significant difference is approximately 32 % at 25 (km/h). On the other hand, in case of the sine-squared bump, there is an increasing tendency in the entire velocity domain. The obtained results of MBVA values are similar in most of the velocity domain for both the dampers. However, at the higher velocity, the difference becomes larger and larger. The linear symmetric damper produces greater performance (reducing the vehicle’s body’s vibration acceleration), and the difference reaches 23 % at 120 (km/h), as shown in Fig. 11(b).
The values of MTDL increase first, then decrease slightly, as shown in Fig. 12(a). Surprisingly, the values of MTDL are almost comparable in both cases when the vehicle is driving at a velocity greater than 40 (km/h) [15]. In case of IRC excitation, the similar trend as Fig. 11(b) is observed. Specifically, the MTDL values increase gradually when the vehicle’s velocity goes up, as depicted in Fig. 12(b). Generally, in terms of the MTDL evaluation index, the linear symmetric damper yields slightly better performance (reducing tire relative dynamic load) throughout most of the velocity domain, and the highest variation between the two types of dampers is up to 17 % for both cases of transient roads, as shown in Figs. 12(a)-12(b).
Fig. 12MTDL versus velocity with two types of dampers under both kinds of transient road profiles
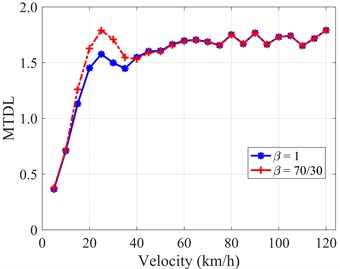
a) GB/T excitation
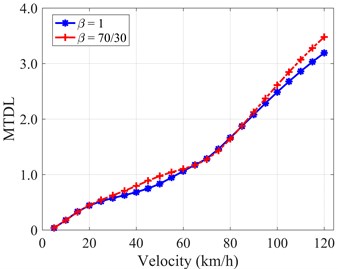
b) IRC excitation
The MSDD achieves peak values at around 15 (km/h) and then steadily declines for both cases of dampers [15], as shown in Fig. 13(a). The linear symmetric damper performs better in the entire velocity domain in case of the triangular bump GB/T excitation. The difference is around 18 % throughout the entire velocity interval. However, the obtained suspension’s working space is limited and the maximum amplitude of the MSDD is only 42 (mm). In case of the sine-squared bump IRC excitation, the investigation of the system’s response is really necessary, where the amplitude of the MSDD becomes larger and larger as the vehicle’s velocity up. In the Fig. 13(b), the lines illustrates that the use of asymmetric ratio, = 70/30, performs better in working space criteria, which may effectively prevent the suspension bump stop’s impact, at a regular working velocity range of an inner city bus, 10 << 40 (km/h), where the difference is up to 26 % at 25 (km/h). Nevertheless, the discrepancy tends to be inverse as the velocity increases and the difference keeps growing up gradually, as shown in Fig. 13(b).
Fig. 13MSDD versus velocity with two types of dampers under both kinds of transient road profiles
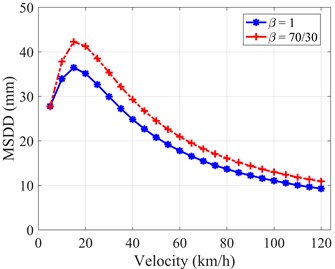
a) GB/T excitation
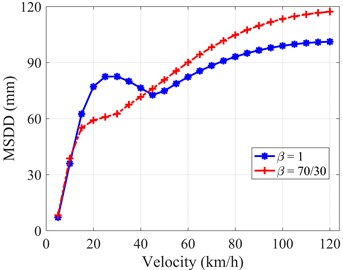
b) IRC excitation
In summary, the linear asymmetric damper provides an improved ride comfort level at the higher velocity of about 60 (km/h), in case of the GB/T excitation. Regarding to the working space criteria, the linear asymmetric damper will specially aid to reduce the working space at a regular working velocity, in case of the IRC excitation. In contrast, the linear symmetric one performs better in other circumstances.
6. Conclusions
A research methodology and an evaluation technique were described in the first part of this study. Then, the linear symmetric and the linear asymmetric damper behaviors were investigated using a quarter-car model, subjected to both the random and the transient road profiles. The evaluation indexes of the model with different damper damping characteristics are calculated. Some advantageous conclusions can be drawn as follows:
1) The linear symmetric damper yields slightly better performance on the ride comfort, working space, and handling control when the bus is subjected to the random road profile. However, the differences are significantly modest, thus the comprehensive performance seems to be the same between two kinds of linear symmetric and linear asymmetric dampers.
2) The linear asymmetric damper will assist to lessen the suspension dynamic deflection at lower velocity range in case of the IRC excitation. It also improves the ride comfort level for passenger at the higher velocity range in case of the GB/T excitation. In other instances, the linear symmetric damper performs greater performance on the ride comfort, working space, and handling control criteria.
This paper provides some valuable references for further improving suspension’s performance. The linear asymmetric damper is beneficial to significantly improve the ride comfort and working space in particular specified working velocity interval. However, in general, the linear symmetric one performs slightly better on the comprehensive operation despite of the linear asymmetric behavior of common dampers in reality.
References
-
H. G. O. Mendes et al., “The consequences of mechanical vibration exposure on the lower back of bus drivers: a systematic review,” Applied Sciences, Vol. 11, No. 21, p. 9986, Oct. 2021, https://doi.org/10.3390/app11219986
-
C. A. Lewis and P. W. Johnson, “Whole-body vibration exposure in metropolitan bus drivers,” Occupational Medicine, Vol. 62, No. 7, pp. 519–524, Oct. 2012, https://doi.org/10.1093/occmed/kqs096
-
N. Vaiana, S. Sessa, F. Marmo, and L. Rosati, “A class of uniaxial phenomenological models for simulating hysteretic phenomena in rate-independent mechanical systems and materials,” Nonlinear Dynamics, Vol. 93, No. 3, pp. 1647–1669, Aug. 2018, https://doi.org/10.1007/s11071-018-4282-2
-
N. Vaiana, S. Sessa, and L. Rosati, “A generalized class of uniaxial rate-independent models for simulating asymmetric mechanical hysteresis phenomena,” Mechanical Systems and Signal Processing, Vol. 146, p. 106984, Jan. 2021, https://doi.org/10.1016/j.ymssp.2020.106984
-
Zhang G. X. and Dong Y. E., “Study on the influence of suspension parameters on the vehicle ride comfort,” Journal of Shaanxi University of Science and Technology (Natural Science Edition), Vol. 5, pp. 147–151, 2016.
-
Dragan B. Sekulic and Vlastimir Dedović, “The effect of stiffness and damping of the suspension system elements on the optimisation of the vibrational behaviour of a bus,” International Journal for Traffic and Transport Engineering, Vol. 1, No. 4, pp. 231–244, 2011.
-
Gündoğdu, “Optimal seat and suspension design for a quarter car with driver model using genetic algorithms,” International Journal of Industrial Ergonomics, Vol. 37, No. 4, pp. 327–332, Apr. 2007, https://doi.org/10.1016/j.ergon.2006.11.005
-
V. Goga and M. Kľúčik, “Optimization of vehicle suspension parameters with use of evolutionary computation,” Procedia Engineering, Vol. 48, pp. 174–179, 2012, https://doi.org/10.1016/j.proeng.2012.09.502
-
J. C. Dixon, The Shock Absorber Handbook. John Wiley & Son, 2007.
-
“ISO 2631-1, mechanical vibration and shock – evaluation of human exposure to whole-body vibration,” The International Organization for Standardization, 1997.
-
D. Hrovat, “Applications of optimal control to advanced automotive suspension design,” Journal of Dynamic Systems, Measurement, and Control, Vol. 115, No. 2B, pp. 328–342, Jun. 1993, https://doi.org/10.1115/1.2899073
-
N. Vaiana and L. Rosati, “Classification and unified phenomenological modeling of complex uniaxial rate-independent hysteretic responses,” Mechanical Systems and Signal Processing, Vol. 182, p. 109539, Jan. 2023, https://doi.org/10.1016/j.ymssp.2022.109539
-
N. Vaiana, S. Sessa, F. Marmo, and L. Rosati, “Nonlinear dynamic analysis of hysteretic mechanical systems by combining a novel rate-independent model and an explicit time integration method,” Nonlinear Dynamics, Vol. 98, No. 4, pp. 2879–2901, Dec. 2019, https://doi.org/10.1007/s11071-019-05022-5
-
R. N. Jazar, Vehicle Dynamics: Theory and Application. Springer, 2008, p. 742.
-
L. Zhao, Y. Yu, C. Zhou, S. Mao, and F. Yang, “Simulation of vertical characteristics and in-wheel motor vibration of electric vehicles with asymmetric suspension damper under road impact,” International Journal of Modelling and Simulation, Vol. 39, No. 1, pp. 14–20, Jan. 2019, https://doi.org/10.1080/02286203.2018.1468991
-
“ISO 8608, Mechanical vibration – road surface profiles – reporting of measured data,” 2016.
-
F. Tyan, Yu Hong, Shun-Hsu Tu, and W. Jeng, “Generation of Random Road Profiles,” Journal of Advanced Engineering, Vol. 4, No. 2, pp. 151–156, 2009.
-
A. Kawamura and T. Kaku, “An evaluation of road roughness and the effects on riding comfort and vehicle dynamics,” Japan Society of Civil Engineers, Vol. 359, pp. 137–147, 1985.
-
“Human exposure to mechanical vibrations, Part 1: Whole-body vibration,” VDI 2057, European Standardisation Organisations, 2002.
-
G. Verros, S. Natsiavas, and C. Papadimitriou, “Design optimization of quarter-car models with passive and semi-active suspensions under random road excitation,” Journal of Vibration and Control, Vol. 11, No. 5, pp. 581–606, May 2005, https://doi.org/10.1177/1077546305052315
-
“Method of running test-Automotive ride comfort,” GB/T 4970-2009, National Automotive Standardization Technical Committee, China, 2009.
-
“Tentative Guidelines on the Provision of Speed Breakers for Control of Vehicular Speeds on Minor Roads,” in The Indian Roads Congress, 1996.
Cited by
About this article

We acknowledge Ho Chi Minh City University of Technology (HCMUT), VNU-HCM for supporting this study.
The datasets generated during and/or analyzed during the current study are available from the corresponding author on reasonable request.
The authors declare that they have no conflict of interest.
