Abstract
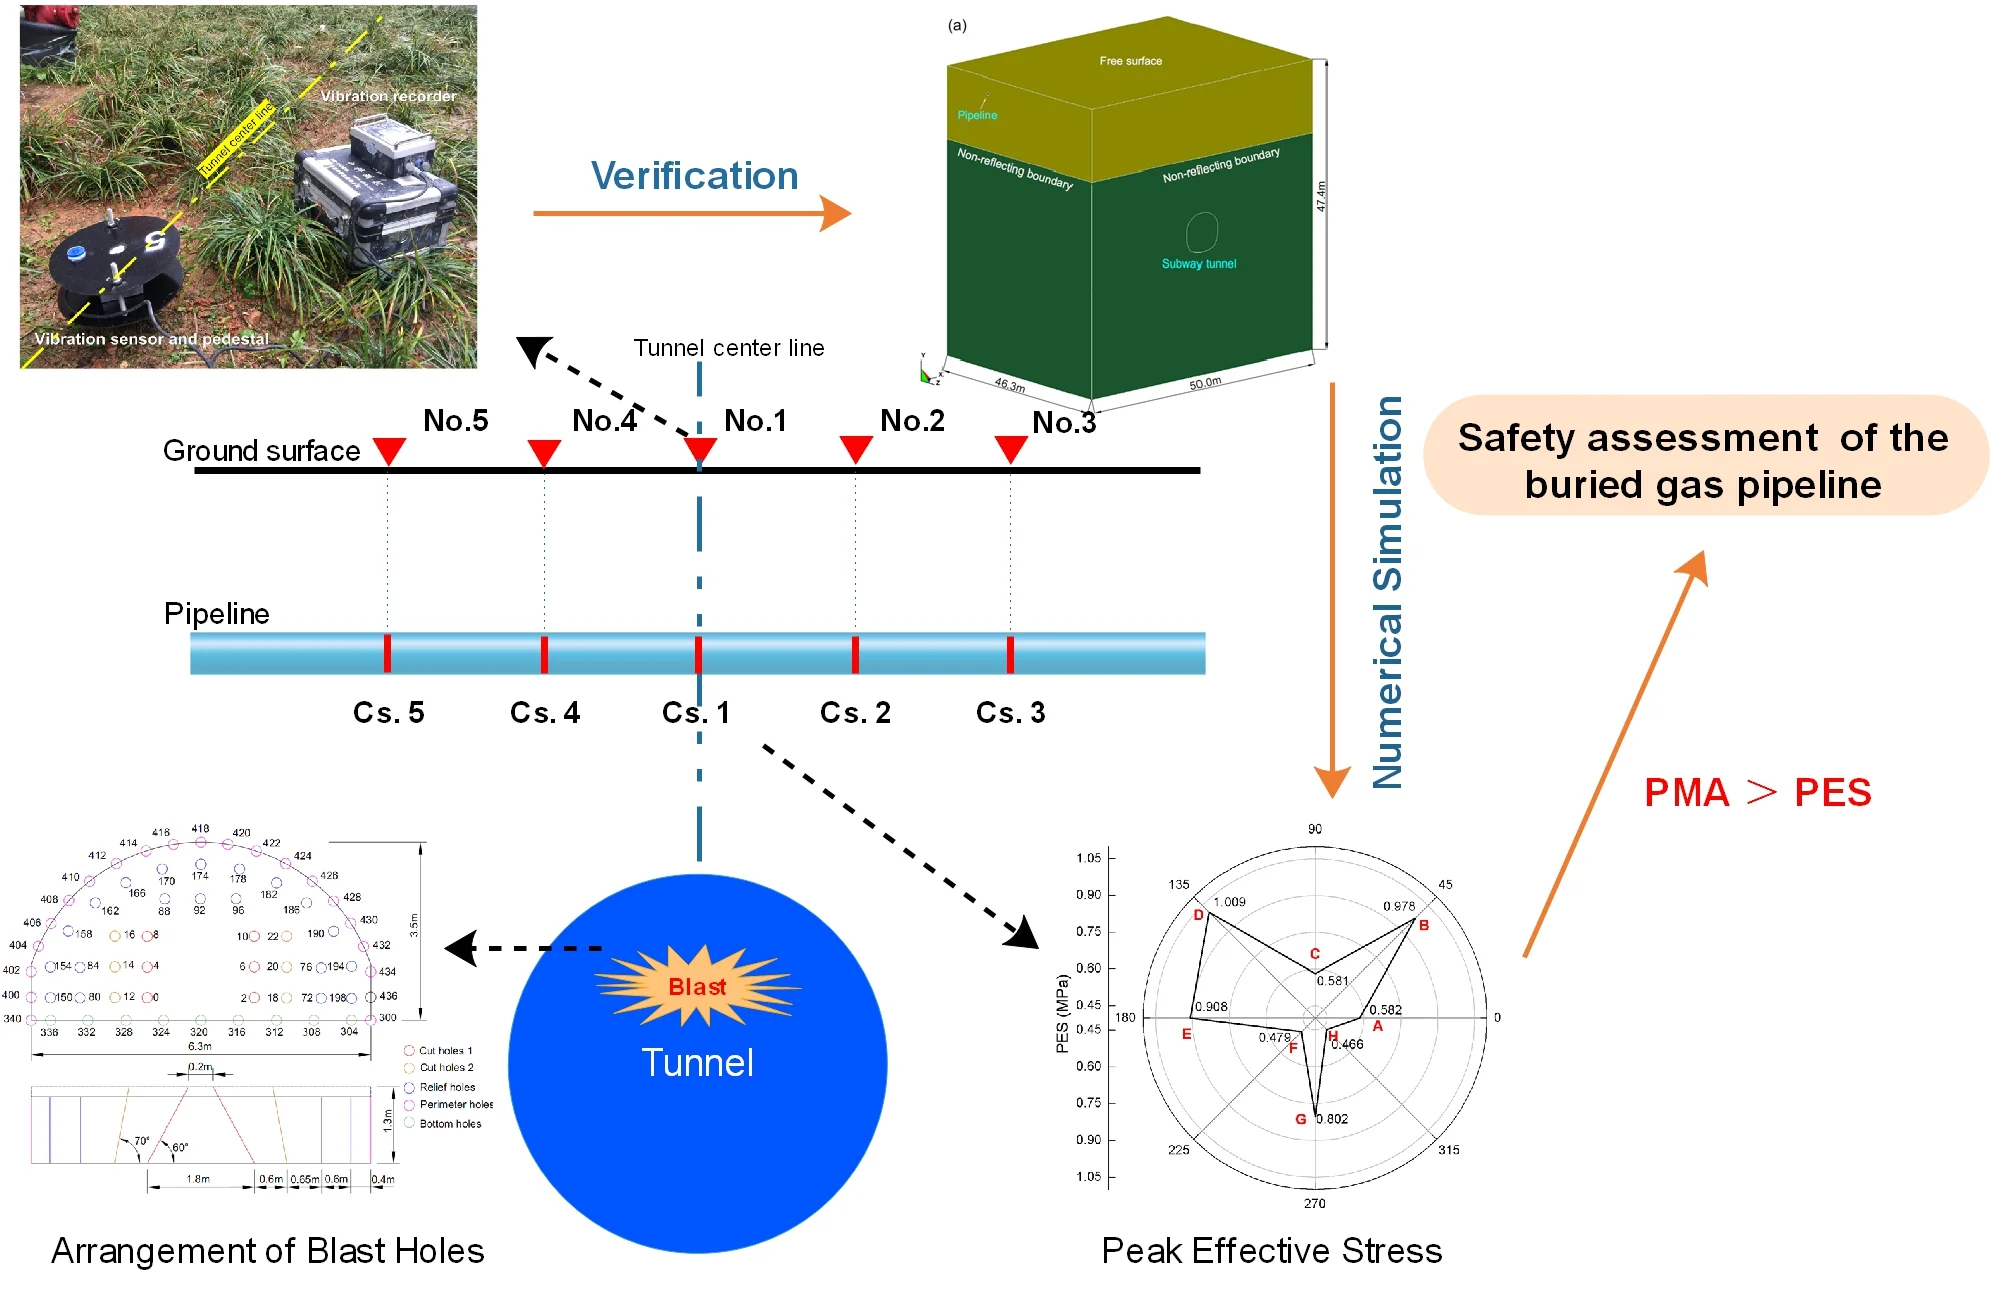
As the buried gas pipelines are not easily field monitored, its status under the influence of tunnel blasting vibration is often difficult to obtain. In order to assess the safety of an upper buried gas pipeline under blasting vibration in the Beijing subway line 16, we established the 3D numerical model of the real field engineering to calculate and analyze the distribution of peak particle velocity (PPV) on the surface soil, proved its reliability by using the field monitoring data and discussed the dynamic response of the pipeline. Based on the analysis, we further assessed the safety of pipeline subjected to tunnel blasting vibration and concluded that the pipeline is only subjected to limited effect of tunnel blasting vibration and thus is safe.
Highlights
- A viable numerical simulation method of assessing the safety of pipeline subjected to tunnel blasting is provided.
- The maximum allowable operating pressure (PMA) of pipeline can be used as the safety criterion.
- The effect of tunnel blasting vibration induced by 0.9kg explosive on the pipeline is limited and the pipeline is safe in this case.
1. Introduction
At present, more than 40 cities in China are constructing subways. Due to the complexity of the urban environment, subway tunnel passing through the existing gas pipelines often occurs. Because many subways tunnels are constructed using blasting, an efficient excavation method for hard rock, once the existing gas pipelines rupture and leak under the influence of blasting vibration, there will be severe consequences. Therefore, in the process of subway tunnel construction, it is important to assess and ensure the safety of gas pipelines during blasting excavation of tunnels passing through the pipelines.
Up to the present, the safety of pipeline under the impact of blasting has not been extensively studied except that of pipeline subjected to surface explosion of terrorism and military [1-6]. For example, Ojdrovic et al. analyzed the effects of blasting on pre-stressed concrete cylinder pipe (PCCP) lines and proposed guidelines for arriving at safe peak particle velocity (PPV) of blasts [7]. De et al. studied the surface blasting effects on underground pipelines based on centrifuge experiments [8]. Gad et al. reviewed the performance of pipelines during past earthquakes and estimated the possible range for blasting induced ground motions that would not cause any damage to pipelines of various materials [9]. Rigas estimated the safety of pressurized gas pipelines near the explosion sources [10]. Zhang et al. studied the effect of blasting vibration on underground pipeline in field opencast blasting experiment and predicted the risk of the pipeline [11]. In recent years, with the development of computer technology, numerical simulations are frequently adopted to study the influence of blast loading using various softwares [12-15]. Among them, ANSYS/LSDYNA, a nonlinear finite element software, is widely applied to analyze the impact of blast loading induced by detonation of explosives with simplified two-dimensional model or the blasting vibration load assumptions [16-19].
In this paper, the actual blasting engineering in section Xibeiwang-Malianwa (Xi-Ma) of the Beijing subway line 16 is taken as the study case. To assess the safety of an upper buried gas pipeline under blasting vibration of the subway line, we established a complex 3D numerical model of the real field engineering by using the software LS-DYNA, described the blast load in the process of tunnel excavation using the Jones-Wilkins-Lee (JWL) EOS, verified the reliability of model using the field monitoring data, discussed the dynamic response of the pipeline.
2. Background of the blasting operation
Beijing Subway Line 16 is a planned north-south trunk line of Beijing. It passes through three administrative districts: namely Fengtai, Xicheng and Haidian. The route starts from Wanping City Station in Fengtai District, passes through Beijing Lize Financial & Business District, Sanli Sanxi River, National Library, Suzhou Street, Yongfeng Science and Technology Park, Haidian Hill Area and ends at Haidian Beinan River. The line is a 49.8 km long underground line with 29 stations and two vehicle bases (Yushuzhuang parking and Beian River depot), as shown in Fig. 1.
Fig. 1Beijing subway line 16 layout
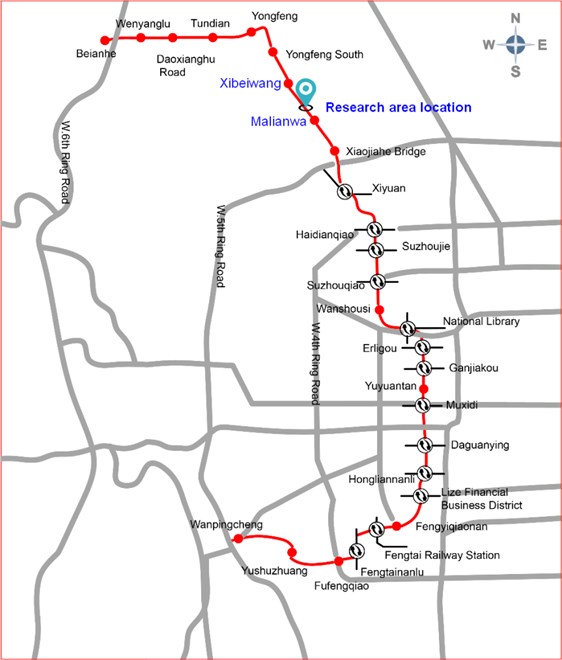
The Xi-Ma section of the Beijing Subway Line 16 is chosen as the research area (Fig. 1). This section is relatively flat with the quaternary sedimentary soil distributed on the ground surface. The surrounding rocks under the soil layer are mainly quartz sandstones and bedding with poorly developed joint, better homogeneity, higher toughness and Protodyakonov coefficient of 8-10. Because the subway tunnel is surrounded by hard rocks, blasting method is adopted for its excavation.
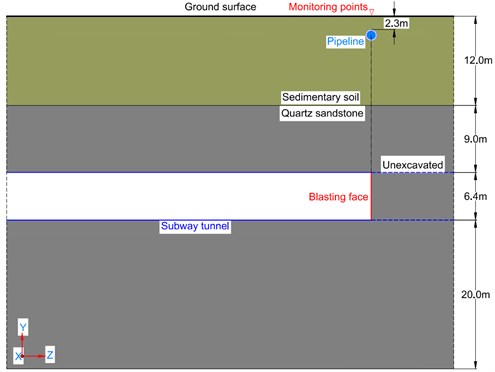
According to the site engineering geological survey, the distance between the tunnel roof and ground surface is 21 m. The tunnel in this section is designed as a 6.4 m high by 6.3 m wide horseshoe-shaped tunnel and to be constructed using the drilling and blasting of up-down short steps. Around the tunnel, there are a large amount of residential quarters and a large amount of gas pipelines distributed in the overlying soil. The tunnel passes through and vertically intersects with a ductile iron gas pipeline. The distance between the tunnel vault and the cast iron gas pipe is 18.7 m. Fig. 2 shows the relative position of the tunnel and the pipeline. The pipe has a diameter of 500 mm, wall thickness of 100 mm, and buried depth of 2.3 m. Analyzing and evaluating the effect of the tunnel blasting on the gas pipeline is one of the main purposes of this paper.
Fig. 2Spatial location diagram of the tunnel and the pipeline
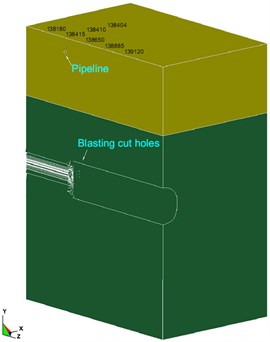
The tunnel is excavated by the drilling-and-blasting method in two benches. Fig. 3 shows the blast holes arrangement and detonator delay design and Table 1 lists the parameters of the blast holes in the upper bench. These holes are oblique holes with a diameter of 42 mm and circulating footage of 1.0-1.2 m in design. The cut holes are oblique holes and arranged in four rows with vertical depth of 1.3 m. Each cut hole is charged with 0.9 kg explosive and exploded using the smooth blasting method. The perimeter holes are vertical holes with depth of 1.2 m and outwardly inclined by 2°-4°. The hole-by-hole delay detonating network with electronic detonators is chosen with 2 ms difference for each cut and perimeter holes, and 4 ms difference for each relief and bottom holes.
In the lower bench, the blast holes include only relief holes, perimeter holes and bottom holes. They are horizontally drilled with depth of 1.2 m and arranges with row spacing of 0.8 m and hole distance of 0.9 m. Each hole is charged with 0.4 kg explosive. Except that the bottom hole pitch is set at 0.7 m, the other parameters of these holes are same with those in the upper bench.
Fig. 3Schematic diagram of arrangement of blast holes in the upper bench
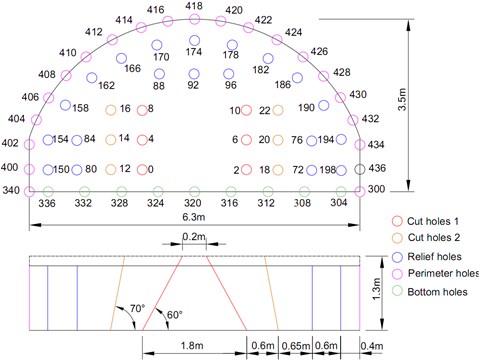
Table 1Blast holes parameters in the upper bench
Classification | Type | Depth (m) | Number | Single hole charge (kg) |
Cut holes 1 | 60° oblique hole | 1.5 | 6 | 0.9 |
Cut holes 2 | 70° oblique hole | 1.5 | 6 | 0.9 |
Relief holes | Vertical hole | 1.2 | 20 | 0.6 |
Bottom holes | Vertical hole | 1.2 | 11 | 0.6 |
Perimeter holes | Vertical hole | 1.2 | 19 | 0.3 |
Note: The total number of holes is 62, the total charge is 30 kg, the cross-sectional area is 18 m2, and the explosive unit consumption is 1.7 kg/m3 | ||||
3. Numerical modeling and parameter selection
To analyze and evaluate the effect of tunnel blasting excavation on the upper gas pipeline 21 m away from the top of the tunnel at vertical direction, a numerical model is established using the dynamic finite element software, ANSYS/LS-DYNA, to simulate the situation when the tunnel excavation face is directly under the pipeline. According to the blasting parameters in the field (Section 2), the charge of the cut holes in the upper bench is greater than that of other blast holes, and its produced blasting vibration is also greater than that of the other blast holes. For this reason, only 12 cut holes were selected for numerical analysis. In order to avoid the boundary effect of the model, the distance from the tunnel to the bottom of the model is more than 3 times of the height of the tunnel, and the distance between the tunnel and the edge of the model is more than 3 times of the width of the tunnel. The model materials include soil, rock, explosives, plugging mud and ductile iron pipe. The 8-node SOLID164 solid element is used to establish the model; Euler grids are used to separate explosives, stemming and surrounding rock and soil layers; Lagrange grids are used for the pipeline. Fluid-solid coupling is set up between the soil layers and the pipeline. To truly reflect the characteristics of contact between the pipe and the soil, the pipe and the soil contact part is set to automatic surface contact. The model adopts cm-g-μs unit system and multi-material ALE algorithm. According to the characteristics of the project site, the top surface of the model is considered as a free constrained boundary and other surfaces are all non-reflecting boundary. The numerical model size and boundary conditions are shown in Fig. 4.
Fig. 4Numerical model and boundary conditions
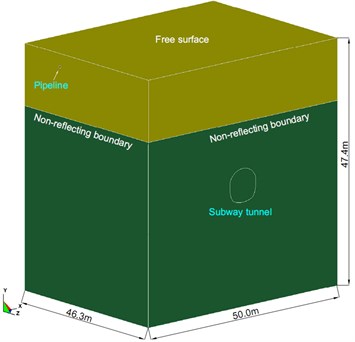
a) Whole model
b) Half model
The numerical calculation parameters are selected based on the indoor mechanical test results. The rock and soil in the research area is simplified to be homogenous without considering the influence of internal cracks and weak planes in rock mass. *MAT_SOIL_AND_FOAM material model is used for sedimentary soil, and *MAT_PLASTIC_KINEMATIC material model is selected for the quartz sandstone, stemming and ductile iron pipe [20].
The stress-strain formula of *MAT_SOIL_AND_FOAM is as follow:
where, is the contour stress, is the initial stress, is the ratio of material density to polymer density, is the kronecker delta, is the volume strain, is the relative volume, and is the initial volumetric strain and The mechanical parameters of *MAT_SOIL_AND_FOAM are listed in Table 2, and the pressure versus volumetric strain in the setting curve of the formula as shown in Table 3.
Table 2Mechanical parameters of *MAT_SOIL_AND_FOAM
/ g·cm-3 | Shear modulus / MPa | Bulk modulus / MPa | A0 | A1 | A2 |
1.73 | 3.85 | 28 | 0.03 | 1.31×10⁻⁵ | 0.123 |
Note: A0, A1 and A2 are yield function constants. | |||||
Table 3Pressure versus volumetric strain in the setting curve for *MAT_SOIL_AND_FOAM
Volumetric strain | 0 | 0.05 | 0.09 | 0.11 | 0.15 | 0.19 | 0.21 | 0.22 | 0.25 |
Pressure / GPa | 0 | 3.42 | 4.53 | 6.76 | 12.7 | 20.8 | 27.1 | 39.2 | 56.6 |
Note: The volumetric strain is given by the natural logarithm of the relative volume, . | |||||||||
The yield stress strain formula of *MAT_PLASTIC_KINEMATIC is as follow:
where, is the yield stress, is the initial yield stress, is the strain rate, and are the strain rate parameters, is the effective plastic strain, is the plastic hardening modulus, and is the hardening coefficient. The mechanical parameters of *MAT_PLASTIC_KINEMATIC for quartz sandstone, stemming and pipeline in the ANSYS numerical simulation are listed in Table 4.
Table 4Mechanical parameters of *MAT_PLASTIC_KINEMATIC
Parameters | / g·cm-3 | Elastic modulus / GPa | Poisson’s ratio | / GPa | Shear modulus / GPa | |
Quartz sandstone | 2.6 | 52 | 0.25 | 0.5 | 11.2 | 0.5 |
Stemming | 0.85 | 0.18×10⁻³ | 0.35 | 6×10⁻³ | 0.2×10⁻³ | 0.1 |
Pipeline | 7.85 | 205 | 0.3 | 0.245 | 60 | 0.3 |
During the blasting operation, the detonation of explosives is a rapid chemical reaction process and detonation products have been described using many different equations of state (EOS). In ANSYS/LSDYNA, the Jones-Wilkins-Lee (JWL) EOS is a high energy combustion model used to describe the chemical reaction process and has capacity to predict a large range of pressure caused by explosion using experimentally-obtained parameters [21]. In this study, JWL EOS is chosen to describe the explosion and expressed as follows:
where and are the relative specific volume and the pressure of the detonation products, respectively, is the internal energy per unit volume and , , , and are the material constants.
In the current study, No. 2 rock emulsion explosive, which is also used in the field, is chosen and 0.9 kg explosive is charged at the bottom of each cut hole. However, due to the lack of measurement instruments, JWL EOS parameters are referred to those in Jiang et al. and Xie et al. [22] except the density of explosive, which is determined in the field test. Table 5 lists all the EOS parameters.
Table 5Material model and EOS parameters of the No.2 rock emulsion explosive
Density (g·cm-3) | Detonation velocity (cm·μs-1) | (GPa) | (GPa) | (GPa) | |||
1.25 | 0.4 | 214.4 | 18.2 | 4.2 | 0.9 | 0.15 | 4.192 |
4. Numerical calculation and analysis
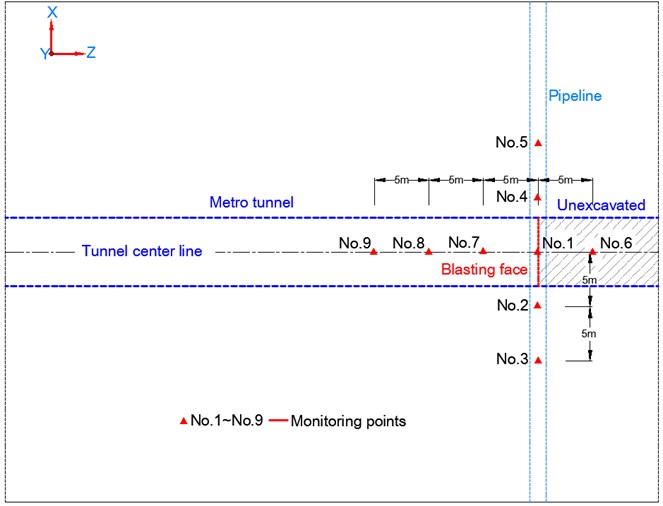
Because the pipeline is buried in the soil, the gas pipeline company does not allow excavation to reveal the pipeline for monitoring. In order to realize the comparison and verification of the actual blasting vibration monitoring results, a series of monitoring points were set up on the surface soil above the pipeline to extract the PPV. Among them, No. 1 to No. 5 are located on the soil surface directly above the pipeline with No.1 located on the soil surface just above the intersection of the pipeline and the tunnel centerline, and No. 6 to No. 9 are respectively located on the soil surface just above the tunnel centerline. All monitoring points are 5 m away from their adjacent monitoring points. The layout of all monitoring points is shown in Fig. 5. The IDs of nodes corresponding with the monitoring points in the numerical model are shown in Fig. 4(b).
Fig. 5Layout of the monitoring points
The vertical direction is the easiest to determine during the placement of test instruments. To avoid the error caused by the vibration direction, the resultant PPV is used to analyze the vibration velocity on the monitoring points. Fig. 6 shows the distribution of PPVs on the surface soil directly above the pipeline. It can be seen from Fig. 6 that the maximum PPV of the surface soil reaches 1.510 cm/s and appears at No. 1 point with node ID of 138415. With the straight-line distance between the explosion source and monitoring point increasing, PPVs gradually decrease, showing the minimum of 0.875 cm/s at No. 3 point.
Fig. 6PPVs on the surface soil above the pipeline
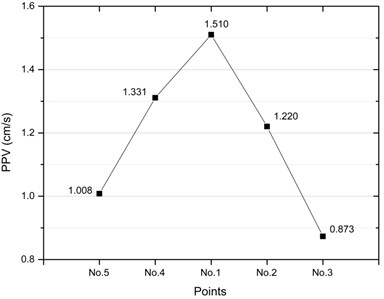
Fig. 7PPVs on the surface soil along the centerline of the tunnel
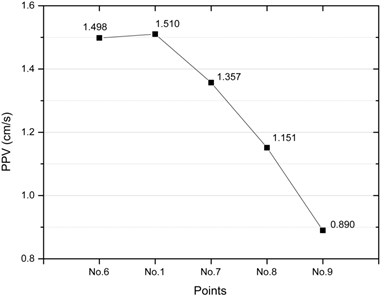
Fig. 7 shows the distribution of PPV on the surface soil along the centerline of the tunnel. It can be found from Fig. 7 that only one peak with value of 1.510 cm/s appears in the distribution curve of PPV at No.1 point which is directly above the pipeline and blasting source. Moreover, the PPVs at the rear excavation blasting face decrease with the increase of distance. According to the cavity effect mentioned in the relevant literature [23], the area may have an impact on the propagation of blasting seismic waves after tunnel excavation, resulting in an increase in PPV on the ground surface. But in this study, the cavity effect is not obvious, that is to say that the PPV will not increase after the tunnel passes through the pipeline.
5. Field blasting vibration monitoring and verification
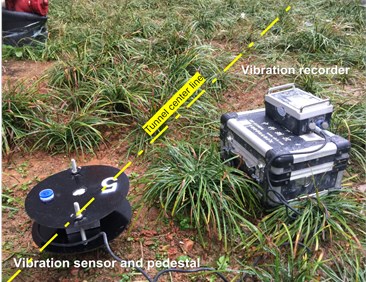
Because the pipeline is buried in the soil, the gas pipeline company does not allow excavation to reveal the pipeline for monitoring. To verify whether the numerical simulation result is reasonable, nine field monitoring points are set up based on the actual conditions of blasting excavation in subway tunnel on the ground surface along the pipeline. Meanwhile, in consistence with the arrangement of the numerical simulation monitoring points, the field monitoring points are arranged at the same location and the specific distribution of the points are shown in Fig. 8. The TC-4850 self-recording instrument developed and manufactured by Zhongke (Chendu) Instruments Company Limited is used to monitor the vibration. The instrument contains a trivector sensor with measuring vibration ranging from 0.001 cm/s to 35.4 cm/s and measuring frequency ranging from 0 to 1000 Hz. Fig. 8 shows the setting of field monitoring points.
Fig. 8The photo of the field monitoring points
The TC-4850 can record the velocity in the three directions. The vertical velocity is the easiest to determine, and it is usually the most accurate. So, we choose a typical vertical velocity curve to compare with the numerical simulation result. Fig. 9 shows the vertical velocity curves of numerically simulation and field test on the No.1 point. It can be obtained from Fig. 9 that the calculated vibration velocities and field monitored vibration velocities show essentially the same changing tendency, indicating that the numerical simulations could truthfully reflect the changing characteristics of vibration velocity.
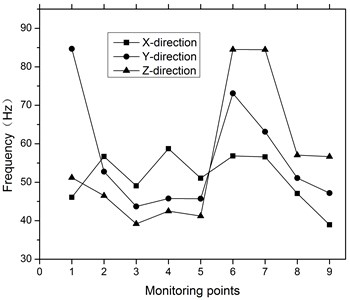
Table 6 lists the numerically simulated and field measured PPVs at each monitoring point. From Table 6, it is clear that the simulated PPVs are slightly higher than but similar to those obtained by field monitoring, and the maximum error rate of resultant PPV is 18.19 %. The reason for the above phenomena is that the numerical simulation process does not consider the influence of the possible existence of joint and weakening face on the attenuation of PPVs in the rock and soil. Meanwhile, using the Fast Fourier Transformation (FFT) method, the frequency of blasting vibration at each monitoring point is analyzed based on frequency spectrum to obtain its main frequency of vibration. Among them, the FFT frequency spectrum analysis diagram of the -direction vibration velocity of No. 1 measuring point is shown in Fig. 10 and the vibration frequencies measured on the fields at all monitoring points are counted and presented in Fig. 11. From Fig. 11 it is clear that about 95 % of the monitoring data have vibration frequencies of 40-90 Hz. The blasting vibration frequency of the tunnel excavation in the section is relatively high compared with the natural frequency of the pipeline, which is between 3 Hz and 12 Hz, but obviously smaller than the vibration frequency of the blasting seismic wave. Therefore, the blasting vibration is difficult to resonate with the gas pipeline.
Fig. 9Comparison of vertical velocity curves between numerically simulation and field test on the No. 1 point
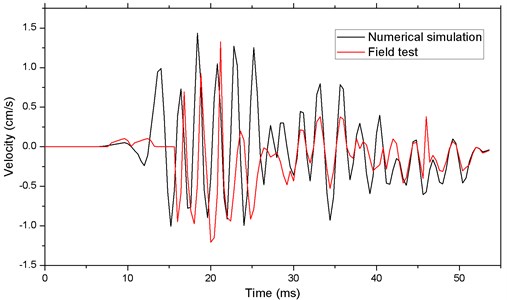
Fig. 10The blasting vibration FFT spectrum analysis diagram of the No. 1 point
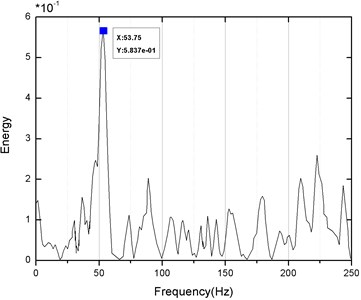
Fig. 11Main vibration frequency of the monitoring points
In summary, the comparison of the numerical simulation data and the field test data shows that the numerical calculation model and the parameter selection are reasonable. It is feasible to study the dynamic response characteristics and assess the safety of adjacent pipelines subjected to tunnel blasting vibration by numerical simulation.
Table 6PPVs of numerical simulation and field monitoring
Monitoring points | PPV of numerical simulation (cm/s) | PPV of field monitoring (cm/s) | Error rate (%) |
No.1 | 1.510 | 1.387 | 8.87 |
No.2 | 1.220 | 1.126 | 8.35 |
No.3 | 1.873 | 1.637 | 14.42 |
No.4 | 1.331 | 1.241 | 7.25 |
No.5 | 1.008 | 0.856 | 17.76 |
No.6 | 1.498 | 1.302 | 15.05 |
No.7 | 1.357 | 1.235 | 9.88 |
No.8 | 1.151 | 0.989 | 16.38 |
No.9 | 0.890 | 0.753 | 18.19 |
6. Safety assessment of the buried gas pipeline
6.1. Dynamic response of pipeline along the axial direction
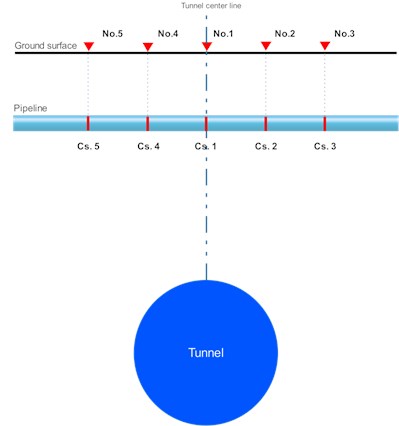
In order to assess the safety of the buried gas pipeline subjected to the tunnel excavation blasting effect, five different pipeline cross-sections, Cs.1 to Cs.5, are selected as the monitoring objects along the pipeline axial direction in the numerical model. All the cross-sections are directly below the ground monitoring points, and the specific location of the cross-sections is described in Fig. 12.
Fig. 12The location of the selected cross-sections of the pipeline
As we all know, the blasting seismic wave propagating to the pipeline will cause the vibration of pipeline and change the state of stress and strain. In this dynamic process, changes in vibration velocity and effective stress of the pipeline are the most significant. Therefore, in this paper, we mainly analyzed the variation of vibration velocity and effective stress of the pipeline.
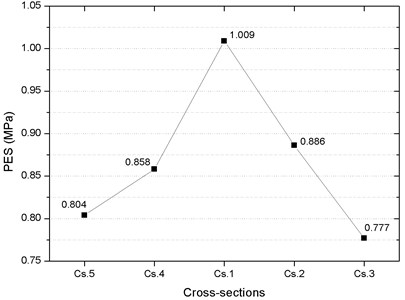
The distributions of PPV and peak effective stress (PES) on the pipeline are analyzed by extracting the maximum values of each pipeline section. Fig. 13 presents the distribution of PPVs in the selected cross-sections of the pipeline. It can be seen from the figure that the PPV on the Cs.1 of the pipeline is the highest, reaching 1.820 cm/s at the position just above the tunnel and the PPVs in the cross-sections decrease with increase in the distance between the cross-section and the tunnel. Fig. 14 presents the distribution of PESes in the selected cross-sections of the pipeline. Like PPVs, the PES at the Cs.1 of the pipeline is the highest, reaching 1.009 MPa at the position just above the tunnel and the PESes in the cross-sections decrease with increase in the distance between the cross-section and the tunnel. These results indicate that the Cs.1 of the pipeline, which is just above the center line of the tunnel, is affected mostly by blasting. Therefore, when assessing the pipeline safety, the safety of Cs.1 is mainly analyzed.
Fig. 13Distribution of PPV in the cross-sections of the pipeline
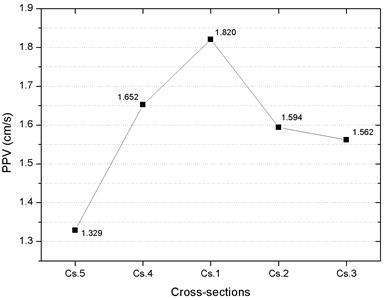
Fig. 14Distribution of PES in the cross-sections of the pipeline
6.2. Dynamic response of the cross-sections of the pipeline
In order to analyze the impact of tunnel blasting on the cross-section Cs.1, 8 points on the pipe wall are selected for analysis, as shown in Fig. 15. Among them, the point G in the pipe wall is nearest to the source of the explosive (i.e., the welcome blast side) and the point C is the farthest from the source of the explosive. The PPV and PES at each point of the wall of the section of the pipeline are extracted. The distribution of the PPV and PES are drawn and shown in Fig. 16 and Fig. 17.
Fig. 15The monitoring points on the cross-section of the pipe
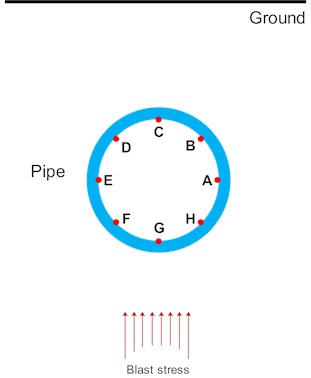
Fig. 16 shows the distribution of PPVs at the pipeline cross-section. From Fig. 16 it can be found that when the blasting stress wave comes from right below the pipeline, the maximum PPV appears at the bottom of the pipeline, reaching 1.820 cm/s at point G. At the top of the pipeline, the PPV at point C is also great, reaching 1.735 cm/s. Therefore, we hold the opinion that the blasting seismic waves propagate first to the bottom of the pipeline (point G), so the PPV of point G is larger. With the blasting seismic wave bypasses the pipeline, the wave energy will decay. So, the PPVs at points A, E, F and H are smaller. When the blasting seismic wave propagates to the ground above the pipeline, a series of reflection superposition phenomena will occur, resulting in increased PPVs at the points C and B on the pipeline.
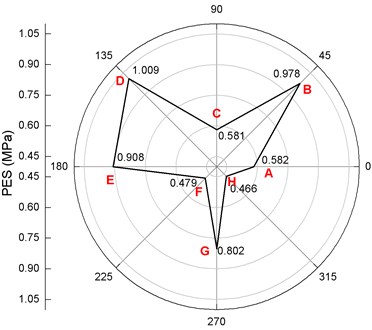
Fig. 17 shows distribution of PES on the cross-section of the pipeline. It is clear that PES appears to be the highest at point D on the cross-section of the pipeline, reaching 1.009 MPa, and is 0.978 MPa, 0.908 MPa and 0.802 MPa at points B, E and G, respectively. Due to the existence of the free surface of the ground, the reflection of the blasting stress wave at the free surface appears superimposed with the incident wave and the reflected wave. At this time, due to the influence of the reflected wave angle, the stresses acting on point C appears to cancel each other out, while the stresses action on points D and B, due to the superposition effect, are enhanced at a certain degree. Hence, PES is greater than at points B and D than points C and G points. Meanwhile, referring to GB/T13295-2013 [24], the maximum allowable operating pressure (PMA) of DN500 pipeline is 4.6 MPa, which is much greater than the effective stress caused by tunnel blasting. In addition, there is no gas leak during the inspection of field blasting vibration. All these indicate that the effect of tunnel blasting vibration is limited for the pipeline, and the pipeline is safe when the subway tunnel passes directly below the pipeline.
Fig. 16Distribution of PPVs on the cross section of pipe
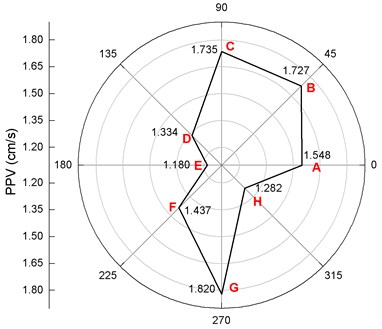
Fig. 17Distribution of PESes on the cross-section of the pipe
7. Conclusions
1) Due to the pipeline is buried in the soil, the gas pipeline does not allow to be excavated and revealed. It is impossible to assess the safety of pipeline by field test. However, the PPV and PES of the pipeline can be obtained by numerical simulation, providing a viable method of assessing the safety of pipeline subjected to tunnel blasting.
2) The comparison of the numerical simulation data and the field test data shows that the numerical calculation model and the parameter selection are reasonable, and the numerical calculation model is feasible for studies on the dynamic response characteristics of adjacent pipelines subjected to tunnel blasting vibration.
3) Based on the numerical simulations, the PMA (4.6 MPa) is still higher than the maximum PES, 1.009 MPa, of each monitoring point on the cross-section of the pipeline. It can be considered that the effect of tunnel blasting vibration on the pipeline is limited and the pipeline is safe.
References
-
Kouretzis G. P., Bouckovalas G. D., Gantes C. J. Analytical calculation of blast-induced strains to buried pipelines. International Journal of Impact Engineering, Vol. 34, Issue 10, 2007, p. 1683-1704.
-
Won J. H., Kim M. K., Kim G., Cho S. H. Blast-induced dynamic response on the interface of a multilayered pipeline. Structure and Infrastructure Engineering, Vol. 10, Issue 1, 2014, p. 80-92.
-
Giannaros E., Kotzakolios T., Kostopoulos V. Blast response of composite pipeline structure using finite element techniques. Journal of Composite Materials, Vol. 50, Issue 25, 2016, p. 3459-3476.
-
Zhang Z. J., Zhao C. L., Zhang L. M. Experimental investigation of blasting vibration safety criterion on buried pipeline. Blasting, Vol. 33, Issue 2, 2016, p. 12-16, (in Chinese).
-
Abedi A. S., Hataf N., Ghahramani A. Analytical solution of the dynamic response of buried pipelines under blast wave. International Journal of Rock Mechanics and Mining Sciences, Vol. 88, 2016, p. 301-306.
-
Amini K., Altenhof W., Yuen S. C. K., Opperman C. J., Nurick G. N. Experimental and numerical investigation on the deformation and energy dissipation of AA6061-T6 circular extrusion subjected to blast loading. International Journal of Impact Engineering, Vol. 110, 2017, p. 228-241.
-
Ojdrovic R. P., Rose B. D., Zarghamee M. S. Analysis of blast effects on PCCP pipelines. New Pipeline Technologies, Security and Safety, 2003, p. 1201-1209.
-
De A., Zimmie T. F., Vamos K. E. Centrifuge experiments to study surface blast effects on underground pipelines. Pipelines: Optimizing Pipeline Design, Operations, and Maintenance in Today’s Economy, 2005, p. 362-370.
-
Gad E. F., Wilson J. L., Balendra T., Moore A. J., Richards A. B. Response of pipelines to blast loading. Australian Journal of Structural Engineering, Vol. 7, Issue 3, 2007, p. 197-207.
-
Rigas F. Safety of buried pressurized gas pipelines near explosion sources. Proceedings of the 1st Annual Gas Processing Symposium, 2009, p. 307-316.
-
Zhang L. M., Zhao M. S., Chi E. A. Experiment of effect of blasting vibration on underground pipeline and risk prediction. Journal of Vibration and Shock, Vol. 36, Issue 16, 2017, p. 241-247, (in Chinese).
-
Karagiozova D., Nurick G. N., Langdon G. S. Behaviour of sandwich panels subject to intense air blasts – Part 2: Numerical simulation. Composite Structures, Vol. 91, Issue 4, 2009, p. 442-450.
-
Jiang N., Zhou C. Blasting vibration safety criterion for a tunnel liner structure. Tunnelling and Underground Space Technology, Vol. 32, 2012, p. 52-57.
-
Mokhtari M., Nia A. A. A parametric study on the mechanical performance of buried X65 steel pipelines under subsurface detonation. Archives of Civil and Mechanical Engineering, Vol. 15, Issue 3, 2015, p. 668-679.
-
Ainalis D., Kaufmann O., Tshibangu J. P., Verlinden O., Kouroussis G. Modelling the source of blasting for the numerical simulation of blast-induced ground vibrations: a review. Rock Mechanics and Rock Engineering, Vol. 50, Issue 1, 2017, p. 171-193.
-
Coughlin A. M., Musselman E. S., Schokker A. J., Linzell D. G. Behavior of portable fiber reinforced concrete vehicle barriers subject to blasts from contact charges. International Journal of Impact Engineering, Vol. 37, Issue 5, 2010, p. 521-529.
-
Jiang N., Zhou C., Lu S., Zhang Z. Effect of underground mine blast vibrations on overlaying open pit slopes: a case study for Daye iron mine in China. Geotechnical and Geological Engineering, Vol. 36, Issue 3, 2018, p. 1475-1489.
-
Hu Y., Lu W., Wu X., Liu M., Li P. Numerical and experimental investigation of blasting damage control of a high rock slope in a deep valley. Engineering Geology, Vol. 237, 2018, p. 12-20.
-
Zheng C., Kong X., Wu W., Xu S., Guan Z. Experimental and numerical studies on the dynamic response of steel plates subjected to confined blast loading. International Journal of Impact Engineering, Vol. 113, 2018, p. 144-160.
-
Hallquist J. O. LS-DYNA Keyword User’s Manual. Livermore Software Technology Corporation, 2007.
-
Yi C., Sjöberg J., Johansson D. Numerical modelling for blast-induced fragmentation in sublevel caving mines. Tunnelling and Underground Space Technology, Vol. 68, 2017, p. 167-173.
-
Xie L. X., Lu W. B., Zhang Q. B., Jiang Q. H., Wang G. H., Zhao J. Damage evolution mechanisms of rock in deep tunnels induced by cut blasting. Tunnelling and Underground Space Technology, Vol. 58, 2016, p. 257-270.
-
Xia X., Li H., Liu Y., Yu C. A case study on the cavity effect of a water tunnel on the ground vibrations induced by excavating blasts. Tunnelling and Underground Space Technology, Vol. 71, 2018, p. 292-297.
-
GB/T13295-2013 Ductile Iron Pipes, Fittings and Accessories for Water or Gas Applications. AQSIQ, 2013, (in Chinese).
Cited by
About this article

The study was sponsored by the National Natural Science Foundation of China (Grant No. 41572281), and the Natural Science Foundation of Hubei Province of China (Grant No. 2017CFB310).
