Abstract
High-speed rail stations have long-span floor structures stretching over rail tracks and platforms. These long-span floor structures are prone to vibration caused by large crowds. Current floor vibration design guidelines lack specific provisions addressing this type of structures. There is a need to study the crowd excitation and the vibration performance of the long-span floor structures. A field testing study was recently conducted in China’s newly constructed Xi’an North Railway Station, and results of the study is discussed in this paper. The output-only method was used for modal testing, where vertical accelerations were recorded at a grid of fifty locations on the floor panels and analyzed to obtain the natural frequencies, mode shapes, and damping ratios of structural vibration modes. Vibration measurements were taken and analyzed at a variety of load cases, which included operating cases at the floor sections in use to assess vibration performance of the floor structure, and several experimental cases at the floor sections not yet in use to investigate the effects of crowd size and walking and jumping frequency on floor vibration. It was found that under most operating conditions, the floor structural vibration didn’t exceed the commonly accepted design limits. Thus, the vibration control design of the floor structure is deemed satisfactory. Under certain coordinated crowd movements (e.g., walking and jumping at certain frequencies), resonance occurred, and vibration levels exceeded the threshold for acceptance. The crowd excitation frequency has a greater influence than the crowd size on floor vibration responses.
1. Introduction
Long-span floor structures in public buildings, such as airports and train stations, are prone to vibrations caused by large moving crowds. Due to their unique structural systems and the randomness in crowd movements, current floor vibration design guidelines do not adequately address vibrations of this type of structures. To investigate the vibration behavior and to assess the performance of the long-span floor structures, a field testing study was conducted at the newly constructed Xi’an North Railway Station (hereafter referred as the station). The station connects the high-speed rail lines to the city subway and surface transit systems. The structures of the station (including main building and canopied platforms) cover an area of 434.5 m in East-West direction by 550.4 m in North-South direction, with 34 rail tracks and 18 platforms running through. The gross floor area of the station is about 338,000 m2 [1]. There are three major structural levels in the main building, with upper level for departure, lower level for arrival, and tracks and platforms in the middle. The concourse at upper level serves as the waiting area of a large assemblage of passengers, and it covers an area of 96,465 m2 with the dimensions of 181.100 m in East-West direction and 523.980 m in North-South direction. Its floor structure consists of composite slab (concrete on corrugated metal deck) supported on long-span (more than 43 m) steel trusses, so floor vibration became a concern of design engineers.
Steel long span floor structures are vulnerable to vibration issues because they are relatively light, their damping is low, and their increased spans reduce stiffness, resulting in higher levels of oscillation. There have been many practical issues related to vibrations on floors of multi-story buildings of different types [2]. In addition, the first few natural frequencies of such long span floor structures often fall into the range of human walking frequencies. Therefore, resonance may become a problem. Building serviceability, in particular, vibration control may be the governing criterion for floor structural design [3, 4]. Most floor vibration research was done on hot-rolled steel beams and steel open web joists with shorter spans, which behave differently from the floor structure of the station. Varela and Battista [5] conducted experimental testing on lightweight composite floor deck structures for vibration due to human walking and investigated the control of vibration on this type of floor structures using passive control mechanical devices. Au et al. [6] tested coupled floor slabs of an indoor recreation building for their dynamic properties. Hanagan and Murray [7] discussed an active control scheme for reducing floor vibration of steel open web joist floor system. De Silva and Thambiratnam [8] studied dynamic characteristics of a multi-panel steel-deck floor system under human-induced loads using finite element techniques and found “vibration caused by the higher harmonics of the activity frequency can also cause discomfort and excessive deflections in the floor panels”.
Passing high-speed trains may induce vibration to the supporting structures. Researchers in Asia [9] and Europe [10, 11] investigated the train-induced vibration on environment and adjacent structures. With and Bodare [12] used transfer functions to investigate train-induced vibrations in buildings. Researchers from Tufts University studied train-induced vibration in buildings and developed an impedance-based predictive model to evaluate vibration transmission in building columns and conducted scaled model testing [13]. They also proposed a vibration transmission mitigation method by increasing the thickness of a lower floor slab. The researchers validated the model in a real building field test [14] and concluded that the impedance-based predictive model “offers a simple and quick approach for reasonably accurate prediction of train-induced vibration with small computational requirements”.
This paper presents the results of the study that was focused on vibration behavior of the long-span concourse level floor of the station under crowd excitations. The significance of this study lays in the fact that this is a relatively new territory in floor vibration control and design, and it deserves more attention. The authors want to share their valuable data to the engineering community. In this study, modal testing was performed to obtain the structural dynamic properties of the floor system, including natural frequencies, modal shapes, and damping ratios of the first two modes. Then accelerations of floor vibration were measured under a variety of load cases, both operating and experimental, such as train arriving and departing, passenger checking-in and boarding, and crowd walking and jumping at different frequencies. The vibration performance of the floor structure was assessed by the measured results, and crowd excitation parameters that affect the floor vibration were analyzed and compared.
2. Field testing
2.1. Floor structure
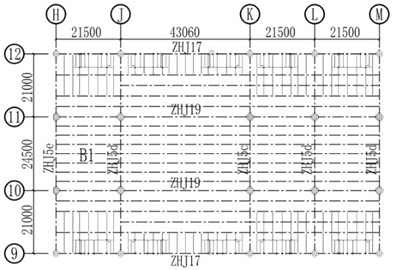
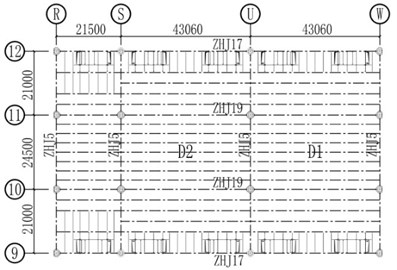
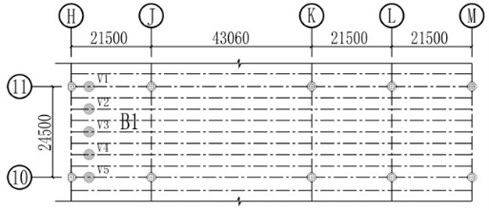
Because of the great length in the North-South direction (523.980 m), the main building of the station is separated into five sections in this direction (Sections A to E) by four expansion joints. The field testing of this study was performed on the concourse level in Sections B and D. Fig. 1 shows the floor structural framing plan of Sections B and D. The floor framing is composed of structural steel trusses in both directions. The main trusses (truss girders) are in East-West direction and their spans are 21.000 m, 24.500 m, and 21.000 m, respectively. The secondary floor trusses are running in North-South direction, with spans of 21.500 m and 43.060 m. The columns that support the main trusses are round hollow structural steel shapes filled with concrete. The modal testing was conducted in Section D, in particular, Panels D1 and D2 as labeled in Fig. 1, with D1 between Grids 10 and 11, U and W, and D2 between 10 and 11, S and U. Vibration measurements were taken on Panels D1 and D2, as well as Panel B1 in Section B, which is between Grids 10 and 11, H and J.
The floor slab consists of 76 mm thick steel corrugated deck with 74 mm thick topping concrete, with a total slab thickness of 150 mm. Steel stud shear connectors are installed to connect the deck to the supporting truss top chords, in order to create the composite action between concrete slab and steel trusses. Both main trusses and secondary trusses are 3000 mm in height and are composed of H-shaped steel sections (400×400 mm with varying thicknesses of flanges and web) for chords and H-shaped or round hollow structural sections for web members. The concrete used for slabs is of strength grade C30 (with specified 150 mm cube compressive strength 30 MPa), and the concrete filled in steel hollow section columns is of strength grade C40 ( 40 MPa). Steel used in trusses is of strength grade Q345 with specified yield strength of 345 MPa [1].
Fig. 1Floor framing plan: a) section B, b) section D
a)
b)
2.2. Instrumentation
Eight 941-B Ultra Low Frequency Vibration Pickup Sensors were used in this study. The 941-B sensor is a reciprocal pendulum type vibration measurement device, including voltage reciprocal motion of the seismic mass with a coil in the magnetic field. The sensor can be set to record acceleration or velocity signals. In this study vibration was measured in terms of acceleration. The specified frequency range by the manufacturer is 0.25 Hz to 80 Hz. Human induced vibration of floor structures typically occurs at relatively low frequencies, so the sensor is suitable for this study. The sensitivity under the setting used in this study is 5×10⁻⁶ m/s2. The sensors were secured to the floor by adhesive during field testing. The data acquisition system includes an Anzheng® AZ308 Signal Collecting Module and an AZ808 Analyzer. The data process and analysis system is the AZ_CRAS Dynamic Signal Analysis System. An AZ308 module has a built-in Digital Signal Processor (DSP), a USB2.0 port, an 8-channel parallel data acquisition, and a 14 bit A/D converter. The sampling rate was set at 128 data points per second (128 Hz). The low-pass filtering frequency in AZ808 Analyzer was set to 20 Hz in order to eliminate high frequency noises. The combination of the sensor and data acquisition system has been used in many structural testing applications and proven to work properly.
2.3. Modal testing
In this study, the output-only ambient vibration approach was employed for modal testing. The ambient vibration signals were recorded and analyzed to obtain the dynamic properties of the floor structure. The advantage of ambient vibration method is that it does not require force input thus simplifies the testing. For such a large scale structure as the station, applying external excitation signals strong enough for modal testing may be impractical or even prohibitive. The basic premise of ambient vibration method is that a structure will respond strongest near its natural frequencies under ambient excitations. This study utilized the Power Spectral Density (PSD) of the output signal. To summarize the information contained in the PSDs of all measured signals, the PSDs are normalized and averaged using Eq. (1) below to produce the Average Normalized PSD (ANPSD):
In Eq. (1), is the th discrete frequency, and is total number of discrete frequencies in PSD. is the PSD at measurement point , and is the total number of measurement points. The natural frequencies were then identified from the peaks of the ANPSD. Mode shape for th mode is determined by the relative magnitudes of the measurement points with respect to the reference points by Eq. (2), and the phase (+ or –) by Eq. (3), as follows:
and are the auto-spectra at measurement point and reference point , respectively. is the cross-spectrum of and . This method was implemented in the data analysis system used in this experimental study. Although with many advantages, this method may have the disadvantage of inaccuracy for structures with closely-spaced modes. The floor system of the station is a typical long-span and simple floor structure, and the vibration study focused only on the lowest vertical modes. These vertical modes of the floor structure are not expected to be complex spatially, or closely-distributed spectrally. Hence, it’s appropriate to use this method to identify the vertical vibration modes for the floor structure of the station. Similar output only approaches have been used by researchers in measurements to display operating deflection shapes [15-17].
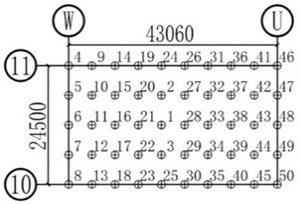
Modal testing was performed in both Panels D1 and D2. Fifty measurement points were evenly distributed on the floor in each panel. See Fig. 2 for approximate measurement point locations in D1. During each measurement, three sensors were always placed near the center of the panel which are labeled as points 1, 2, and 3 in Fig. 2. These three points served as reference points in the data analysis. The remaining five sensors were placed near one side of the floor panel for the first measurement (points 4 to 8), and then were moved toward the other side for the subsequent measurements (points 46 to 50 for the last measurement), so a total of ten measurements were taken. Each measurement took three sets of 60-second acceleration records. The aforementioned AZ_CRAS Dynamic Signal Analysis System was used to process the data and identify the modes.
Fig. 2Layout of modal testing measurement points of Panel D1
Modal identification results indicate that the first mode frequencies of the Panels D1 and D2 are 3.25 Hz and 3.70 Hz, respectively; and the second mode frequencies are 3.70 Hz and 4.20 Hz, respectively (see Table 1). After modal frequencies were identified, the improved half-power band width method was used to compute the damping ratio corresponding to each particular mode. The damping ratios for the first two modes range between 1.10 % and 1.74 %, as can be seen in Table 1.
Table 1Results of modal testing
Floor panel | D1 | D2 | |
Vertical frequency (Hz) | 3.25 | 3.70 | |
3.70 | 4.20 | ||
Damping ratio (%) | 1.74 | 1.38 | |
1.65 | 1.10 |
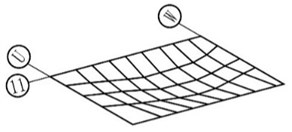
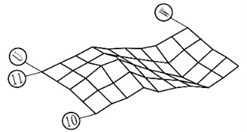
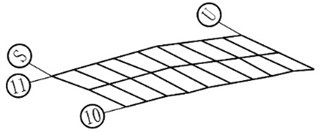
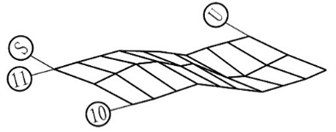
The modal testing results indicated that the floor structures were of low frequencies (the first frequencies of the two panels were under 4 Hz) and hence prone to vibration issues. Using the method introduced above, the mode shapes of the first two modes of panels D1 and D2 were extracted from measured data. Fig. 3 illustrates the mode shapes of first two modes of D1 and D2. It is apparent from the figure that the first mode of both panels is of single curvature with the peak point near the center, and the second mode of both panels is of double curvature in the longer direction with two peak points in opposite sides of the center. The mode shapes matched analysis results.
Fig. 3Measured first two modal shapes of Panels D1 and D2: a) mode 1 of D1, b) mode 2 of D1, c) mode 1 of D2, d) mode 2 of D2
a)
b)
c)
d)
2.4. Field vibration measurements
The accelerations of floor vibration were measured under two types of load cases, namely, operating cases and experimental cases. Operating cases include train arriving and departing, and passenger gate checking-in. Experimental cases include crowd synchronized walking and jumping under preset frequencies.
The station building shares the same foundation with rail tracks. Although measures have been taken to isolate the building floor structure from rail track supporting structure, vibration may be transmitted to floor structure through the foundation. Two measurement cases were conducted to investigate the effects of moving train on floor vibration. The measurements were taken when train D1001 was arriving and train D1012 was departing. Another case considered was the one when passengers were checking in at the gate to board the train. When passengers line up and check in, they tend to move in a synchronized pace and form very dense crowds, which may trigger significant floor vibration. Measurements of both train moving and passenger checking-in cases were taken in Section B, in particular, panel B1 as shown in Fig. 1, which was open for operation at the time of this study. Five sensors were installed near the stair and escalator opening of the floor to measure the vibration for these three cases. The locations of sensors are shown as points V1 to V5 in Fig. 4 below. Sixty-second records were taken for each measurement of operating cases.
Fig. 4Sensor locations for operating experiment cases
In order to investigate the effects of crowd size and crowd excitation frequency on the floor vibration, several experimental cases were conducted in Section D (Panels D1 and D2, see Fig. 1) of the concourse floor which was not open for operation at the time of this study. Experimental cases included crowd synchronized walking (in-situ) and crowd synchronized jumping. There were several cases of 96 people (12×8 array) and 30 people (6×5 array) walking in-situ at different paces (frequencies), and cases of 30 people (6×5 array) jumping at 2.5 Hz. Walking frequencies of 1.5 Hz, 2.0 Hz, 2.5 Hz, and 3.0 Hz were selected considering typical human walking frequency (between 1.5 Hz and 2.0 Hz) and its harmonic multiples that correspond to the fundamental frequencies of the floor (3.25 Hz for D1 and 3.70 Hz for D2). Experiment participants were located near the center of the floor panels with one-meter spacing in both ways and were instructed to follow the beats of a metronome (Fig. 5). Seven sensors were installed in the center of each panel to record the acceleration responses of the floor. Fig. 6 shows the approximate layout of the sensors, with points C1 to C7 on panel D1, and points C8 to C14 on panel D2. One hundred and twenty-second records were taken for each measurement of experimental cases. Peak accelerations were extracted from each record. Table 2 gives more details for all the measurement cases.
Fig. 5Scene of crowd walking and jumping experiments

Fig. 6Sensor layout for crowd walking and jumping experiments
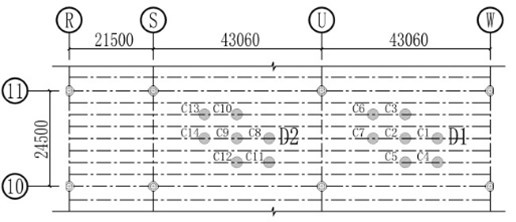
Table 2Field testing cases
Condition | Case label | Floor panel | Frequency (Hz) | Crowd size |
Train arriving | JZ | B1 | – | – |
Train departing | CZ | B1 | – | – |
Passenger checking-in | JP | B1 | – | – |
Crowd walking | BX-1.5 | D1, D2 | 1.5 | 12×8 |
BX-2.0 | 2.0 | |||
BX-2.5a | 2.5 | |||
BX-3.0a | 3.0 | |||
BX-2.5b | D1 | 2.5 | 6×5 | |
BX-3.0b | 3.0 | |||
Crowd jumping | TY-2.5 | D1, D2 | 2.5 | 6×5 |
3. Testing results
3.1. Results of operating cases
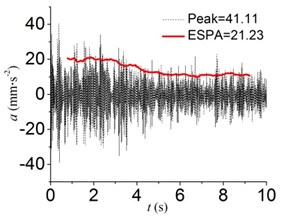
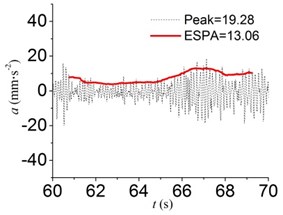
The peak accelerations measured during train arrival and departure are listed in Table 3. Shown in Fig. 7 are two sample acceleration records, both of which are the 10-second portions of the 60 second measured records that contain the peak accelerations. As shown in Table 3, the peak acceleration measured during train arrival was 41.11 mm/s2, while the peak acceleration measured during train departure was 19.28 mm/s2. Also marked in Fig. 7 are the Equivalent Sine Peak Acceleration (ESPA) values. In this study, the ESPA values were calculated as following [18]. First a rolling two-second root-mean-square (RMS) values were computed from measured records, then the computed RMS values were multiplied by square root of two () to get the ESPA values. The ESPA values eliminate the effect of spikes in the record, better reflecting the vibration magnitude from an energy content point of view. Maximum ESPA during train arriving was 21.23 mm/s2, and maximum ESPA during train departing was 13.06 mm/s2. It’s observed from the measured records that the peak acceleration values were higher during train arrival than those during train departure. This was attributed to two possible reasons. One is the relatively higher velocities and application of brakes when the train arrives compared to lower velocities of the departing train. The other is the fact that during train arriving there were passengers waiting at the gate for checking in and boarding, while the floor was near empty when the train was leaving. Part of the floor vibration may be caused by crowd activity. Overall, the measured peak accelerations did not exceed the 0.015 g (147.10 mm/s2) limit as stipulated in AISC Design Guide 11 [19] for shopping malls and indoor footbridges, hence it is unlikely to cause any passenger comfort concern during train arriving and departing the station. It is worth noting that at the time of this study, the station is the west terminal of the current high-speed rail line, therefore there was no passing trains. In the future, when the planned full line extends west, there may be trains passing by at high speed without stopping. The effects of the passing trains warrant further study in the future.
Table 3Maximum accelerations during train arriving, departing and passenger checking-in
Condition | Case label | Measurement No. | Peak acceleration (mm/s2) | ||||
V1 | V2 | V3 | V4 | V5 | |||
Train arriving | JZ | 1 | 29.01 | –* | 41.11 | 35.01 | –* |
Train departing | CZ | 1 | 11.56 | 15.55 | 19.28 | 5.58 | 2.29 |
Passenger checking-in | JP | 1 | 26.37 | 33.73 | 16.12 | 30.00 | 57.17 |
2 | 21.26 | 21.25 | 24.06 | 22.02 | 52.59 | ||
3 | 29.89 | 23.73 | 12.06 | 21.22 | 43.70 | ||
Note: * – Sensor malfunction | |||||||
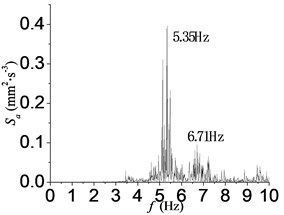
Shown in Fig. 8 are the power spectra of measured acceleration records during train arrival and departure. The first peak occurs between 5.0 Hz and 6.0 Hz, with the second peak between 6.5 Hz and 7.0 Hz. Both peak frequencies are greater than the natural frequencies of the floor structure. So, it’s not at the first harmonic resonance and the vibrations are likely to be moderate and within accepted limits.
Fig. 7Sample acceleration records during train arriving and departing
a) Train arriving
b) Train departing
Fig. 8Power spectra of measured accelerations during train arriving and departing
a) Train arriving
b) Train departing
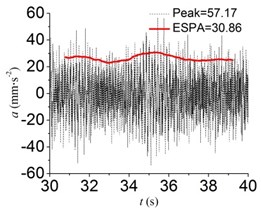
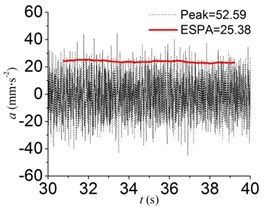
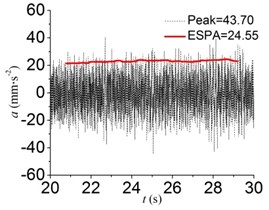
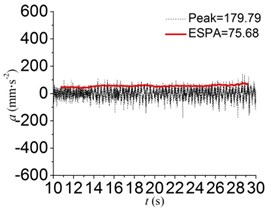
The density of crowds can reach 2 to 4 persons per square meter during passenger checking-in at the gate to board the train. Moreover, passengers are moving in the same direction at almost the same pace during this process. High density and synchronized movement may trigger high level floor vibration. Three measurements were recorded during passenger checking-in to study the floor vibration performance during this process. The peak accelerations measured are shown in Table 3. Three sample acceleration records are presented in Fig. 9. These are 10-second samples of the 60-second records that contain the maximum acceleration values. It can be seen from Table 3 that the maximum peak acceleration reached 57.17 mm/s2, and the average peak acceleration from three measurements was 51.15 mm/s2, which occurred at measurement point V5. The results indicate that although the large dense crowds move in the same direction at the same pace, the floor vibration response was low due to the low walking frequency. It can be seen from Fig. 9 that the maximum ESPA value was 30.86 mm/s2, and the average value from three measurements was 26.93 mm/s2. The peak acceleration values were below the recommended limit by AISC Design Guide 11 [19], so vibration during passenger checking-in will not cause comfort concern.
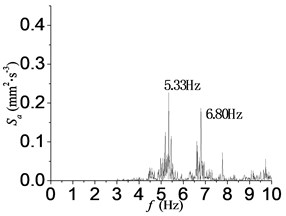
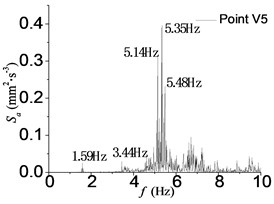
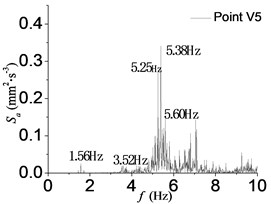
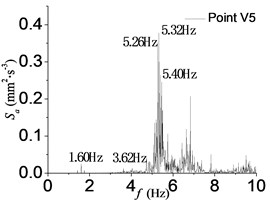
Shown in Fig. 10 are the power spectra of the acceleration records from three measurements at point V5. From these spectra it can be observed that: 1) Energy is concentrated at a narrow frequency band. 2) There is a spike around 1.6 Hz indicating the frequency at which passengers were walking. At the high density of 2 to 4 persons per square meter, crowd moved at a limited speed, and people cannot walk freely, rather at a synchronized pace, about 1.6 Hz. 3) High power spikes occur at frequencies around 3.5 Hz and 5.3 Hz. These frequencies correspond to the first and second modal frequencies of the floor and were also very close to multiples of the walking frequency of 1.6 Hz. So higher harmonic resonance may have occurred which explains the high power peaks in the spectra.
Fig. 9Sample acceleration records at measurement point V5 during passenger checking-in
a)
b)
c)
Fig. 10Power spectra of acceleration records during passenger checking-in
a)
b)
c)
3.2. Results of experimental cases
Experimental cases were conducted in Section D of the floor, in panels D1 and D2. The same sensor used at measurement points C7 and C14 had some connectivity issues, and the results from this sensor were deemed not reliable and were abandoned in subsequent analysis. Only results from sensors at points C1 to C6, and C8 to C13 were used. Two measurements were taken for each of the testing cases (except in panel D1 for Case BX-3.0b where only one measurement was taken). The results are summarized in Table 4 for panel D1 and Table 5 for panel D2.
Table 4Peak accelerations of floor panel D1 under crowd excitation
Case label | Measurement No. | Peak acceleration (mm/s2) | |||||
C1 | C2 | C3 | C4 | C5 | C6 | ||
BX-1.5 | 1 | 18.26 | 24.61 | 17.13 | 17.83 | 14.86 | 22.71 |
2 | 139.75 | 179.79 | 101.03 | 110.47 | 123.49 | 118.99 | |
BX-2.0 | 1 | 148.33 | 216.92 | 139.42 | 117.20 | 138.17 | 122.97 |
2 | 189.63 | 235.39 | 150.87 | 149.44 | 147.09 | 197.39 | |
BX-2.5a | 1 | 234.68 | 288.51 | 240.85 | 202.20 | 207.88 | 237.89 |
2 | 483.39 | 562.18 | 434.70 | 422.24 | 411.32 | 387.70 | |
BX-3.0a | 1 | 498.59 | 567.73 | 475.88 | 493.85 | 449.72 | 452.05 |
2 | 420.72 | 481.16 | 390.95 | 397.00 | 372.21 | 377.50 | |
BX-2.5b | 1 | 100.25 | 116.32 | 84.55 | 80.49 | 76.74 | 74.71 |
2 | 76.61 | 117.25 | 69.09 | 70.41 | 68.83 | 71.20 | |
BX-3.0b | 1 | 340.18 | 380.99 | 285.27 | 318.36 | 293.32 | 268.02 |
TY-2.5 | 1 | 195.86 | 254.65 | 197.64 | 165.53 | 180.83 | 169.26 |
2 | 197.00 | 231.25 | 191.05 | 157.44 | 144.25 | 182.11 | |
For most cases, maximum accelerations from two measurements were close to each other except Cases BX-1.5 and BX-2.5a in panel D1, and BX-2.5a and BX-3.0a in panel D2, in which one measurement was significantly greater than the other. This is attributed to the difficulties for the experiment participants to keep their paces and impact constant and synchronized. It can be observed from Tables 4 and 5 that, in general, with the increase of walking frequency, the floor acceleration response increases. In panel D1, the maximum acceleration increased from 179.79 mm/s2 at 1.5 Hz to 235.39 mm/s2 at 2.0 Hz, to 562.18 mm/s2 at 2.5 Hz, and 567.73 mm/s2 at 3.0 Hz, of the 96 person walking cases. In panel D2, the maximum acceleration increased from 87.69 mm/s2 at 1.5 Hz to 134.70 mm/s2 at 2.0 Hz, to 249.23 mm/s2 at 2.5 Hz, and 704.34 mm/s2 at 3.0 Hz. A larger sized crowd caused greater floor responses, which is apparent when comparing the maximum accelerations of Cases BX-2.5a and BX-3.0a (96 person cases) with those of BX-2.5b and BX-3.0b (30 person cases). The maximum acceleration of BX-2.5a was 562.18 mm/s2, while the maximum acceleration of BX-2.5b was 117.25 mm/s2, the maximum acceleration of BX-3.0a was 567.73 mm/s2 and that of BX-3.0b being 380.99 mm/s2.
Table 5Peak accelerations of floor panel D2 under crowd excitation
Case label | Measurement No. | Peak acceleration (mm/s2) | |||||
C8 | C9 | C10 | C11 | C12 | C13 | ||
BX-1.5 | 1 | 68.50 | 73.26 | 54.07 | 53.58 | 53.52 | 53.04 |
2 | 80.39 | 87.69 | 73.66 | 68.63 | 72.13 | 69.65 | |
BX-2.0 | 1 | 118.77 | 127.26 | 106.99 | 134.70 | 112.84 | 115.14 |
2 | 118.04 | 105.75 | 94.89 | 117.60 | 104.27 | 85.97 | |
BX-2.5a | 1 | 236.73 | 249.23 | 238.65 | 252.05 | 234.03 | 231.51 |
2 | 129.28 | 113.10 | 105.28 | 95.25 | 83.35 | 100.00 | |
BX-3.0a | 1 | 676.69 | 704.34 | 630.74 | 629.66 | 584.51 | 654.26 |
2 | 462.56 | 486.25 | 442.21 | 435.90 | 408.37 | 431.91 | |
TY-2.5 | 1 | 217.13 | 244.01 | 226.43 | 213.84 | 196.15 | 229.88 |
2 | 178.12 | 163.05 | 164.66 | 177.24 | 160.66 | 174.46 | |
The acceleration responses of panel D2 were smaller than those of panel D1 in all cases except BX-3.0a. It can be explained that the first mode frequency of D2 is 3.70 Hz which is farther away from the excitation frequencies compared to the first mode frequency 3.25 Hz of D1. Comparing results of Cases BX-2.5b and TY-2.5 in panel D1 it can be seen that at the same frequency, floor vibration responses were higher from jumping than those from walking, indicating the impact on the floor from people jumping is greater than the impact of walking.
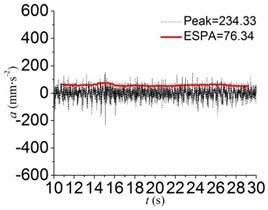
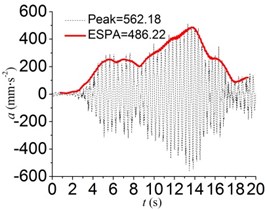
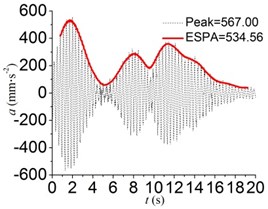
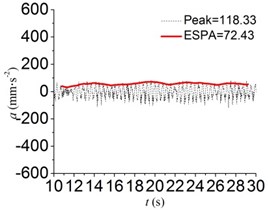
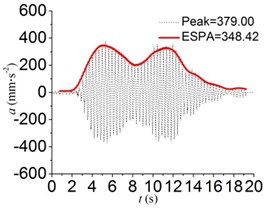
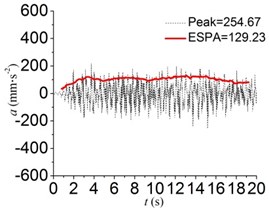
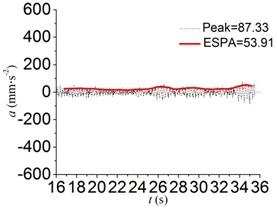
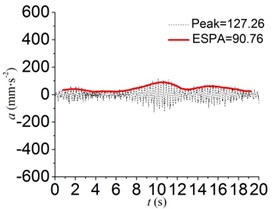
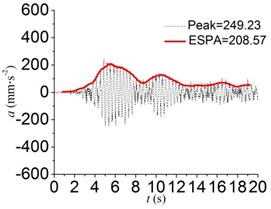
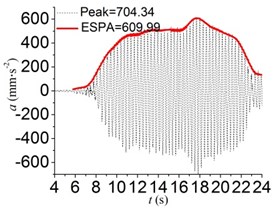
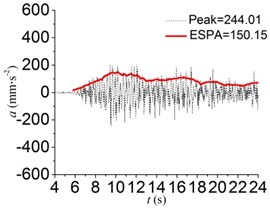
Fig. 11 shows sample records at measurement point C2 on panel D1 with ESPA marked on the plots, and Fig. 12 shows sample records at measurement point C9 on panel D2. Several observations can be made from these charts. 1) Under Cases BX-2.5a, BX-3.0a for both D1 and D2, BX-3.0b for D1, and TY-2.5 for D2, the maximum ESPA values exceeded recommended comfort limits by AISC Design Guide 11 [19] for indoor footbridges and shopping malls, which is 0.015 g (147.10 mm/s2). 2) As the excitation frequency approaches the first mode frequencies of the floor structure, resonance increases, and the difference between the maximum peak accelerations and ESPA values reduces accordingly. For instance, in panel D1 among the 96-person walking cases, as the walking frequency increases from 1.5 Hz to 3.0 Hz, the difference between maximum peak acceleration and ESPA decreases from 57.9 % (BX-1.5) to 5.8 % (BX-3.0a). It is regarded by the authors that ESPA values are a more reliable and meaningful index in floor vibration comfort level assessment compared to the peak acceleration values.
Comparing charts in Fig. 11(c) and 11(e), it can be found that when the floor was excited at the frequency of 2.5 Hz, the ESPA value reduced from 486.2 mm/s2 to 72.4 mm/s2 when the size of crowd changed from 96 people to 30 people. This 413.8 mm/s2 reduction indicated the large impact of crowd size at this frequency. On the other hand, at the excitation frequency of 3.0 Hz, as seen in charts of Fig. 11(d) and 11(f), the ESPA value reduced from 534.6 mm/s2 to 348.4 mm/s2 when size of the crowd changed from 96 people to 30 people, only a 186.2 mm/s2 reduction. At this frequency of 3.0 Hz, the size of crowd has a lesser impact to the floor vibration response. This can be explained by the apparent resonance shown in charts at the frequency of 3.0 Hz, since this excitation frequency is very close to the floor first mode frequency which is 3.25 Hz. It can be concluded that the floor vibration is more sensitive to the excitation frequency than to the crowd size.
Fig. 11Sample acceleration records at point C2 in panel D1
a) BX-1.5
b) BX-2.0
c) BX-2.5a
d) BX-3.0a
e) BX-2.5b
f) BX-3.0b
g) TY-2.5
Fig. 12Sample acceleration records at point C9 in panel D2
a) BX-1.5
b) BX-2.0
c) BX-2.5a
d) BX-3.0a
e) TY-2.5
Fig. 13Power spectra of acceleration records at point C2 in D1
a) BX-1.5
b) BX-2.0
c) BX-2.5a
d) BX-3.0a
e) BX-2.5b
f) BX-3.0b
g) TY-2.5
Fig. 14Power spectra of acceleration records at point C9 in D2
a) BX-1.5
b) BX-2.0
c) BX-2.5a
d) BX-3.0a
e) TY-2.5
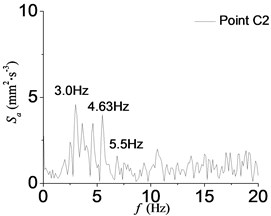
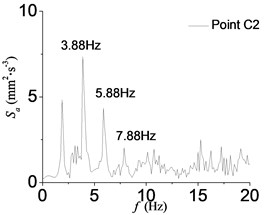
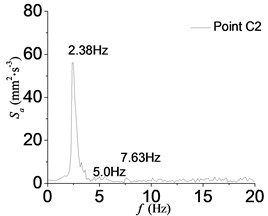
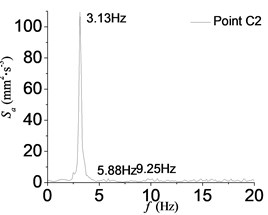
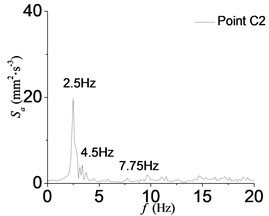
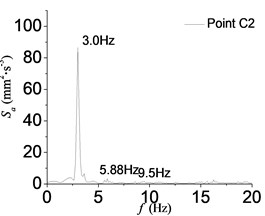
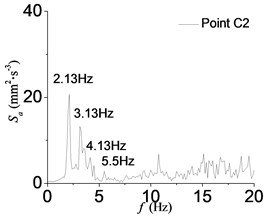
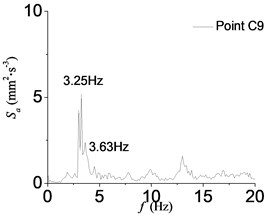
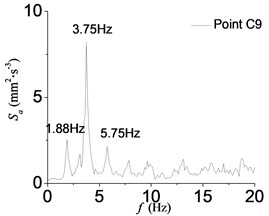
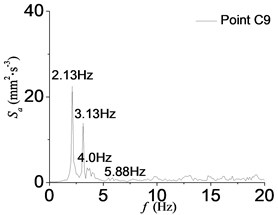
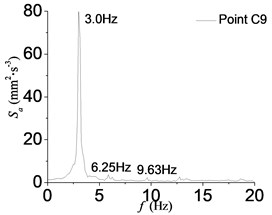
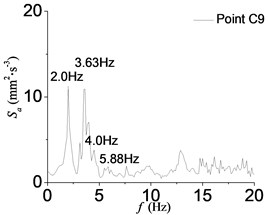
Shown in Fig. 13 and Fig. 14 are the power spectra of records at measurement point C2 in panel D1 and point C9 in panel D2, respectively. From both Figs. 13(a) and 14(a), it can be seen that at a slow pace (1.5 Hz), the floor vibration response spectra are wide band. This may be due to the difficulties that experiment participants had to follow the constant pace and to synchronize with the crowd at slow paces. As the walking frequency increased to 3.0 Hz, resonance was apparent from the spectra where a single peak was dominant. Comparing charts in Figs. 13(e) and 13(g), and charts in Figs. 14(c) and 14(e), it can be found that under the jumping cases, the second peak was more pronounced than that of the walking cases. This indicates that under jumping or aerobic activities, floor vibration responses will have more high mode components than under walking activities.
4. Conclusions
The study introduced in this paper focused on vibration behavior of a long-span floor structure in a newly constructed high-speed railway station in China. Both modal testing and field vibration measurement were conducted to investigate the dynamic properties and vibration performance of the floor structure. Below is a summary of the main findings of this study.
1) Ambient vibration (output only) method provides an effective and convenient way for modal testing of large scale long-span floor structures:
2) The long-span floor structures of the Xi’an North Railway Station have low natural frequencies and low damping ratios, with fundamental frequencies ranging between 3.25 Hz and 3.70 Hz, second mode frequencies ranging between 3.70 Hz and 4.20 Hz, and damping ratios ranging between 1.10 % and 1.74 %. The low frequencies and damping ratios make them sensitive to crowd-induced vibrations.
3) Field measurement results indicated the floor structures of the Xi’an North Railway Station performed satisfactorily and provided adequate comfort level to passengers regarding floor vibration, during train arrival, departure, and passenger checking-in processes. The maximum peak acceleration was 57.17 mm/s2, and the maximum ESPA value was 30.86 mm/s2. They are below the AISC Design Guide 11 limit (0.015 g) for shopping malls and indoor footbridges.
4) While both excitation frequency and crowd size influence the structural vibrational response, experiments revealed that excitation frequency has a greater impact on floor vibration than crowd size. When the excitation frequency approached the fundamental frequency of the floor structure, resonance was pronounced and floor vibration response increased significantly.
5) The type of human activities, e.g., walking or jumping, also affected the floor vibration response due to the different impact levels imposed on floor structures.
6) From power spectra of floor vibration responses, there are clearly peaks at the fundamental frequency of the structure and its low multiples. Hence resonance contributed significantly to floor vibration responses.
7) Equivalent Sine Peak Acceleration (ESPA) values better represent the nature of floor vibration responses, thus are a better index in structural vibration assessment.
Further analysis can be conducted based on refined and calibrated structural models once the crowd excitation function can be accurately described. Future study is needed to investigate the effects of passing trains to the structural vibration of the station buildings, the vibration transmission mechanism, and the vibration mitigation of the station buildings. There are other environmental factors that can have an impact on structural vibration of the station buildings, such as strong winds, since the structures may be partially exposed. As this type of long span floor structures are gaining popularity in high-speed rail stations and other applications, it is important that engineers understand the dynamic properties and the vibration performance of the floors, in order to design structures meeting serviceability requirements. The study reported in this paper greatly contributes to this understanding.
References
-
Chen X., et al. Design and analysis of the main building in Xi’an north railway station. Building Structures, Vol. 41, Issue 7, 2011, p. 31-39, (in Chinese).
-
Longinow A., Hannen W. R. Floor vibrations in buildings (structural design forum). Practice Periodical on Structural Design and Construction, Vol. 14, Issue 4, 2009, p. 143-145.
-
Setareh M. Vibration serviceability of a building floor structure. I: Dynamic testing and computer modeling. Journal of Performance of Constructed Facilities, Vol. 24, Issue 6, 2010, p. 497-507.
-
Setareh M. Vibration serviceability of a building floor structure. II: Vibration evaluation and assessment. Journal of Performance of Constructed Facilities, Vol. 24, Issue 6, 2010, p. 508-518.
-
Varela W. D., Battista R. C. Control of vibration induced by people walking on large span composite floor decks. Engineering Structures, Vol. 33, 2011, p. 2485-2494.
-
Au S. K., Ni Y. C., Zhang F. L., Lam H. F. Full-scale dynamic testing and modal identification of a coupled floor slab system. Engineering Structures, Vol. 37, 2012, p. 167-178.
-
Hanagan L. M., Murray T. M. Active control approach for reducing floor vibrations. Journal of Structural Engineering, Vol. 123, Issue 11, 1997, p. 1497-1505.
-
De Silva S. S., Thambiratnam D. P. Dynamic characteristics of steel-deck composite floors under human-induced loads. Computers and Structures, Vol. 87, 2009, p. 1067-1076.
-
Xia H., Zhang N., Cao Y. M. Experimental study of train-induced vibrations of environments and buildings. Journal of Sound and Vibration, Vol. 280, 2005, p. 1017-1029.
-
Schillemans L. Impact of sound and vibration of the North-South high-speed railway connection through the city of Antwerp Belgium. Journal of Sound and Vibration, Vol. 267, 2003, p. 637-649.
-
Degen K. G., Behr W., Grűtz H.-P. Investigations and results concerning railway-induced ground-borne vibrations in Germany. Journal of Sound and Vibration, Vol. 293, 2006, p. 865-872.
-
With C., Bodare A. Prediction of train-induced vibrations inside buildings using transfer functions. Soil Dynamics and Earthquake Engineering, Vol. 27, 2007, p. 93-98.
-
Sanayei M., Zhao N., Maurya P., et al. Prediction and mitigation of building floor vibrations using a blocking floor. Journal of Structural Engineering, American Society of Civil Engineers, Vol. 138, Issue 10, 2012, p. 1181-1192.
-
Sanayei M., Kayiparambil P., Moore J. A., Brett C. R. Measurement and prediction of train-induced vibrations in a full-scale building. Engineering Structures, Vol. 77, 2014, p. 119-128.
-
Ivanovic S. S., Trifunac M. D., Todorovaska M. I. Ambient vibration tests of structures – a review. ISET Journal of Earthquake Technology, Vol. 37, Issue 4, 2000, p. 165-197.
-
Zhang L., Tamura Y., Yoshida A., et al. Ambient vibration testing and modal identification of an office building. Proceedings of the 20th IMAC, Los Angeles, USA, 2002.
-
Schwarz B., Richardson M. Measurements required for displaying operating deflection shapes. Conference and Exposition on Structural Dynamics – Linking Test to Design, 2004.
-
Davis B., Liu D., Murray T. M. Solving floor vibration problems using dynamic analysis and testing. Proceedings of the Structures Congress, 2013, p. 1759-1766.
-
Murray T. M., Allen D. E., Ungar E. E. Floor Vibration Due to Human Activity, AISC Steel Design Guide Series 11. American Institute of Steel Construction, Chicago, 1997.
Cited by
About this article

The authors highly appreciate the sponsorship from the National Natural Science Foundation of China through the Project Crowd-Induced Stochastic Excitations on Long-Span Floor Structures of High-Speed Railway Stations and Their Vibration Control with MTMD (Project No. 51278106), and Jiangsu Science and Technology Department through Grant No. BY2016076-11. The authors are also grateful to the design engineers from Central-South Architectural Design Institute Co., Ltd. (CSADI) for their unselfish sharing of the design data and construction documents of the station. The authors would like to thank the management team of the station and all the volunteers in the field testing.
