Abstract
According to the vibration mechanism of ship gas turbine rolling element bearings common failure modes, the variation of the common indicators during the rolling element bearings health status degradation process is analyzed, and the reflection ability of the various indicators is studied based on the consistency and sensitivity. The results show that the Root-Mean-Square value, Peak-Peak value, Wavelet Energy Spectrum Entropy and Singular Spectrum Entropy can effectively reflect the health state change of rolling element bearings.
1. Introduction
There are so many rolling element Bearings in the ship gas turbine system, which is the most prone failure device. Gas turbine system working in bad and complex force conditions, with a long time running, the health status of rolling element bearings will gradually degenerate, which may lead to serious accidents, resulting in significant economic losses, and even endanger personnel safety. Therefore, it is necessary to study the health status indicators of rolling element bearings, in order to supporting the ship gas turbine health status assessment [1].
During the operation of the rolling element bearings, its health condition will gradually degenerate until failure, such as fracture, fatigue, wear, corrosion and so on. Degradation of the state of health of the rolling element bearings not only results in increased vibrations, but also severely damages the equipment. During the gradual degradation of the rolling element bearings health state, the vibration intensity of the rolling element bearings will gradually increase, the frequency of the bearing failure characteristic frequency will gradually appear on the frequency spectrum, at the same time, harmonics and side bands will also appear. In addition, if a crack or dent occurs in the bearing outer ring or the inner ring, it will also cause an impulse response at the rotational frequency of the outer ring or the inner ring.
Through the analysis of the common failure modes of rolling element bearings, it can be found that with the continuous operation of rolling element bearings, the crossovers and deteriorations of multiple faults often accompany, resulting in more severe vibration of the monitoring signals and more complicated spectrum distribution. If only focus on the perspective of fault feature frequency, researching the health indicators of rolling element bearings often fails to meet the requirements that effectively reflect the changes in the rolling element bearings health state. At present, how to extract valid characteristics of rolling element bearings health indicators has become a key issue [2].
2. Health state indicators analysis
In order to characterize the health status of rolling element bearings, the commonly used condition indicators are [3]:
(1) Root mean square (RMS):
(2) Peak-peak value (P-P):
(3) Shape factor (SF):
(4) Crest factor (CF):
(5) Impulse factor (IF):
(6) Clearance factor (CLF):
(7) Wavelet energy spectrum entropy (WESE).
The wavelet transform is used to decompose the original signal into components on each scale and calculate its energy value , which is called the wavelet energy spectrum. It represents the division of the original signal in the time-frequency domain space and can define the wavelet. The energy spectrum entropy is:
(8) Singular spectral entropy (SSE).
For a time sequence , the signal is mapped into the embedding space in conjunction with the delay embedding technique. If the length of the space is set to , a row column trajectory matrix can be obtained, which is:
At this time, singular value decomposition is performed on the matrix , and singular values of the decomposition result are calculated, i.e., so the singular spectrum of the signal is composed of . Assuming that there are non-zero singular values, reflects the number of different modes in the column of matrix . The singular spectrum represents a division of the signal in the time domain. Therefore, the singular spectral entropy of the signal in the time domain can be defined as:
Singular spectral entropy reflects the distribution of signal vibration energy under singular spectral division, and also reflects the time domain complexity of signal energy distribution. If the signal energy distribution is more concentrated, the singular value decomposition results are more concentrated, and the calculated value is smaller; if the signal energy distribution is more dispersed, the singular value decomposition results are more dispersed, and the obtained is larger. So, the singular spectral entropy reflects the complexity of the energy distribution of the singular components of the signal.
During the degradation of the rolling element bearings health state, the vibration energy will change, and an impact signal will also appear. The RMS value characterizes the magnitude of the vibration energy. The Crest Factor and Impulse Factor characterize the impact energy of the signal and can better reflect the change of health status. Spectral kurtosis can reflect the strength of transient shock, but also can indicate the change of frequency spectrum. It can also be used to reflect the change of health status of rolling element bearings. The wavelet energy spectrum entropy and the singular spectral entropy provide an overall comprehensive assessment of the signal from a certain spatial domain. The evaluation results are dimensionless and have nothing to do with the strength of the signal. These characteristics can just meet the indicator requirements of the rolling element bearings health state assessment.
3. Experimental analysis of rolling element bearings health status indicators
3.1. Rolling element bearing experiment
There are a large number of rolling bearings in ship propulsion systems, and rolling bearings are more prone to failure. Taking the rolling bearing as the research object, the ability of each index to reflect the life cycle health state degradation of the rolling bearing was studied. The life-cycle test data of the rolling bearing carried out by the NSF I/UCR Center of the United States and the installation position of the accelerating fatigue test device and the sensor of the rolling bearing are shown in Fig. 1. The test device is mainly composed of the AC motor, the drive shaft and the four rolling bearings on the shaft. Eight acceleration and four thermocouples sensors were placed on the respective rolling bearings for vibration signal and temperature signal monitoring, and 6000 pounds of radial load was added to bearings 2 and 3 [4, 5]. The rolling bearings used in the experiment were all Rexnord ZA-2115 double row bearings. Each row of the bearings consisted of 16 rollers. The diameter of the bearing pitch circle was 71.50 mm, the roller diameter was 8.41 mm, and the contact angle was 15.171°. The full life cycle test keeps the system running until the rolling bearing has suffered serious damage.
3.2. Rolling element bearing experimental data analysis
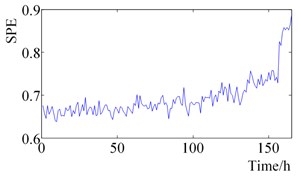
Excellent state indicators not only need to have a better sensitivity to the health status of rolling element bearings, but also to keep their trends consistent with their health status degradation process, thus effectively characterizing the health of rolling element bearings degradation. In the whole life cycle of rolling element bearings during the operation, respectively, the study of the changes in conventional indicators, as shown in Fig. 2.
Fig. 1Rolling element bearings accelerated fatigue test device
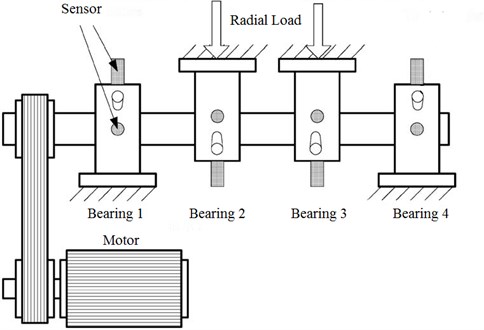
Fig. 2Rolling bearings status indicators changes during the full life time
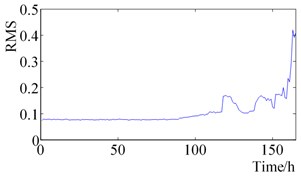
a) RMS
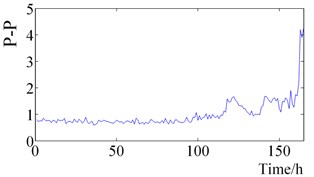
b) Peak-Peak value
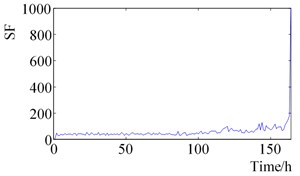
c) Shape factor
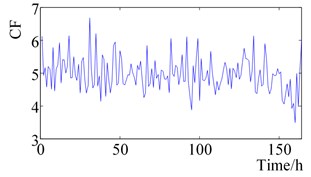
d) Crest factor
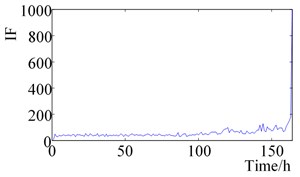
e) Impulse factor
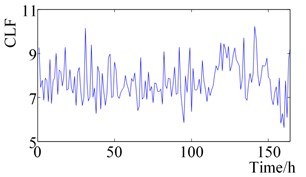
f) Clearance factor
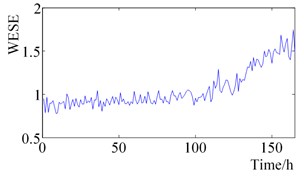
g) Wavelet energy spectrum entropy
h) Singular spectral entropy
It can be seen from Fig. 2. that the RMS value and Peak-peak value increase slightly at 120 h, then remains stable until it increases slightly after 120 h, and finally increases sharply near the time of failure. Shape Factor and Impulse Factor, pre-are more stable, after 150 h began to fluctuate slightly, the final failure of a sharp increase. The Crest Factor and Clearance Factor fluctuated before 160 h, and fluctuated violently after 160 h, which reflected the change of rolling element bearing health status more than Shape Factor and Impulse Factor. Wavelet Energy Spectrum Entropy and Singular Spectrum Entropy change smooth in the bearing normal state before 100 h, and increase gradually between 100 h to 150 h, which are consistent with the change of the bearing health state.
3.3. Analysis of experimental results
According to the analysis of the changes of the indicators during rolling element bearing health status degradation process, the reflectivity of each index can be found based on the consistency and sensitivity:
(1) Peak-peak value and Root-Mean-Square value can reflect the normal status, rapid degradation and eventual failure. The RMS value is better than Peak-peak value in the stability.
(2) Shape Factor, the Crest Factor and the Impulse Factor do not reflect the initial degradation, which couldn’t effectively reflect the failure occurrence and status degradation.
(3) Wavelet Energy Spectrum Entropy and Singular Spectral Entropy can be used to characterize the change of health state of rolling element bearing. The change of indicators has a good consistency with the degradation process.
4. Conclusions
Based on the study of the common failure mode of rolling element bearing, the changes of many kinds of status indictors in the rolling element bearing health degradation process are analyzed theoretically. Through analyzing the indictors’ changes in the rolling element bearing in the rolling element bearing state degradation process, the reflectivity of each index is studied based on the consistency and sensitivity. It is found that the Root-Mean-Square value, Peak-Peak value, Wavelet Energy Spectrum Entropy and Singular Spectrum Entropy are more sensitive to the change of rolling element bearing health state. But wide fluctuations could happen in a single indicator during health degradation process, affecting the reliability of the assessment results. It is need to study the combination of a variety of indicators, take the advantage of multiple indicators to reflect the degree of health status deterioration.
References
-
Liu T., Zhu K., Zeng L. Diagnosis and prognosis of degradation process via hidden semi-Markov model. IEEE/ASME Transactions on Mechatronics, Vol. 23, Issue 3, 2018, p. 1456-1466.
-
Liu Q., Dong M., Peng Y. A novel method for online health prognosis of equipment based on hidden semi-Markov model using sequential Monte Carlo methods. Mechanical Systems and Signal Processing, Vol. 32, 2012, p. 331-348.
-
Ma M., Sun C., Chen X. Discriminative deep belief networks with ant colony optimization for health status assessment of machine. IEEE Transactions on Instrumentation and Measurement, Vol. 66, Issue 12, 2017, p. 3115-3125.
-
Singh J., Darpe A. K., Singh S. P. Bearing damage assessment using Jensen-Rényi divergence based on EEMD. Mechanical Systems and Signal Processing, Vol. 87, 2017, p. 307-339.
-
Gao Y., Xie N., Hu K., et al. An optimized clustering approach using simulated annealing algorithm with HMM coordination for rolling elements bearings’ diagnosis. Journal of Failure Analysis and Prevention, Vol. 17, Issue 3, 2017, p. 602-619.
-
Nectoux P., Gouriveau R., Medjaher K., et al. PRONOSTIA: An experimental platform for bearings accelerated degradation tests. IEEE International Conference on Prognostics and Health Management, 2012.
-
Sutrisno E., Oh H., Vasan A. S. S., et al. Estimation of remaining useful life of ball bearings using data driven methodologies. IEEE Conference on Prognostics and Health Management (PHM), 2012.
About this article

This work was supported by the National Natural Science Foundation of China (NSFC) under Grant No. 61703385.
