Abstract
. Reinforced concrete tanks are currently used to store various substances and products. Most often they serve as drinking water reservoirs, to sewage treatment or to store various technical fluids. Although rectangular tanks are less used, they have advantages, such as less sensitivity to one-sided loading and better utilization of space when using a group of tanks. Rectangular tank which is the matter of interest in this paper is for the purposes of analysis considered as fulfilled with water. Dynamic analysis of the tank considering fluid-structure interaction (FSI) was the matter of interest here. Deformations and bending moments of walls were obtained.
1. Introduction
To solve tasks related with continuum mechanics, three numerical methods are currently used (finite element method, finite band method and boundary element method). The finite element method (FEM) is the most widely used method thanks to the development in the field of computer programming. The FEM is based on variational principles. Software ANSYS Academic was used to solve tasks included in this paper.
In this paper rectangular concrete tank was modelled included water filling. Interaction between the fluid and tank was also considered in the calculation. The subsoil category C was chosen to include subsoil effects in FSI analysis [1, 2]. According to STN EN 1998-1 [2], in each area of Slovakia, the values of basic seismic acceleration are defined ( 0,40 m/s2, 0,63 m/s2, 0,86 m/s2, 1,10 m/s2).
A response spectrum method was used to obtain results from the dynamic loading of the tank. From the obtained results, the most interesting variables are deformation of the tank and bending moments of the tank walls.
2. Response spectra method
The response spectra method is described in detail in [1]. This method is very often used for the tasks considering seismic load.
An integral part of response spectra method is the modal analysis where natural frequencies () and mode shapes are calculated. For a given direction of excitation (, , ), the participation factor of each mode shape (1) is calculated. It expresses the contribution of each mode shape to individual global directions of excitation:
where – normalised th mode shape, – mass matrix, – vector describing the direction of excitation.
To calculate the modal factor () we proceed with the relation Eq. (2). Subsequently, according to the relationships given in the EN standard [2], the corresponding acceleration () can be calculated for each mode shape and its corresponding frequency:
In the listed example, 2 directions of construction excitation were used in the and directions. The results of the modal analysis are listed in the Chapter 1.3. and results of spectral analysis are listed in the Chapter 1.4.
2.1. Model of the tank
The reservoir itself was modelled as rectangular, with the ground plan dimensions of 11 m×7,5 m and height of 4,5 m. Wall thickness is 200 mm and thickness of the bottom slab is 500 mm. The water column reaches a height of 4 m. The whole tank is on the ground surface (overground tank) and it is modelled as reinforced concrete structure with properties of the C25/30 concrete ( 31 GPa). Foundation slab is considered as bonded to the subsoil in the level of the terrain.
To take into account the interaction of the structure and the liquid filling, there were inserted the intermediate elements (CONTAC52 Fig. 1(c)) between the tank walls (SHELL181 Fig. 1(a)) and fluid elements (FLUID80 – Fig. 1(b)). Mentioned intermediate element (CONTAC52) takes into account the FSI effects. References [3-5] and [6] are also dealing with the interaction of structure and subsoil.
Fig. 1a) Rectangular 3D shell element SHELL181 [7], b) fluid 3D element FLUID80 [7], c) contact element CONTAC52 [7]
![a) Rectangular 3D shell element SHELL181 [7], b) fluid 3D element FLUID80 [7], c) contact element CONTAC52 [7]](https://static-01.extrica.com/articles/20657/20657-img1.jpg)
a)
![a) Rectangular 3D shell element SHELL181 [7], b) fluid 3D element FLUID80 [7], c) contact element CONTAC52 [7]](https://static-01.extrica.com/articles/20657/20657-img2.jpg)
b)
![a) Rectangular 3D shell element SHELL181 [7], b) fluid 3D element FLUID80 [7], c) contact element CONTAC52 [7]](https://static-01.extrica.com/articles/20657/20657-img3.jpg)
c)
One of the response spectra used in the calculation is shown in Fig. 2. This is the response spectrum corresponding to the subsoil category C, area with seismic acceleration 1.10 m/s2.
3. Results of the modal analysis
By the modal analysis, mode shapes, natural frequencies and participation factors were obtained.
It was necessary to separate mode shapes, where only the water excites from the global shapes, where the tank structure excites together with filling. In the Fig. 3. and Fig. 4. first two mode shapes corresponding to global excitation of the structure + filling are shown. In Table 1, natural frequency and participatory factor are listed for 6 global mode shapes.
Fig. 2Response spectrum – type of spectrum 1
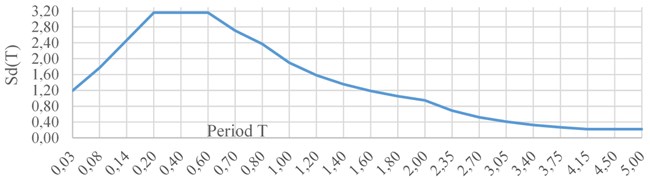
Fig. 3Mode shape No. 1 (f= 5,920 Hz, γ= 4,42)
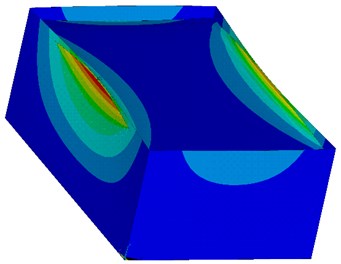
Fig. 4Mode shape No. 2 (f= 6,216 Hz, γ= 10,68)
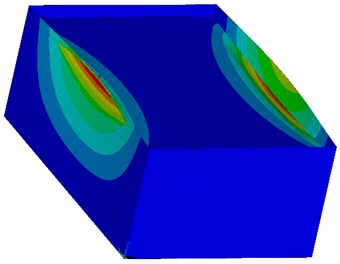
Table 1Natural frequencies and participation factors corresponding to global mode shapes
Mode shape no. | Frequency | Participation factor | Direction |
1 | 5,920 Hz | 4,42 | |
2 | 6,216 Hz | 10,68 | |
3 | 8,699 Hz | 8,51 | |
4 | 9,039 Hz | 5,77 | |
5 | 12,133 Hz | 0,00 | – |
6 | 12,475 Hz | 4,60 |
4. Results of spectral analysis
After the modal analysis, spectral analysis follows. The object of spectral analysis is to obtain effect of seismic load on analysed structure. Response spectrum was chosen as a type 1 (Fig. 2), which parameters such as distance of seismic epicentre from the structure are listed in [2].
The calculation was performed for all four seismic areas in Slovakia. In each area, the values of basic seismic acceleration are different ( 0,40 m/s2, 0,63 m/s2, 0,86 m/s2, 1,10 m/s2).
The results are summarized in Tables 2 and 3.
Table 2Results corresponding to excitation of structure in the direction of x-axis
[m/s2] | [mm] | [mm] | [mm] | [kNm/m] | [kNm/m] |
0,40 | 1,741 | 0,229 | 2,833 | 5,297 | 10,192 |
0,63 | 2,741 | 0,360 | 4,461 | 8,340 | 16,049 |
0,86 | 3,740 | 0,492 | 6,088 | 11,382 | 21,902 |
1,10 | 4,785 | 0,629 | 7,789 | 14,561 | 28,021 |
For the location where the basic seismic acceleration is 1,10 m/s2 (Fig. 2) and the seismic excitation is in the direction of -axis, there are deformations of the tank and bending moments of the tank wall shown in the Fig. 5-Fig. 8. Other variables and values are listed in the Table 2.
Fig. 5Deformation in the direction of x-axis by seismic excitation in the direction of x-axis with the maximum value 4,785 mm (red surface)
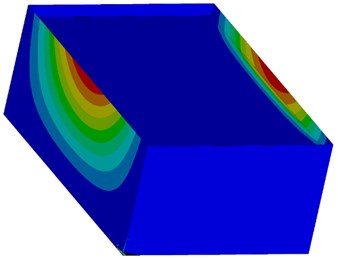
Fig. 6Deformation in the direction of y-axis by seismic excitation in the direction of x-axis with the maximum value 0,629 mm (yellow surface)
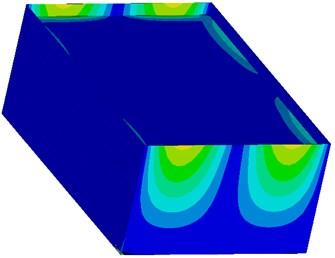
In the deformation figures, it can be seen that if the load is applied in the direction of -axis, a deformation in the form of simple wave arises on the walls in the direction of this action (shorter walls). On the other hand, deformation of the perpendicular walls with respect to the load direction (longer walls) takes the form of the half-wave.
Fig. 7Bending moments mx as a result of seismic excitation in the direction of x-axis with the maximum value 14,561 kNm/m (red surface)
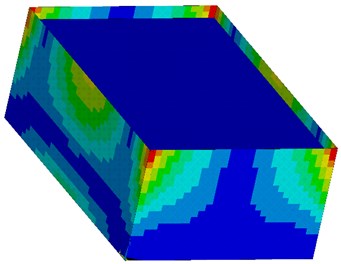
Fig. 8Bending moments my as a result of seismic excitation in the direction of x-axis with the maximum value 28,021 kNm/m (red surface)
Based on the figures of bending moments of tank walls it is noteworthy to say that if the load is applied in the direction of -axis then maximum bending moment is in middle of the bottom edge (near clamp) of the walls which are perpendicular to the load direction (longer walls). Maximum bending moment is in the top corners of the tank.
Table 3Results corresponding to excitation of structure in the direction of y-axis
[m/s2] | [mm] | [mm] | [mm] | [kNm/m] | [kNm/m] |
0,40 | 0,275 | 0,780 | 1,296 | 3,241 | 5,976 |
0,63 | 0,434 | 1,229 | 2,041 | 5,104 | 9,411 |
0,86 | 0,592 | 1,677 | 2,785 | 6,965 | 12,842 |
1,10 | 0,757 | 2,145 | 3,563 | 8,911 | 16,430 |
For the location where the basic seismic acceleration is 1,10 m/s2 (Fig. 2) and the seismic excitation is in the direction of -axis, there are deformations of the tank and bending moments of the tank wall shown in the Fig. 9-Fig. 12. Other variables and values are listed in the Table 3.
In the deformation figures, it can be seen that if the load is applied in the direction of -axis, a deformation in the form of simple wave arises on the walls in the direction of this action (longer walls). On the other hand, deformation of the perpendicular walls with respect to the load direction (shorter walls) takes the form of the half-wave.
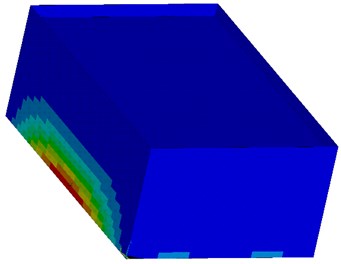
Fig. 9Deformation in the direction of x-axis by seismic excitation in the direction of y-axis with the maximum value 0,757 mm (red surface)
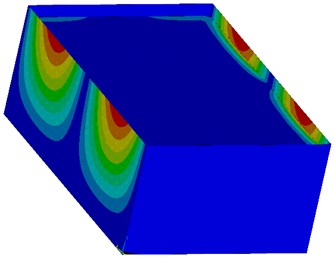
Fig. 10Deformation in the direction of y-axis by seismic excitation in the direction of y-axis with the maximum value 2,145 mm (red surface)
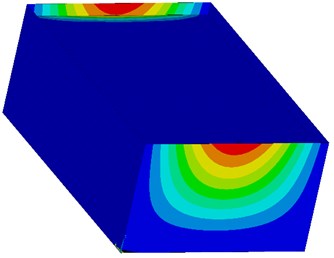
Fig. 11Bending moments mx as a result of seismic excitation in the direction of y-axis with the maximum value 8,911 kNm/m (red surface)
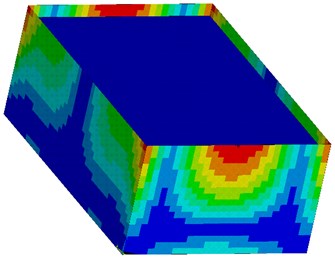
Fig. 12Bending moments my as a result of seismic excitation in the direction of y-axis with the maximum value 16,430 kNm/m (red surface)
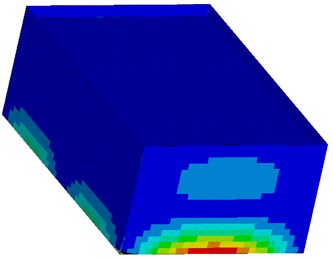
Based on the figures of bending moments of tank walls it is noteworthy to say that if the load is applied in the direction of -axis then maximum bending moment is in middle of the bottom edge (near clamp) of the walls which are perpendicular to the load direction (shorter walls). Maximum bending moment is in the middle of the top edge of shorter walls of the tank.
5. Conclusions
In situations where a liquid filling is a part of the structure, it should be taken into account in the analyses not only as a static load. It is appropriate to use 3D modelling with consideration of interaction between the structure and the liquid.
In dynamic analysis, modal analysis where mode shapes and natural frequencies are calculated in prior to spectral analysis. Subsequently, the location and subsoil parameters of the structure must be known. The higher the subsoil category, or the seismic acceleration value, the greater the effects of seismic load on the structure itself.
References
-
Sokol M., Tvrdá K. Dynamics of Structures. Slovak University of Technology, Bratislava, 2011, p. 212.
-
STN EN 1998-1 Eurocode 8: Design of Structures for Earthquake Resistance. Part 1: General Rules, Seismic Actions and Rules for Buildings (STN 73 0036). SÚTN, Bratislava, 2005, p. 229 + NA/Z2.
-
Kotrasová K., Kormaníková E. A case study on seismic behavior of rectangular tanks considering fluid-structure interaction. International Journal of Mechanics, Vol. 10, 2016, p. 242-252.
-
Kotrasová K., Kormaníková E. Effect of fluid in the moving container. Journal of Numerical analysis, Industrial and Applied Mathematics, Vol. 1, 2006, p. 1-9.
-
Kotrasová K., Harabinová S., Panulinová E., Kormaníková E. Seismic analysis of cylindrical liquid storage tanks considering of fluid-structure-soil interaction. Advances and Trends in Engineering Sciences and Technologies Proceedings of the International Conference on Engineering Sciences and Technologies, 2016, p. 87-92.
-
Kala J., Salajka V., Hradil P. Response of water tower on wind induced vibration considering interaction of fluid and structure. 2nd International Conference on Engineering and Technology Innovation, Taiwan, 2012.
-
ANSYS Help, Theory Reference for the Mechanical APDL and Mechanical Applications. ANSYS manual.
About this article

This paper was supported by Grant Agency VEGA, project No. 1/0412/18.
