Abstract
Fault diagnosis of rope tension is of great significance for safety in hoisting systems. A novel diagnosis method based on the vibration signals of the head sheaves is proposed. First, the signal is decomposed by the ensemble empirical mode decomposition (EEMD); then the main intrinsic module functions (IMFs) are extracted by correlation analysis. Second, the energy and the permutation entropy (PE) of the main IMFs were calculated to create the feature vector. Third, a particle swarm optimization - support vector machine (PSO-SVM) is applied to classify tension states. The effectiveness and advantage of the proposed method are validated by experiments. Compared with the conventional force-sensor-based method, it has clear advantages in sensor installation, data transmission, safety, and reliability.
Highlights
- A novel diagnosis method of rope tension based on vibration sensors instead of the conventional force sensors in hoisting systems is proposed.
- EEMD, permutation entropy, PSO-SVM were applied for decomposition, feature extraction, and classification of the vibration signal, respectively.
- The effectiveness of the proposed method was validated by experiments.
1. Introduction
Hoisting equipment is widely used in industry, especially the mining industry. A mine hoist is a key device to transport ore, materials, and people between the surface and underground. Fault diagnosis of rope tension is of great significance to hoisting safety because lifting containers are connected with winding drums by long wire ropes [1]. Conventional fault detection methods are based on force sensors that are installed at the connection parts of the ropes and the containers. However, it faces some problems as follows: first, the sensor installation may affect the safety of the original structure [2]. Second, data transmission and power supply are quite inconvenient in moving containers. Third, the reliability and life of the measuring devices are low because of the harsh underground environment with spray water, dust, and corrosive gas. In this paper, a novel fault diagnosis method for the rope tension based on vibration signals is proposed.
Vibration signal processing usually contains signal decomposition, feature extraction, and classification. The Fourier transform (FT), wavelet transform (WT), and empirical mode decomposition (EMD) methods are commonly used in decomposition [3]. However, the FT is not suitable for non-stationary signals. Although the WT can decompose a non-stationary signal into a set of basis functions, the selection of the key wavelet base and decomposition level relies on the user’s experience seriously [4]. The EMD can self-adaptively decompose any signal into a set of intrinsic module functions (IMFs) with different frequency characteristics [5]. To improve the drawback of mode mixing in the EMD method, the ensemble empirical mode decomposition (EEMD) was proposed [6]. Because of the easy-using and excellent performance for complex signals, the EMD-based methods have been widely applied in fault diagnosis [7].
Feature extraction plays a significant role in fault diagnosis. Abnormal states usually cause dynamic changes, which can be described from perspectives of energy and entropy. The permutation entropy (PE) [8] is a powerful tool to measure the complexity of time series, which has advantages of simple calculation and robustness to noise [9].
In pattern recognition, support vector machine (SVM), neural network (NN) are attractive [10-12]. The NN needs a large number of training samples, which is almost impossible in real mine hoists. The SVM has the advantage to solve small-sample learning problems because it is based on the structural risk minimization instead of the experiential risk minimization. However, the penalty parameter and the kernel parameter have a great influence on the classification accuracy. To improve the classification accuracy, some optimization algorithms, such as the genetic algorithm (GA) and the particle swarm optimization (PSO) algorithm have been used to optimize the parameters. Compared with the GA, the PSO is simpler to implement [13].
In this paper, a fault diagnosis method for rope tension based on the vibration signal of the head sheave is proposed, which combines the EEMD decomposition, the feature extraction by PE and energy, and the PSO-SVM classification. The remainder of this article is organized as follows: Section 2 introduces the theoretical basis and the proposed method. Section 3 presents experiments and discussions. Section 4 provides the conclusion.
2. Theoretical basis
2.1. EEMD
The EMD method proposed by Huang can adaptively decompose a complex signal into several IMFs and a residue then the signal is described as: . However, the EMD method has the disadvantage of mode mixing. The EEMD method is proposed to overcome this problem, which is executed as follows:
1. Add white noise to the original signal.
2. Decompose the noise-added signal into IMFs by the EMD method.
3. Repeat steps 1-2 with different white noises each time.
4. Calculate the ensemble mean value of each IMF as the final IMF.
2.2. Permutation entropy
The PE was proposed by Bandt and Pompe to analyze the complexity of a time series. For a time series , the PE is calculated as the following steps.
1. Sequence reconstruction. The time series is converted into a multi-dimensional vector: where is the embedding dimension and is the delay factor.
2. Sorting. Each sequence in the embedding vector is rearranged in ascending order as: , and the rank is the permutation of the , marked as .
3. Probability and entropy calculation. The relative frequency of the is calculated as:
The PE is defined as: .
The time lag and the embedding dimension are recommended to be 1 and 3-7, respectively [8].
2.3. PSO-SVM
SVM is a very useful technique for data classification and regression problems. The penalty parameter and the kernel parameter have a large influence in the SVM with Gaussian kernel. The PSO method is employed to optimize the parameters as follows [14]:
1. Initialize the particles () and the iterative time .
2. Calculate the objective function value of the particle using the SVM training algorithm.
3. Calculate the optimal historical values of the individual and the population.
4. Update the particle velocity and position according to the speed and position update equations.
5. If the iterative time is satisfied, output the optimal parameters; otherwise, go back to step 3.
2.4. The proposed method to diagnose rope tension fault
The steps of the proposed method to diagnose rope tension faults are as follows:
1. Decompose the transverse vibration signal of the head sheave into IMFs by the EEMD.
2. Calculate the correlation coefficient between each IMF and the original signal; then extract the IMFs whose correlation coefficients are larger than a defined threshold as the main IMFs.
3. Calculate the energy and the PE of the main IMFs to create the feature vector.
4. Train the PSO-SVM model based on the vibration samples in different tension states.
5. Use the trained SVM model to diagnose the rope tension faults in practice.
3. Experiment study and discussions
3.1. Experiment setup
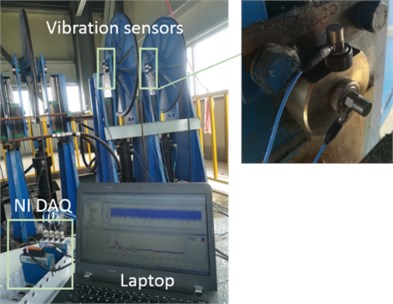
Tension states of a single rope contain overload, underload, and normal ones. The overload or underload faults may lead to a rope break or slack, respectively, which cause hoisting accidents. The experiment platform is a two-rope winding hoist with a height of 36 m, the schematic diagram of which is shown in Fig. 1. The experiment was performed on the two ropes of the right container. The vibration signals were obtained from the head sheave shafts because the noise and interference are small at the head sheave platform without power devices. The schematic diagram and photos of the data acquisition system are shown in Fig. 1 and Fig. 2, respectively. PCB vibration sensors were attached to the end faces of the head sheave shafts. Tension sensors were installed between the container and the two hoisting ropes. The vibration and tension signals were acquired by two NI cDAQ devices, respectively; then the data were transmitted to the laptop with LabVIEW software by wire and wireless communications, respectively. The sampling frequency was set 1024 Hz. The normal, overload, underload tension states of the rope were set to be 4900, 5600, 4200 N, respectively, by adjusting the weight of iron blocks in the container. 52 samples with a length of 1 s were obtained in each state, which is a small-sample problem as in engineering.
Fig. 1Schematic diagram of the experiment platform
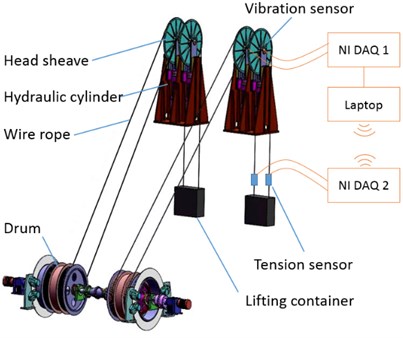
Fig. 2Photo of the data acquisition system
3.2. Processing
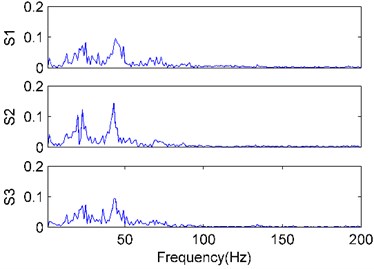
The vibration signal samples in the three states are shown in Fig. 3, in which S1, S2, and S3 are the overloaded, normal, and underloaded, respectively. The frequencies of the signals were obtained by the FFT, as shown in Fig. 4. It can be seen that the signals are complex and non-stationary, indicating it’s difficult to classify them based on the waves and the spectrums. That’s because the rope vibration has many natural frequencies, and a lot of interferences exist, such as wind.
Fig. 3The waves of the vibration signals
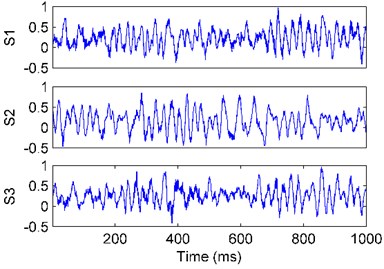
Fig. 4The FFT spectrums of the vibration signals
The signals were decomposed using the EEMD method, in which the amplitude of the added white noise was set to 0.2 times the standard deviation of the investigated signal, and the number of the ensembles was set to 50 [7]. The S2 sample was used as an example, shown in Fig. 5(a). As a comparison, the EMD is also applied, of which the result is shown in Fig. 5(b). The frequencies of the IMF 1-5 composed by the EEMD and EMD were shown in Fig. 6.
Fig. 5The decomposition results of the vibration signal
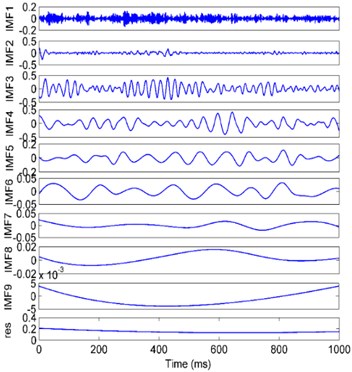
a) EEMD
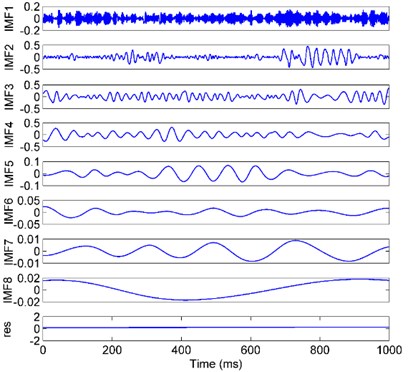
b) EMD
It can be seen that the complicated signal is effectively decomposed into sample components from high frequency to low frequency by both the EMD and the EEMD. However, in the EEMD result, the frequency of each IMF is more concentrated, and the frequencies between adjacent IMFs are more separate, especially in IMF2 and IMF3. That means that the mode mixing was improved by the EEMD approach effectively.
The correlation coefficients between the IMFs and the original signal were calculated and the IMF 1-5 were selected to be the main IMFs with a threshold of 0.4. The PE and energy (EN) of the main IMFs were calculated to create the feature vector. 20 samples in each state were randomly selected to be the test samples. The “one-against-one” SVM was adopted for the multi-classification here. The PSO method was used to optimize the () parameters. The 5-fold cross-validation technique was used to improve the classification accuracy in the small sample problem. Other features and classifiers were also employed as comparisons.
Fig. 6The FFT spectrums of the decomposition results of the vibration signal
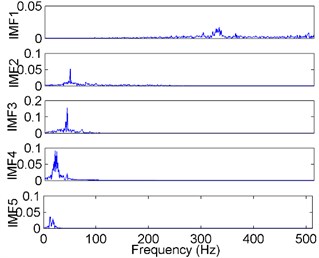
a) EEMD
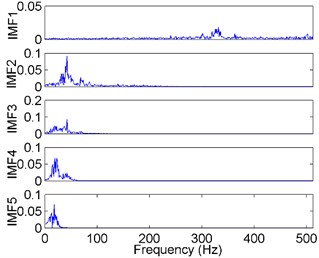
b) EMD
3.3. Results and discussions
The results of the accuracies with different decompositions, features and classifiers were shown in Table 1.
Table 1Classification accuracy with different decompositions, features, and classifiers
Decomposition | Feature | Classifier | Total accuracy % | |
1 | EEMD | PE | PSO-SVM | 83.3 |
2 | EEMD | EN | PSO-SVM | 73.3 |
3 | EEMD | {PE, EN} | PSO-SVM | 96.7 |
4 | EEMD | {PE, EN} | GA-SVM | 95.0 |
5 | EEMD | {PE, EN} | SVM | 81.7 |
6 | EEMD | {PE, EN} | BP NN | 86.7 |
7 | EMD | {PE, EN} | PSO-SVM | 86.0 |
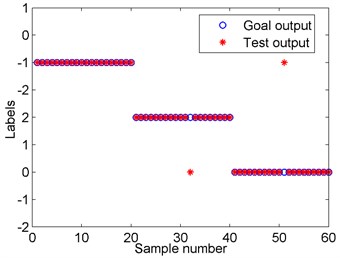
We can get the following information from the results: first, the multidimensional feature combining energy and entropy is more effective than a single feature by comparing 1-3. That’s because each feature has its advantage and multidimensional information is more comprehensive. Second, SVM has the lowest accuracy by comparing 3-5. The accuracy with different parameters is shown in Fig. 7, which means the parameters have great influence and indicates the necessity of the optimization. Third, the PSO-SVM performs better than other classifiers by comparing 3-6. Fourth, the EEMD has higher accuracy than the EMD by comparing 3, 7. All in all, the proposed method has the highest accuracy of 96.7 %, as shown in Fig. 8, which validates its effectiveness on the fault diagnosis of rope tension.
Fig. 7The influence of c, g parameters on accuracy
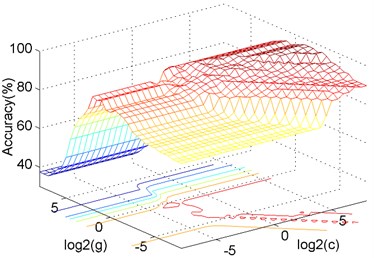
Fig. 8The result of the proposed method
4. Conclusions
Fault diagnosis of rope tension is of great significance for safety in hoisting systems. A novel diagnosis method based on the vibration signals of the head sheaves is proposed. The EEMD is used for decomposition. The PE and energy are used for feature extraction. The PSO-SVM is employed for classification. The effectiveness of the proposed method is validated by experiments. The effects of different decomposition, feature extraction, and classification methods were compared to show its advantage. Compared with the force-signal-based method, the advantages of the proposed method are following: first, the sensor installation does not affect the safety of the original structure; second, the data transmission and power supply are much more convenient; third, the device working environment on the ground is far better than in the underground, leading to a higher reliability and life. Therefore, the proposed method has great potential for engineering applications.
References
-
Wu J., Huang S., Kou Z. Research and optimization of intelligent diagnosis algorithm based on rope tension. Measurement, Vol. 147, 2019, p. 1-8.
-
Zhang X., Liang Y., Zhou J., Zang Y. A novel bearing fault diagnosis model integrated permutation entropy, ensemble empirical mode decomposition and optimized SVM. Measurement, Vol. 69, 2015, p. 164-179.
-
Wei L., Xu H. A review of early fault diagnosis approaches and their applications in rotating machinery. Entropy, Vol. 21, 2019, p. 409.
-
Feng Z., Liang M., Chu F. Recent advances in time-frequency analysis methods for machinery fault diagnosis: A review with application examples. Mechanical Systems and Signal Processing, Vol. 38, 2013, p. 165-205.
-
Huang N. E., Shen Z., et al. The empirical mode decomposition and the Hilbert spectrum for nonlinear and non-stationary time series analysis. Proceedings of the Royal Society of London. Series A: Mathematical, Physical and Engineering Sciences, Vol. 454, 1998, p. 903-995.
-
Zhaohua W., Huang N. E. Empirical mode decomposition: a noise assisted data analysis method. Advances in Adaptive Data Analysis, Vol. 1, 2011, p. 1-49.
-
Lei Y., Lin J., He Z., Zuo M. A review on empirical mode decomposition in fault diagnosis of rotating machinery. Mechanical Systems and Signal Processing, Vol. 35, 2013, p. 108-126.
-
Bandt C., Pompe B. Permutation entropy: a natural complexity measure for time series. Physical Review Letters, Vol. 88, 2002, p. 174102.
-
Zanin M., Zunino L., Rosso O., Papo D. Permutation entropy and its main biomedical and econophysics applications: a review. Entropy, Vol. 14, 2012, p. 1553-1577.
-
Liu R., Yang B., Zio E., Chen X. Artificial intelligence for fault diagnosis of rotating machinery: a review. Mechanical Systems and Signal Processing, Vol. 108, 2018, p. 33-47.
-
Zhou T., Zhu X., Liu Y. Peng W. Rolling element bearings fault diagnosis based on CEEMD and SVM. Vibroengineering Procedia, Vol. 5, 2015, p. 199-204.
-
Santos P., Villa L., Reñones A., Bustillo A., Maudes J. An SVM-based solution for fault detection in wind turbines. Sensors, Vol. 15, 2015, p. 5627-5648.
-
Hassan R., Cohanim B., De O. A comparison of particle swarm optimization and the genetic algorithm. 46th AIAA/ASME/ASCE/AHS/ASC Structures, Structural Dynamics and Materials Conference, 2005, p. 1138-1150.
-
Han D., Zhao N., Shi P. Gear fault feature extraction and diagnosis method under different load excitation based on EMD, PSO-SVM and fractal box dimension. Journal of Mechanical Science and Technology, Vol. 33, 2019, p. 487-494.
About this article

This work received financial support from the National Program on Key Basic Research Project of China (973 Project) under Grant 2014CB049400.
