Abstract
Though seismic vulnerability analysis of highway bridges is mature, there is little corresponding research on high-speed railway (HSR) bridges. The seismic vulnerability analysis of HSR bridges is very different to and more difficult than for highway bridges because the multiple components of the track structure are very complex. To fill this research gap, the authors establish a finite element (FE) model of an HSR bridge with the China railway track system II (CRTS II), which includes sliding layers, cement asphalt (CA) layers and fasteners, base plates, track plates and rails. Analytical results show that seismic responses of multiple bridge components have a linear correlation. Thus, the overall track-bridge system can be assumed to operate like a serial system. Here, the seismic response and vulnerability of various bridge components are first analyzed using the incremental dynamic analysis (IDA) method. Afterwards, the failure sequence is found by comparing the seismic vulnerability of critical bridge components. Finally, the seismic vulnerability of the overall track-bridge system is evaluated according to the upper and lower first-bounds. Results illustrate that the system vulnerability of HSR bridges, which is very different to that of highway bridges, is mainly determined by the sliding layers and fixed bearings. In particular, the serious damage of a sliding layer is caused by the uncoordinated deformation of beam ends, and fixed bearings may break down when they are exposed to strong earthquakes. The overall track-bridge system is prone to severe seismic damage when peak ground acceleration (PGA) is larger than 0.2 g.
Highlights
- Establish a finite element (FE) model for a high-speed railway (HSR) bridge considering China railway track system II (CRTS II).
- Analyze the seismic responses of multiple bridge components by using the incremental dynamic analysis (IDA) method.
- Develop seismic fragility curves of multiple bridge components on the basis of probabilistic seismic demand models (PSDMs).
- Find out the seismically induced failure mechanism of critical bridge components by comparing their seismic vulnerabilities.
- Evaluate the seismic vulnerability of the overall track-bridge system according to the upper and lower first-bounds.
- Find that the seismic vulnerability of the overall track-bridge system is mainly determined by the sliding layers and fixed bearings.
1. Introduction
High-speed railway (HSR) bridges are playing an increasingly important role in modern society [1]. However, in earthquake prone countries, such as Japan, Nepal, India, Philippines, Pakistan, Mexico and Turkey, such bridges are vulnerable to seismic damage [2, 3]. Such damage threatens property and human life, and involves significant investment in repair. Similarly, in mountainous areas of Western China, bridges are exposed to frequent and strong earthquakes, with potential seismic damage posing a great challenge to the development of the region. In order to evaluate bridges’ seismic risk and reduce seismically induced economic loss, it is imperative to find an efficient seismic risk assessment method for HSR bridges.
Recently, seismic fragility analysis has become an efficient tool to estimate bridges’ probable damage in terms of four distinct damage levels: slight damage, moderate damage, extensive damage and collapse damage [4]. Compared with the empirical fragility analysis approach using past recorded seismic damage data [5, 6], the analytical approach is more practical and efficient, especially in places lacking seismic damage data [7-11]. On the basis of numerical simulation, analytical fragility analysis can predict the probability of future seismic damage of a great number of bridges in a short time [12-14] and estimate the seismic risk of special bridges lacking reference data [15, 16]. This analysis approach is also better at analyzing the effect of interference-free influence factors (e.g., skew angles, structure parameters and seismic sources [17-19]) on the seismic vulnerability of bridges.
Fig. 1Different bridge types: a) highway bridges; b) HSR bridges
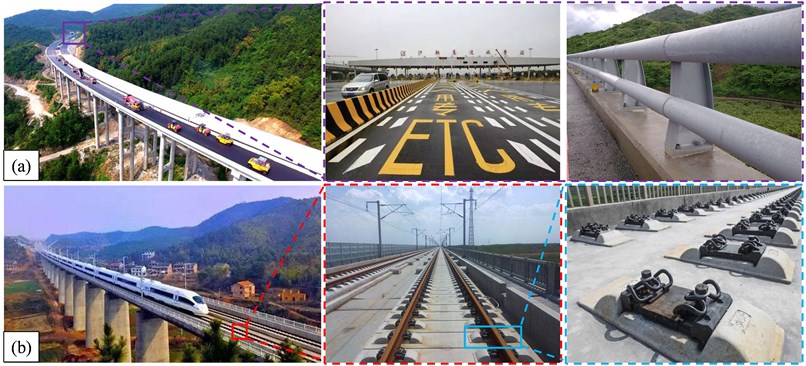
The seismic vulnerability of highway bridges has been extensively studied by previous scholars. Nielson and Desroches [20] investigated the typical effects of major components (e.g., columns, bearings and abutments) on the seismic vulnerability of a particular highway bridge system. Zhang [21] further utilized the highest damage state of bridge components to represent the damage degree of the whole bridge system. Meanwhile, Park [22] defined the seismic damage of a whole reinforced concrete (RC) structure as a linear combination of each element’s maximum deformation and repeated cyclic loadings. Later, Jara [19] used Park’s investigation in the seismic vulnerability analysis of a Mexican highway bridge. This research proved that critical bridge components may have a dramatic impact on the seismic vulnerability of the whole highway bridge system. However, to the best of the author’s knowledge, little research has been done to reveal the seismic vulnerability of HSR track-bridge systems. Wei et al. [23, 24] did examine the seismic vulnerability of HSR bridges. However, their work focused on the impact of the external environment (e.g., vertical ground motions and different earthquake intensity measures) on the bridge, and did not consider the damage mechanism of the bridge itself. The seismic vulnerability analysis of HSR bridges is very different to and more difficult than that of highway bridges because the track structure of HSR bridges is very complex, as shown in Fig. 1, so damage of multiple track structure components (sliding layers, base plates, cement asphalt layers, track plates, fasteners and rails) must be taken into account.
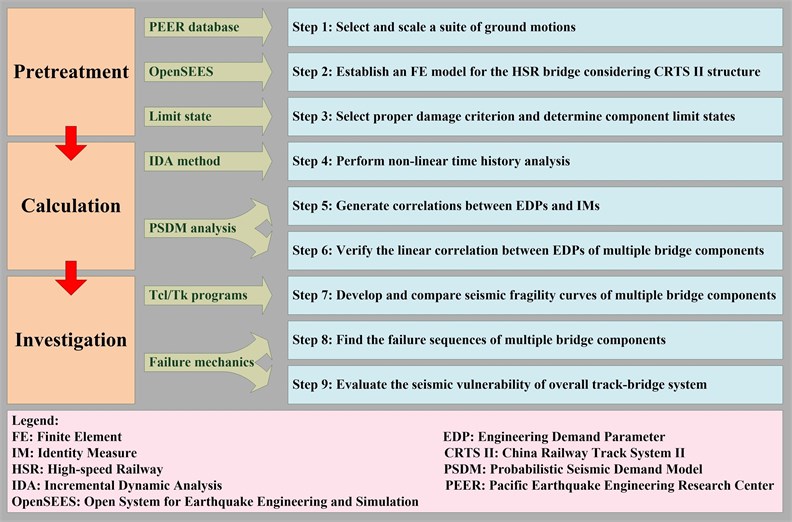
To fill the research gap, taking a typical HSR continuous girder bridge as an example, this study investigates the correlation of diverse component responses, develops seismic fragility curves for bridge components and systems, and uncovers the failure mechanism of the overall track-bridge system. First, a finite element (FE) model considering the track-bridge interaction is built on the Open System for Earthquake Engineering and Simulation (OpenSEES) platform. Afterwards, a total of 20 ground motion records are selected and scaled from the Pacific Earthquake Engineering Research Center (PEER) database (http://peer.berkeley.edu/smcat) as earthquake inputs. Then seismic responses of multiple bridge components are calculated using the incremental dynamic analysis (IDA) method [25]. Next, seismic fragility curves of multiple bridge components are developed on the basis of probabilistic seismic demand models (PSDMs) and compared in order to analyze their failure sequence. Finally, the track-bridge model is assumed to be a serial system, and its fragility is estimated according to the upper and lower first-order bounds.
2. High-speed railway bridge
2.1. Description of HSR railway bridges
2.1.1. Overall track-bridge system
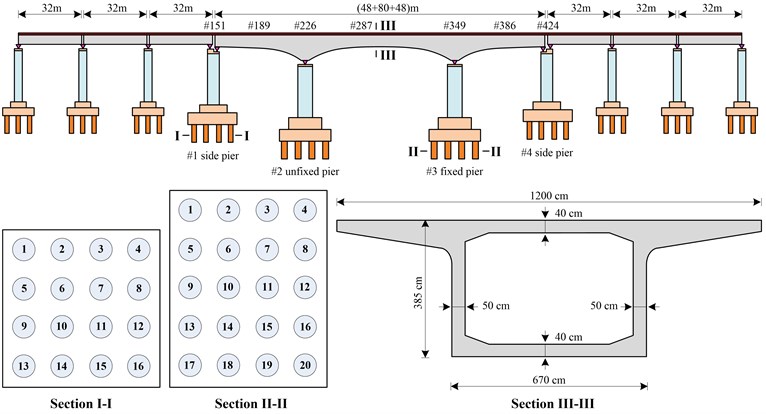
In Fig. 2, a typical HSR bridge is illustrated, with a (48+80+48) m three-span continuous girder bridge and six 32 m simply supported girder bridges. The overall bridge system contains several major components: the superstructure (e.g., the track structure and a 12 m-wide concrete deck), spherical steel bearings and the substructure (four reinforced concrete (RC) piers and relevant RC piles).
Fig. 2Configuration of an HSR bridge
2.1.2. Track structure
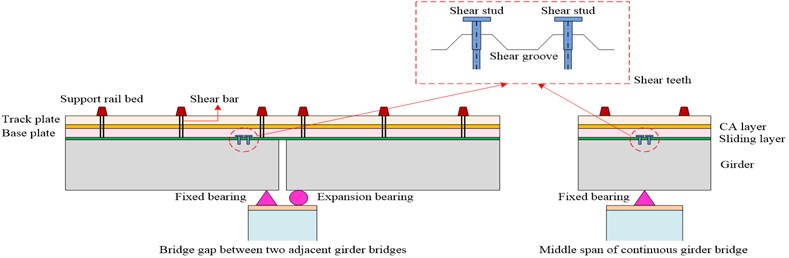
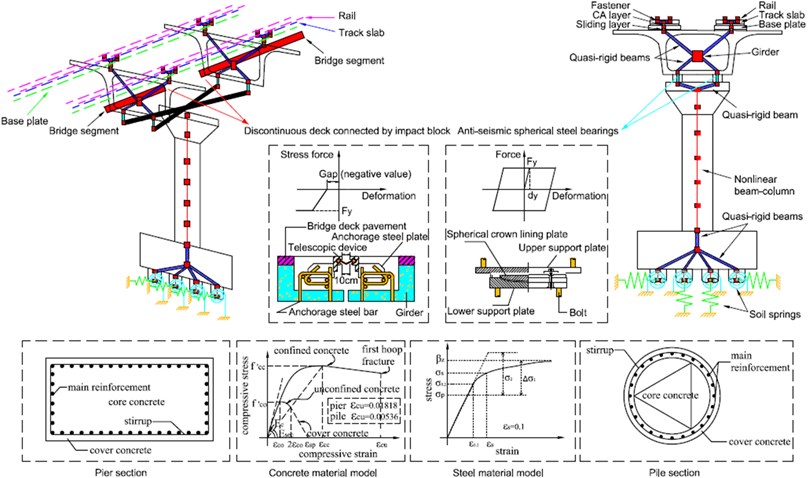
The China railway track system II (CRTS II) widely used in the Chinese HSR system possesses several strong advantages, such as high stability, less maintenance and prolonged service life. However, it is extremely vulnerable to seismic damage. In severe cases, large track deformation may pose a serious threat to train safety.
The CRTS II slab ballastless track, as shown in Fig. 3, is made up of sliding layers, cement asphalt (CA) layers, rails, base plates, track plates, fasteners and other components, such as support rail beds, shear bars, lateral blocks and shear teeth. The sliding layer is a very thin interlayer between the track structure and deck that ensures the slight movement of the base plates along the continuous deck. Likewise, the CA layer is also an interlayer to connect the track plates to the base plates. Shear teeth with relatively high stiffness are set at the beam ends to strengthen the connection between the base plates and deck, while a series of shear bars are utilized to strengthen the connection between the track plates and base plates. Lateral blocks are placed on the girder at frequent and equal intervals to restrict the transverse movement of the track structure. It should be noted that even though adjacent girders separate at girder gaps, the track structure on the girder is continuous along the longitudinal direction.
Fig. 3Schematic diagram of the track structure at the middle span and beam ends
2.1.3. Bearings
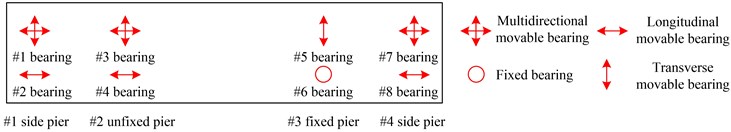
Bearings, which act as a major bridge component between the girders and piers, are prone to seismic damage. Bearings can protect piers from serious seismic damage when they remain intact. However, the load path of the bridge system will change after a bearing has completely collapsed, and this phenomenon may lead to worse seismic damage. As shown in Fig. 4, friction-based steel bearings are divided into expansion bearings and fixed bearings. The expansion bearing has a very small friction coefficient and it can freely slide along the longitudinal or transverse directions. In contrast, the fixed bearing has a very strong constraint, and it can not move unless it breaks down under a strong earthquake.
Fig. 4Schematic diagram of bearings
2.1.4. Piers and piles
Piers and piles can support the weight of girders. In Fig. 2, the piers are nearly equal in height (13 m for #1, #2 and #3 pier and 12 m for #4 pier). The cross section of the #1 and #4 side piers is a rectangle of 7.6 × 3.4 m, while the cross section of the #2 unfixed pier and #3 fixed pier is a rectangle of 8.6 × 4.2 m. Piles under the side piers (i.e., #1 and #4) are made of circular cross sections of 1.25 m in diameter, and piles under the middle piers (i.e., #2 and #3) are made of a circular cross section of 1.5 m in diameter.
2.2. Finite element model
As shown in Fig. 5, a 3D FE model on the OpenSEES platform is established herein to analyze the seismic behavior of HSR bridges. The girder, base plates, track plates and rails are modeled with linearly elastic beam elements [23,24], while the sliding layers, CA layers and fasteners are simulated with zero-length non-linear connecting elements [26,27]. The sliding layers are all 0.65 m apart according to the actual size of the standard slab track, as are the CA layers and fasteners. Expansion and fixed bearings are simulated with zero-length non-linear connecting elements. To simulate the longitudinal boundary condition of a central continuous girder bridge, three 32 m simply supported girder bridges are modeled on each side of the continuous girder bridge.
Each pier and pile is definitely modeled with non-linear fiber elements, including diverse fiber-defined cross sections: cover concrete, core concrete and steel bars. The fiber-defined cross section of each pier and pile is 40 rows × 100 columns and 13 rings × 30 wedges, respectively. With regard to the stress-strain relationship of materials of piers and piles, typical concrete material models and steel bar models are adopted according to prior research [28, 29].
Compared with previous investigations, this track-bridge FE model has an advantage to simulate the non-linear seismic behavior of every potentially damaged bridge component. Thus, this model is able to compare the seismic vulnerability of each major bridge component and find the weakest region of the track-bridge system. As this study focuses on the seismically induced failure sequence of HSR bridge components, we just focus on simulating major bridge components for the track-bridge system, but the train-track-bridge interaction is temporarily ignored.
Fig. 5An FE model for the HSR track-bridge system
3. Calculation methods
3.1. General process
The general process of this study is shown in Fig. 6. Regarding a given intensity measure () of an earthquake, the bridge is likely to be damaged when the structural demand () exceeds its capacity (). The conditioned damage probability can be defined as:
If both the demand and capacity of the bridge components obey a lognormal distribution, the above equation can be transformed to [11]:
where and refer to median values of the component demand and capacity, respectively; and represent the logarithmic standard values of the component demand and capacity, respectively; and is the standard normal distribution function.
Fig. 6Overview of the research program
3.2. Earthquake input
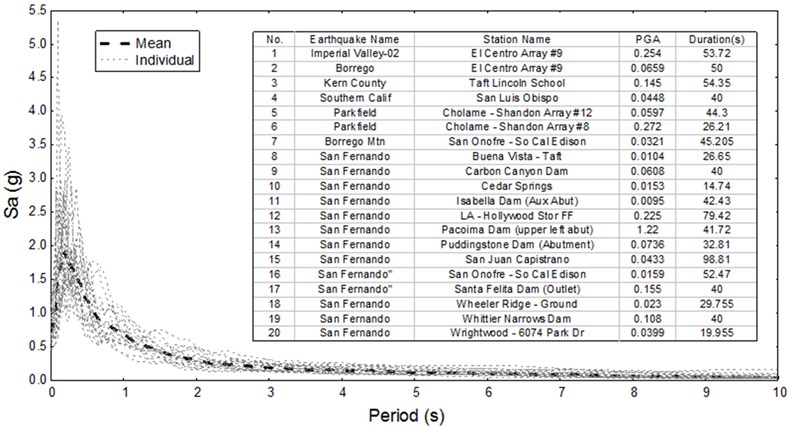
As illustrated in Fig. 7, the characteristic period of the earthquake spectrum is 0.25 s at the bridge site. The damping ratio of the track-bridge system is assumed to be 0.05 and the dynamic amplification factor is adopted as 2.25 for the earthquake spectrum. Since there is no historical seismic record at the bridge site, 20 ground motions are selected from the PEER database and scaled to match the above-mentioned target earthquake spectrum.
To get a more accurate prediction of seismic responses, it is essential to choose a proper seismic IM for the IDA. As recommended by Vamvatsikos and Cornell [30], both peak ground acceleration (PGA) and spectra acceleration (Sa) are the most common seismic IM choices. To be consistent with previous research works [23, 24], Sa is chosen as the optimum seismic IM in this study to reduce the dispersion of the IDA results.
For the average earthquake spectrum in Fig. 7, Sa is defined as the PGA value at the starting point [30], which is respectively adjusted to be 0.05, 0.1, 0.2, 0.4 and 0.8 g to get five different seismic IM levels. Meanwhile, other points on the average spectrum in Fig. 7 are scaled with the same scale factors. Accordingly, the acceleration values of the corresponding 20 accelerograms in Fig. 7 are also scaled with the same scale factors. These scaled acceleration values are used as ground motion inputs. Both longitudinal and transverse ground motions are respectively considered for the HSR track-bridge system. Thus, 200 seismic cases are calculated for the non-linear time history analysis using the IDA method.
3.3. Probabilistic seismic demand model
The potential seismic responses of bridge components can be estimated through a probabilistic seismic demand model (PSDM). A PSDM efficiently indicates the correlation between the potential engineering demand parameters (EDPs) and a given seismic IM. Generally, the median value of EDPs is assumed to follow a two-parameter lognormal probability distribution [31]:
where is the median value of the EDPs, and and are constant regression coefficients.
Ramanathan et al. [32] further valued the dispersion of EDPs for the conditioned seismic IM:
Fig. 7Selected ground motion records
3.4. Component limit state
The potential seismic damage of bridge components can be defined by four qualitative limit states: intact to slight damage, slight damage to moderate damage, moderate damage to extensive damage and extensive damage to collapse [4]. Previous studies have demonstrated that most common parameters, such as component strain and displacement, are able to define component limit states [33-35]. For the HSR track-bridge system in this study, the relative displacement in meters is used to define the component limit states of sliding layers, CA layers, fasteners and bearings [21], while the material strain is utilized to define the component limit states of cover concrete, core concrete and steel bars of piers and piles [36]. The limit states of potential component damage are summarized in Table 1, where and denote the ultimate strain of the core concrete and steel bars, respectively.
3.5. First-order bounds
A bridge system may contain many bridge components. Thus, it is very difficult to find a particular limit state for the seismic damage of the overall bridge system. For HSR bridges in particular, the great number of track structure components dramatically increases the computational complexity.
Past researchers have usually avoided this problem and represented the seismic vulnerability of the overall bridge system with the seismic vulnerability of one particular bridge component. This traditional approach may lead to a misrepresentation of the seismic vulnerability of a bridge system because all independent but interrelated bridge components perform an indispensable role independently.
Table 1Limit state of potential component damage
Bridge component | Measurement | Intact to slight | Slight to moderate | Moderate to extensive | Extensive to collapse |
Sliding layer | Deform. (m) | 0.0005 | 0.001 | 0.0015 | 0.002 |
Shear tooth | Deform. (m) | 0.00012 | 0.00018 | 0.0005 | 0.001 |
Lateral block | Deform. (m) | 0.002 | 0.003 | 0.004 | 0.005 |
CA layer | Deform. (m) | 0.0005 | 0.001 | 0.0015 | 0.002 |
Shear bar | Deform. (m) | 0.000075 | 0.000113 | 0.000338 | 0.000675 |
Fastener | Deform. (m) | 0.002 | 0.003 | 0.004 | 0.005 |
Expansion bearing | Deform. (m) | 0.1 | 0.13 | 0.16 | 0.2 |
Fixed bearing | Deform. (m) | 0.002 | 0.004 | 0.006 | 0.008 |
Cover concrete | Strain | 0.0006 | 0.002 | 0.0035 | 0.006 |
Core concrete | Strain | 0.0035 | 0.004 | 1.5 | |
Steel bar | Strain | 0.01 | 0.015 | 0.5 | 0.09 |
Briefly, the HSR bridge in this study is assumed to operate like a serial system. Thus, the seismic vulnerability of the overall track-bridge system can be evaluated by the upper and lower first-order bounds [20, 21]:
where and denote the seismic vulnerability of a bridge component and system, respectively.
With regard to the lower bound probability, all bridge components are assumed to work together, and the destruction of any component will cause seismic damage to the overall track-bridge system. Thus, the system fragility is underestimated in this case. In contrast, the upper bound probability overestimates the system fragility. In this case, there is no correlation between the component responses. Therefore, the track-bridge system will remain intact only when all bridge components are free of seismic damage.
4. Results and discussion
4.1. Seismic responses
Fig. 8 shows the seismic responses of multiple bridge components under a longitudinal earthquake. Almost all sliding layers are seismically damaged under this earthquake, with the maximum longitudinal deformations of most sliding layers exceeding their slight damage limit state (0.5 mm). In particular, when the PGA is larger than 0.4 g, a large number of the sliding layers will be completely damaged as their maximum longitudinal deformations are beyond 2 mm. Due to the restriction of the shear teeth near the #6 fixed bearing, its surrounding sliding layers have less seismic damage. However, as longitudinal deformations of the sliding layers near the shear teeth are very small and the base plates move together with the girder, the seismic inertia force in this region will directly transfer to the above CA layers. This is the reason why the CA layers near the shear teeth have the largest maximum longitudinal deformation. It is also observed that the CA layers at the beam ends have a larger maximum longitudinal deformation than the CA layers at other positions, because the girder gap leads to a greater longitudinal uncoordinated deformation. This phenomenon is consistent with the larger maximum longitudinal deformation of sliding layers at the beam ends. Regarding the maximum longitudinal deformation of the fasteners, all are below the slight damage limit state (2 mm). Thus, all fasteners will remain intact when they are exposed to earthquakes.
Fig. 8Seismic responses for multiple bridge components under a longitudinal earthquake: a) sliding layers; b) CA layers; c) fasteners; d) bearings; e) piers; f) piles
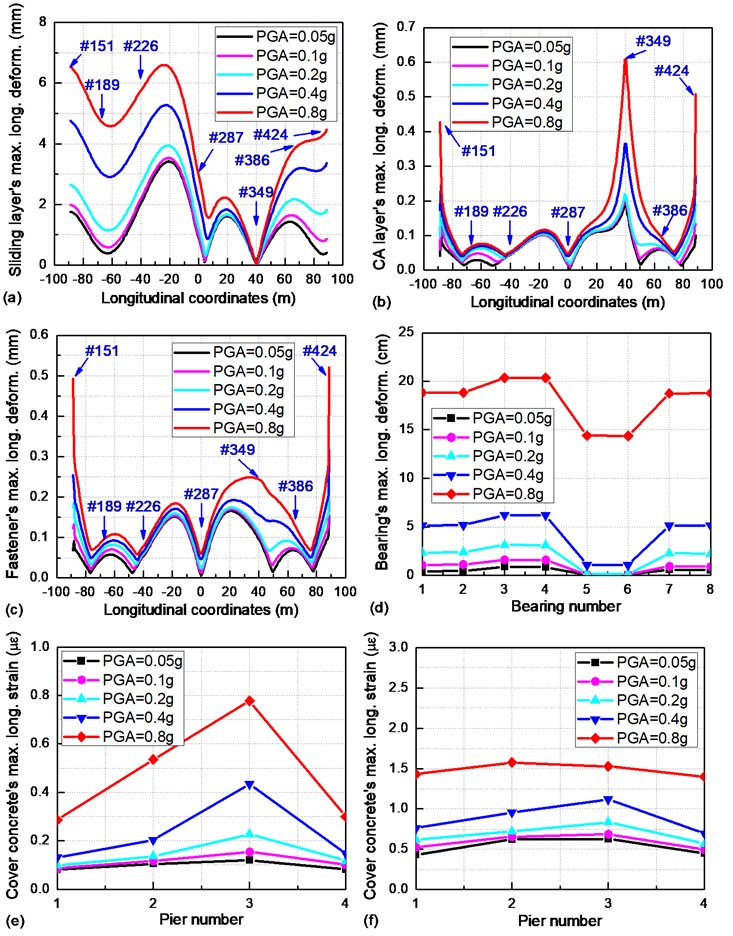
As shown in Fig. 8(d), any two adjacent bearings (e.g., #1 and #2 bearings) on the top of the same pier have an equal maximum longitudinal deformation. When the PGA is smaller than 0.2 g, the longitudinal relative displacement of the #6 fixed bearing is strongly limited due to its very high stiffness. Thus, all bearings, as well as the whole girder, have just a very small longitudinal relative displacement. As the PGA gradually increases, the maximum longitudinal deformation of the #6 fixed bearing will dramatically increase to its collapse damage limit state (8 mm) and result in a great longitudinal relative displacement of the girder. This phenomenon further indicates the reason why track structures (namely, sliding layers, CA layers and fasteners) demonstrate a suddenly increasing longitudinal maximum deformation when the PGA is larger than 0.2 g.
As the cover concrete, core concrete and steel bar at the same position have the same strain, only the maximum longitudinal strain of the cover concrete of piers and piles are demonstrated in Figs. 8(e) and 8(f). The cover concrete is prone to being slightly damaged during the longitudinal earthquake, while the core concrete and steel bars will be free from seismic damage [23, 24]. Since the #3 fixed pier is subjected to a great seismic inertia force transferred from the #6 fixed bearing, the cover concrete at the #3 fixed pier bottom shows a much larger maximum longitudinal strain than the cover concrete at other positions. In addition, the cover concrete on the #12 pile top under the #3 fixed pier also demonstrates the largest maximum longitudinal deformation.
Fig. 9Seismic responses for multiple bridge components under a transverse earthquake: a) sliding layers; b) CA layers; c) fasteners; d) bearings; e) piers; f) piles
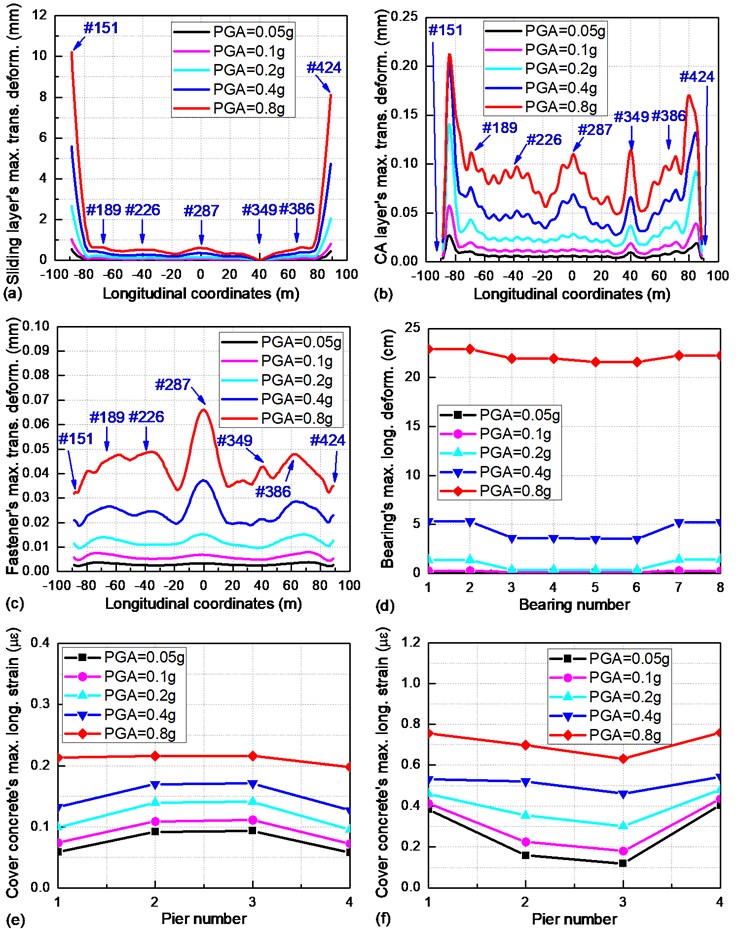
The seismic responses of multiple bridge components under a transverse earthquake are explicated in Fig. 9. Compared with the seismic behavior of the track structure in Fig. 8, most sliding layers, CA layers and fasteners show a much smaller maximum deformation. Only a few sliding layers at the beam ends will be completely damaged when the PGA is larger than 0.2 g.
As illustrated in Fig. 9(d), the maximum longitudinal deformation of the bearings (e.g., #1 and #7 bearings) are symmetric with respect to the transverse axis at the midpoint of the continuous beam. Furthermore, due to the synergetic constraint of the #2, #4, #6 and #8 bearings in the transverse direction, every bearing is assumed to undertake an approximately equal seismic inertia force and shows a roughly equal maximum transverse deformation. When the PGA is larger than 0.2 g, the #2, #4, #6 and #8 bearings will totally break down and result in a sharply increasing relative displacement of the girder in the transverse direction. No significant maximum transverse strain of the cover concrete is found in Figs. 9(e) and 9(f), i.e., piers and piles are very likely to remain intact under a transverse earthquake.
4.2. Correlation between critical bridge components
On the basis of the IDA in Section 4.1, the EDPs (e.g., bearing deformation) of multiple bridge components are estimated through PSDMs. PSDMs of the most vulnerable critical bridge components are listed in Table 2. The dispersion coefficient in Table 2 is mostly larger than 0.8. This means that the estimated EDPs have an approximately linear correlation with the different seismic IM levels (i.e., PGA or Sa defined in Section 3.2).
Table 2PSDMs for critical track-bridge system components
Bridge component | PSDM (longitudinal) | PSDM (transverse) | ||
#151 sliding layer | 0.88 | 0.94 | ||
#151 CA layer | 0.90 | 0.92 | ||
#151 fastener | 0.90 | 0.91 | ||
#1 expansion bearing | 0.91 | 0.95 | ||
#6 fixed bearing | 0.78 | 0.88 | ||
#1 pier bottom | 0.69 | 0.91 | ||
#3 pier bottom | 0.90 | 0.94 | ||
#12 pile top (#1 pier) | 0.76 | 0.81 | ||
#12 pile top (#3 pier) | 0.87 | 0.88 |
Table 3Correlation between longitudinal seismic responses of critical bridge components
1 | 0.872 | 0.803 | 0.861 | 0.834 | 0.694 | 0.929 | 0.771 | 0.889 | |
0.872 | 1 | 0.944 | 0.897 | 0.837 | 0.848 | 0.906 | 0.920 | 0.857 | |
0.803 | 0.944 | 1 | 0.914 | 0.764 | 0.755 | 0.854 | 0.872 | 0.814 | |
0.861 | 0.897 | 0.914 | 1 | 0.848 | 0.638 | 0.925 | 0.774 | 0.874 | |
0.834 | 0.837 | 0.764 | 0.848 | 1 | 0.731 | 0.912 | 0.781 | 0.857 | |
0.694 | 0.848 | 0.755 | 0.638 | 0.731 | 1 | 0.709 | 0.901 | 0.642 | |
0.929 | 0.906 | 0.854 | 0.925 | 0.912 | 0.709 | 1 | 0.780 | 0.945 | |
0.771 | 0.920 | 0.872 | 0.774 | 0.781 | 0.901 | 0.780 | 1 | 0.734 | |
0.889 | 0.857 | 0.814 | 0.874 | 0.857 | 0.642 | 0.945 | 0.734 | 1 | |
Note: , , , and denote the maximum deformation of the #151 sliding layer, #151 CA layer, #151 fastener, #1 expansion bearing and #6 fixed bearing, respectively; and denote the maximum strain of the cover concrete at the #1 unfixed pier and #3 fixed pier bottom, respectively; and denote the maximum strain of the cover concrete on the #12 pile top at the#1 unfixed pier and #3 fixed pier bottom, respectively | |||||||||
The correlation between the EDPs of the critical bridge components is also listed in Table 3 and 4, showing a nearly linear correlation between most EDPs. In particular, all s of the correlation between the EDPs of track structure components (namely, #151 sliding layer, CA layer and fastener) are larger than 0.8, while some s of the correlation between the EDPs of the track structure, bearings, piers and piles are smaller than 0.8. For example, the of the correlation between and in Table 3 is 0.764. This is because (i) the #151 fastener is far away from the #6 fixed bearing and (ii) the #151 fastener is very vulnerable under a strong earthquake, while the #6 fixed bearing usually remains intact. The of the correlation between and in Table 3 is 0.642. This is because (i) the cover concrete at the #1 unfixed pier bottom is not directly linked with the cover concrete on the #12 pile top at the #3 fixed pier bottom and (ii) the seismic inertial force at the bottom of the pier is shared by a group of pile foundations.
Table 4Correlation between transverse seismic responses of critical bridge components
1 | 0.951 | 0.941 | 0.949 | 0.863 | 0.854 | 0.908 | 0.750 | 0.850 | |
0.951 | 1 | 0.924 | 0.929 | 0.812 | 0.841 | 0.903 | 0.699 | 0.869 | |
0.941 | 0.924 | 1 | 0.870 | 0.774 | 0.797 | 0.854 | 0.694 | 0.785 | |
0.949 | 0.929 | 0.870 | 1 | 0.939 | 0.908 | 0.931 | 0.814 | 0.912 | |
0.863 | 0.812 | 0.774 | 0.939 | 1 | 0.880 | 0.885 | 0.819 | 0.850 | |
0.854 | 0.841 | 0.797 | 0.908 | 0.880 | 1 | 0.953 | 0.893 | 0.884 | |
0.908 | 0.903 | 0.854 | 0.931 | 0.885 | 0.953 | 1 | 0.856 | 0.891 | |
0.750 | 0.699 | 0.694 | 0.814 | 0.819 | 0.893 | 0.856 | 1 | 0.723 | |
0.850 | 0.869 | 0.785 | 0.912 | 0.850 | 0.884 | 0.891 | 0.723 | 1 | |
Note: , , , and denote the maximum deformation of the #151 sliding layer, #151 CA layer, #151 fastener, #1 expansion bearing and #6 fixed bearing, respectively; and denote the maximum strain of the cover concrete at the #1 unfixed pier and #3 fixed pier bottom, respectively; and denote the maximum strain of the cover concrete on the #12 pile top at the#1 unfixed pier and #3 fixed pier bottom, respectively | |||||||||
4.3. Seismic vulnerability of critical bridge components
The sliding layers, CA layers and fasteners that demonstrate the largest or smallest seismic responses at the middle span and beam ends in Section 4.1 are selected as the representatives to uncover the seismic damage rules of the track structure, while the bearings and cover concrete at the pier bottoms and on the pile tops described in Section 4.1 are chosen for comparative analysis.
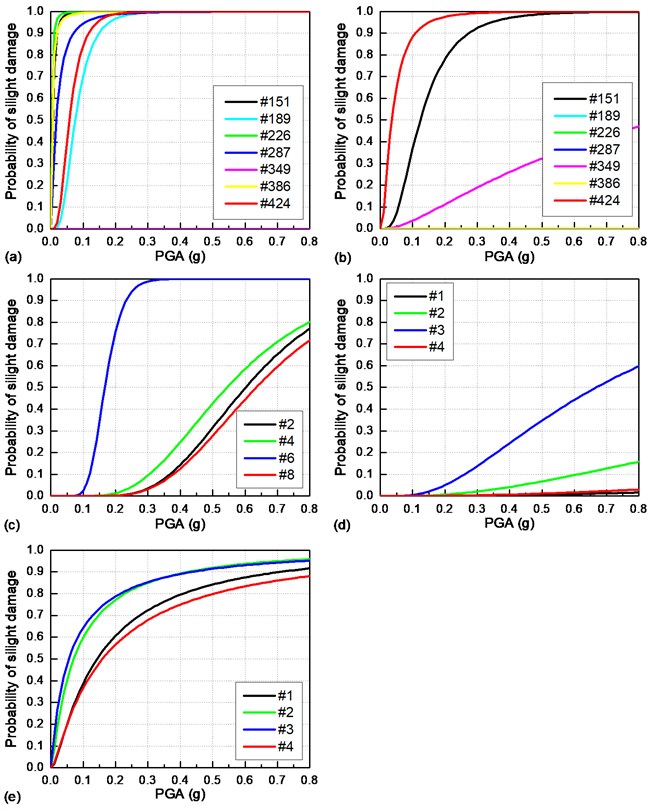
It can be seen in Fig. 10(a) that the #226 sliding layer on the top of the #2 unfixed pier is extremely vulnerable under a longitudinal earthquake, while the #349 sliding layer on the top of the #3 fixed pier is likely to remain intact. Besides this, the #424 CA layer at the right beam end from Fig. 10(b) is most vulnerable among all the CA layers. Meanwhile, it is almost impossible for the fastener to be seismically damaged due to its very small maximum longitudinal deformation.
As described in Fig. 8(d), the #1 and #2 bearings indicate the same seismic responses. Thus, their seismic fragility curves are the same, as are those of the 3# and 4# bearings, the 5# and 6# bearings, and the 7# and 8# bearings. Fig. 10(c) illustrates that the #6 fixed bearing is much more vulnerable than other bearings. In Fig. 10(d), the cover concrete at the #3 fixed pier bottom is prone to slight seismic damage, while other cover concrete remains intact under the longitudinal earthquake. In Fig. 10(e), the cover concrete on the top of the #12 pile under the #3 fixed pier has the largest exceedance probability.
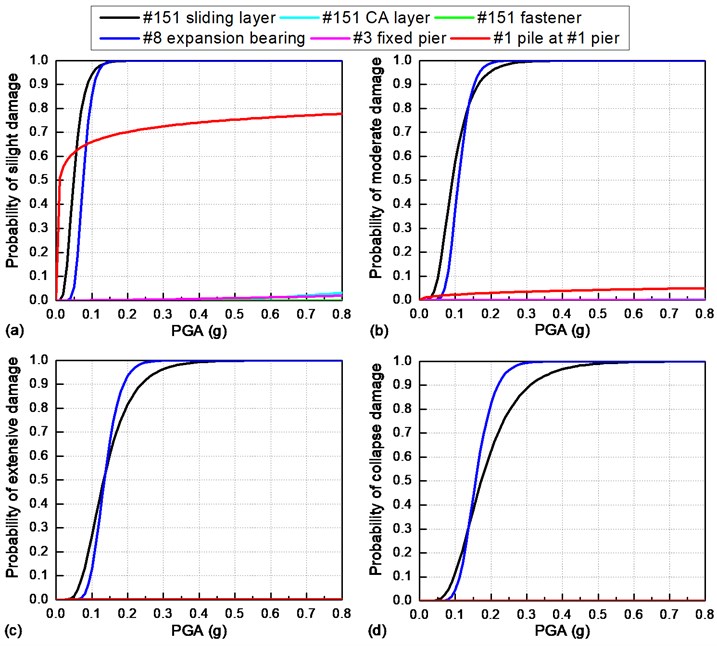
Fig. 11 depicts the seismic fragility curves of only the sliding layers and bearings because other critical bridge components such as the CA layers, fasteners, piers and piles remain intact under a transverse earthquake. It is shown that the #151 sliding layer at the left beam end and the #8 bearing are most vulnerable.
Fig. 10Seismic fragility curves for critical bridge components under a longitudinal earthquake: a) sliding layers; b) CA layers; c) bearings; d) piers; e) piles
4.4. Comparison of critical bridge components
In Section 4.2, the seismic vulnerabilities of all critical bridge components are shown to be highly correlated. Thus, the seismically induced failure mechanism of the whole track-bridge system is mainly determined by the failure sequence of these critical bridge components. In Section 4.3, the most vulnerable critical bridge components are further selected as representatives. Here, the failure sequence of the critical bridge components under a longitudinal earthquake is determined by comparing the components’ seismic fragility curves shown in Fig. 12.
Case I: Slight damage. When the PGA ≤ 0.2 g, the #226 sliding layer on the top of the #2 unfixed pier has the largest seismic vulnerability, followed by the #424 CA layer at the right beam end, the cover concrete on the top of the #12 pile under the #3 fixed pier and the #6 fixed bearing. When the PGA > 0.2 g, the #226 sliding layer and the #424 CA layer are usually slightly damaged. Also, the #6 fixed bearing and cover concrete on the top of the #12 pile under the #3 fixed pier are extremely vulnerable to slight damage, while the cover concrete at the #3 fixed pier bottom has a much lower seismic vulnerability.
Case II: Moderate damage. Moderate damage firstly appears on the #226 sliding layer on the top of the #2 unfixed pier. As the PGA gradually increases, the #424 CA layer at the right beam end and the #6 fixed bearing will also suffer from moderate seismic damage. The cover concrete on the top of the #12 pile under the #3 fixed pier is less likely to sustain moderate damage.
Case III: Above extensive damage. The #226 sliding layer on the top of the #2 unfixed pier is prone to very serious damage. The #6 fixed bearing remains intact when the PGA is smaller than 0.2 g, while it may be seriously damaged when the PGA is larger than 0.2 g. Certainly, the #424 CA layer at the right beam end is also likely to present severe damage under a strong earthquake.
Fig. 11Seismic fragility curves for critical bridge components under a transverse earthquake: a) sliding layers; b) bearings
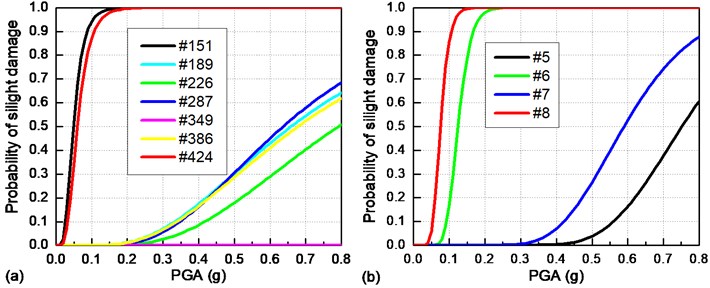
Fig. 12Comparison of seismic fragility curves of critical bridge components under a longitudinal earthquake: a) slight damage; b) moderate damage; c) extensive damage; d) collapse damage
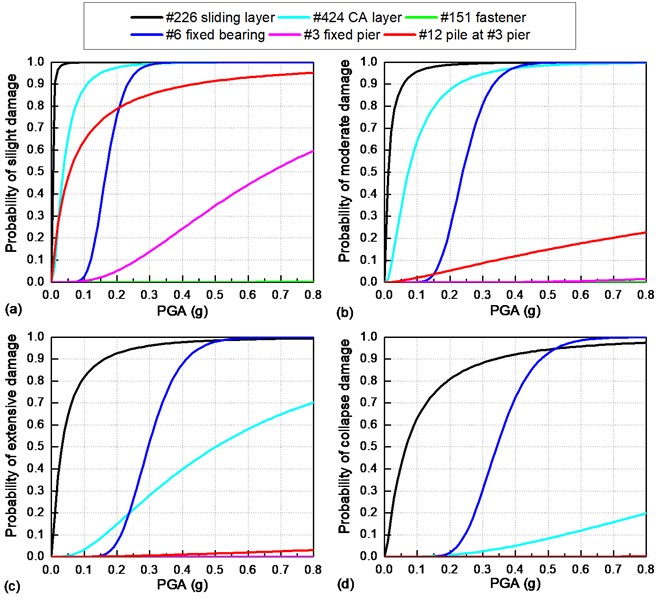
Fig. 13 shows the failure sequence of critical bridge components when they are exposed to a transverse earthquake.
Case I: Slight damage. When the PGA ≤ 0.05 g, the cover concrete on the top of the #1 pile under the #1 side pier presents a relatively larger seismic vulnerability. When the PGA > 0.05 g, the slight seismic damage probabilities of the #151 sliding layer at the left beam end and the #8 bearing rapidly increase to 100%, while the seismic fragility curve of the cover concrete on the top of the #1 pile under the #1 side pier increases at a very slow speed.
Case II: Above moderate damage. Both the #151 sliding layer and the #8 bearing are prone to severe damage, while other components are rarely damaged under the transverse earthquake.
Fig. 13Comparison of seismic fragility curves of critical bridge components under a transverse earthquake: a) slight damage; b) moderate damage; c) extensive damage; d) collapse damage
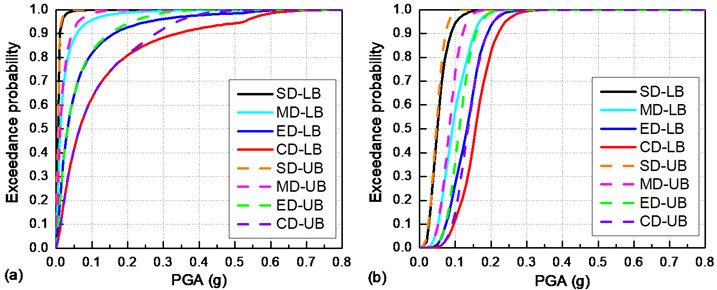
4.5. Seismic vulnerability of track-bridge system
Fig. 14 evaluates the seismic vulnerability of the overall track-bridge system using the upper and lower first-order bounds. Evaluation results indicate that the system fragility curves gradually increase with the PGA. When the PGA is larger than 0.2 g, the overall track-bridge system may suffer from serious seismic damage (the probability of collapse is larger than 80 %). Additionally, it is illustrated in Fig. 14 that the lower bound is very close to the upper bound, because the seismic responses of critical bridge components show a linear correlation with each other, as described in Section 4.2. In particular, the lower bound of the collapse damage fragility curve is mainly determined by sliding layers and fixed bearings. For example, as shown in Fig. 14(a), when the PGA is smaller than 0.52 g, the system vulnerability under a longitudinal earthquake is determined by the #226 sliding layer, because that sliding layer is more vulnerable to complete damage than other components. When the PGA exceeds 0.52 g, the #6 fixed bearing shows a larger seismic vulnerability than the #226 sliding layer. This phenomenon is consistent with the result in Fig. 12(d).
Fig. 14Seismic fragility curves of the overall track-bridge system: a) under a longitudinal earthquake; b) under a transverse earthquake (SD: slight damage; MD: moderate damage; ED: extensive damage; CD: collapse damage; LB: lower bound; UB: upper bound)
4.6. Future work of experimental validation
The shaking table test is commonly used for the experimental validation of the FE model. There are three multi-function shaking tables in the National Engineering Laboratory for Construction Technology of High-Speed Railways. The 4 × 6 m shaking table can bear a maximum load of 45 tons and a maximum acceleration of 1.0 g. We plan to carry out a shaking table test of a 1:7 scale railway bridge in the future. The same ground motions will be input to the shaking table control system and the seismic responses of bearings and piers will be recorded. If the experimental result is identical to the numerical result, the correctness of the FE model will be reasonably validated.
5. Conclusions
To evaluate the seismically induced failure mechanism of HSR bridges, a typical track-bridge system is thoroughly analyzed in this study. By comparing the seismic responses and seismic vulnerabilities of critical bridge components, a few conclusions can be made as follows:
1) Estimated EDPs of diverse critical bridge components are linearly correlated with each other. This means that the whole track-bridge system can be seen as a serial system, i.e., the seismic damage of one particular bridge component is likely to result in the seismic damage of another.
2) Sliding layers are most vulnerable to seismic damage. CA layers at the beam ends are prone to severe damage under a longitudinal earthquake, while no CA layers are likely to be seismically damaged under a transverse earthquake due to the transverse boundary restriction of lateral blocks. Fasteners always remain intact when they are exposed to earthquakes.
3) The seismic damage of bearings is mainly determined by the damage status of fixed bearings. When the PGA is smaller than 0.2 g, all bearings have only a very small maximum deformation due to the strong constraint of the fixed bearings. When the PGA is larger than 0.2 g, the fixed bearings will be completely damaged and the whole girder will subsequently present a suddenly increasing relative displacement.
4) The cover concrete, core concrete and steel bars of the same piers and piles have the same strain but different damage states. The cover concrete is very likely to suffer from slight damage under earthquakes, while the core concrete and steel bar remain intact.
5) Assuming the overall track-bridge as a serial system, its seismic vulnerability can be estimated by the upper and lower first-order bounds. Calculation results show that the overall track-bridge system is prone to severe seismic damage when the PGA is larger than 0.2 g. In particular, the system vulnerability is mainly determined by the sliding layers and fixed bearings, which have the largest seismic vulnerability among all bridge components.
References
-
He X. H., Wu T., Zou Y. F., Chen Y. F., Guo H., Yu Z. W. Recent developments of high-speed railway bridges in China. Structure and Infrastructure Engineering, Vol. 13, Issue 12, 2017, p. 1584-1595.
-
Liu H., Wang P., Wei X. K., Xiao J. L., Chen R. Longitudinal seismic response of continuously welded track on railway arch bridges. Applied Science, Vol. 8, Issue 5, 2018, p. 775.
-
Mohseni I., Lashkariani H., Kang J., Kang T. Dynamic response evaluation of long-span reinforced arch bridges subjected to near- and far-field ground motions. Applied Science, Vol. 8, Issue 8, 2018, p. 1243.
-
Choi E., Desroches R., Nielson B. Seismic fragility of typical bridges in moderate seismic zones. Engineering Structures, Vol. 26, Issue 2, 2004, p. 187-199.
-
Basoz N. I., Kiremidjian A. S., King S. A., Law K. H. Statistical analysis of bridge damage data from the 1994 Northridge, CA, Earthquake. Earthquake Spectra, Vol. 15, Issue 1, 1999, p. 25-54.
-
Yamazaki F., Motomura H., Hamada T. Damage assessment of expressway networks in Japan based on seismic monitoring. Proceedings of 12th World Conference on Earthquake Engineering (WCEE), 2000.
-
Shinozuka M., Feng M. Q., Kim H. K., Kim S. H. Nonlinear static procedure for fragility curve development. Journal of Engineering Mechanics, Vol. 126, Issue 12, 2000, p. 1287-1295.
-
Mackie K., Stojadinovic B. Fragility curves for reinforced concrete highway overpass bridges. In Proceedings of 13th World Conference on Earthquake Engineering (WCEE), Vancouver, Canada, 2004.
-
Mander J. B., Basoz N. Seismic fragility curves theory for highway bridges. Proceedings of 5th US Conference on Lifeline Earthquake Engineering, Reston, VA, 1999, p. 31-40.
-
Karim K. R., Yamazaki F. Effect of earthquake ground motions on fragility curves of highway bridge piers based on numerical simulation. Earthquake Engineering and Structural Dynamics, Vol. 30, Issue 12, 2001, p. 1839-1856.
-
Padgett, J. E., Desroches R. Methodology for the development of analytical fragility curves for retrofitted bridges. Earthquake Engineering and Structural Dynamics, Vol. 37, Issue 8, 2008, p. 1157-1174.
-
Park J., Towashiraporn P. Rapid seismic damage assessment of railway bridges using the response-surface statistical model. Structural Safety, Vol. 47, Issue 2, 2014, p. 1-12.
-
Seo J., Linzell D. G. Horizontally curved steel bridge seismic vulnerability assessment. Engineering Structure, Vol. 34, 2012, p. 21-32.
-
Tehrani P., Mitchell D. Seismic risk assessment of four-span bridges in Montreal designed using the Canadian bridge design code. Journal of Bridge Engineering, Vol. 19, Issue 8, 2014, https://doi.org/10.1061/(ASCE)BE.1943-5592.0000499.
-
Bhuiyan M. A. R., Alam M. S. Seismic vulnerability assessment of a multi-span continuous highway bridge fitted with shape memory alloy bars and laminated rubber bearings. Earthquake Spectra, Vol. 28, Issue 4, 2012, p. 1379-1404.
-
Alam M. S., Bhuiyan M. A. R., Billah A. H. M. M. Seismic fragility assessment of SMA-bar restrained multi-span continuous highway bridge isolated by different laminated rubber bearings in medium to strong seismic risk zones. Bulletin of Earthquake Engineering, Vol. 10, Issue 6, 2012, p. 1885-1909.
-
Zakeri B., Padgett J. E., Amiri G. G. Fragility analysis of skewed single-frame concrete box-girder bridges. Journal of Performance of Constructed Facilities, Vol. 28, Issue 3, 2014, p. 571-582.
-
Karim K. R., Yamazaki F. A simplified method of constructing fragility curves for highway bridges. Earthquake Engineering and Structural Dynamics, Vol. 32, Issue 10, 2003, p. 1603-1626.
-
Jara J. M., Madrigal E., Jara M., Olmos B. A. Seismic source effects on the vulnerability of an irregular isolated bridge. Engineering Structures, Vol. 56, Issue 6, 2013, p. 105-115.
-
Nielson B. G., Desroches R. Seismic fragility methodology for highway bridges using a component level approach. Earthquake Engineering and Structural Dynamics, Vol. 36, Issue 6, 2006, p. 823-839.
-
Zhang J., Huo Y. L. Evaluating effectiveness and optimum design of isolation devices for highway bridges using the fragility function method. Engineering Structures, Vol. 31, Issue 8, 2009, p. 1648-1660.
-
Park Y. J., Ang A. G. S., Wen Y. K. Seismic damage analysis and damage-limiting design of R.C. buildings. Structural Research Series No. 516, University of Illinois, Urbana, U.S.A., 1988.
-
Wei B., Zuo C. J., He X. H., Jiang L. Z., Wang T. Effects of vertical ground motions on seismic vulnerabilities of a continuous track-bridge system of high-speed railway. Soil Dynamics and Earthquake Engineering, Vol. 115, 2018, p. 281-290.
-
Wei B., Li C. B., He X. H. The applicability of different earthquake intensity measures to the seismic vulnerability of a high-speed railway continuous bridge. International Journal of Civil Engineering, Vol. 17, 2019, p. 981-997.
-
Vamvatsikos D., Cornell C. A. Incremental dynamic analysis. Earthquake Engineering and Structural Dynamics, Vol. 31, Issue 3, 2002, p. 491-514.
-
Yu D. S. Seismic Vulnerability Analysis for Prestressed Concrete Continuous Girder Bridge in High-Speed Railway. Master Thesis, Central South University, China, 2015, (in Chinese).
-
Zhang J., Wu D. J., Li Q. Loading-history-based track–bridge interaction analysis with experimental fastener resistance. Engineering Structures, Vol. 83, 2015, p. 62-73.
-
Mander J. B., Priestley M. J. N., Park R. Theoretical stress-strain model for confined concrete. Journal of Structural Engineering, Vol. 114, Issue 8, 1988, p. 1804-1826.
-
Priestley M. J. N., Kowalsky M. Direct displacement-based seismic design of concrete buildings. Bulletin of the New Zealand National Society for Earthquake Engineering, Vol. 33, Issue 4, 2000, p. 421-444.
-
Vamvatsikos D., Cornell C. A. Direct estimation of seismic demand and capacity of multi degree-of-freedom systems through incremental dynamic analysis of single degree of freedom approximation. Journal of Structural Engineering, Vol. 131, Issue 4, 2005, p. 589-599.
-
Cornell C. A., Jalayer F., Hamburger R. O., Foutch D. A. Probabilistic basis for 2000 SAC federal emergency management agency steel moment frame guidelines. Journal of Structural Engineering, Vol. 128, Issue 4, 2002, p. 526-533.
-
Ramanathan K., Desroches R., Padgett J. E. Analytical fragility curves for multispan continuous steel girder bridges in moderate seismic zones. Transportation Research Record: Journal of the Transportation Research Board, Vol. 2202, 2010, p. 173-182.
-
Xia Y., Wang P., Sun L. M. Neutral axis-based health monitoring and condition assessment techniques for concrete box girder bridges. International Journal of Structure Stability and Dynamics, Vol. 19, Issue 1, 2019, p. 1940015.
-
Hwang H., Jernigan J. B., Lin Y. W. Evaluation of seismic damage to Memphis bridges and highway systems. Journal of Bridge Engineering, Vol. 5, Issue 4, 2000, p. 322-330.
-
Park Y. J., Ang A. H. S. Mechanistic seismic damage model for reinforced concrete. Journal of Structural Engineering, Vol. 111, Issue 4, 1985, p. 722-739.
-
Kowalsky M. J. A displacement-based approach for the seismic design of continuous concrete bridges. Earthquake Engineering and Structural Dynamics, Vol. 31, 2002, p. 719-747.
Cited by
About this article

This research is jointly funded by the Science and Technology Project of Sichuan Province (Grant No. 2019YFG0048), the National Natural Science Foundations of China (Grant No. 51778635 and 51778630), the Natural Science Foundation of Hunan Province (Grant No. 2019JJ40386), and the Fundamental Research Funds for the Central Universities of Central South University (Grant No. 2019zzts608). The above support is greatly appreciated.
