Abstract
Gear meshing dynamic model is the most important part in the whole wind turbine system which is used to carry out operation conditions simulation in off-line case. By simulating the normal gear meshing and the gear meshing with broken teeth in wind turbine dynamic model respectively, the difference in generator current can be observed. The method we propose is to monitor the operating condition of the wind turbine based on the current transmitted to the generator end dynamically according to the meshing of the gear pair. Mechanical parameters have great influence on the system that will be transmitted to asynchronous generator, it works in a quite different approach compared with traditional method on vibration monitoring using sensors.
Highlights
- The mathematical model of the gear pair is constructed based on the difference in stiffness between the broken tooth and the normal state.
- Simulate the change of the wind turbine gear pair status in the offline state, and judge the operating status of the system through the current output of the generator end.
- In the time domain and frequency domain, the distribution and frequency characteristics of the current signal are analyzed by the kernel density estimation method and the envelope method.
1. Introduction
The main mechanical failure [1, 2] of wind turbines occurs on two key components of gears [3] and rolling bearings [4]. The measured physical quantities of conventional fault diagnosis are generally vibration signal [5] related parameters namely displacement, velocity and acceleration. However, by arranging the vibration measuring sensor at the monitoring point for detection, the error is relatively large. Because the position of the sensor often has a certain distance from the vibration source, the influence of the distance on the measurement effect is difficult to estimate and accurately measure [6, 7]. In addition, the vibration displacement measured by the vibration sensor is also affected by the vibration of other equipment in the entire unit, which is coupled and difficult to distinguish. Air vibrations in the monitoring space are neglected in general vibration measurements. However, in actual mechanical operation, high-speed rotating equipment sometimes needs to consider the effects of air vibration. Therefore, the signal measured during the vibration measurement is doped with a large amount of noise unrelated to the vibration signal. Relatively speaking, the current signal [8-10] during the operation of the device is much more stable.
The current signal is accompanied by the entire operation of the wind turbine [11, 12], and the electrical parameters such as current [13-15] and voltage are important parameters of the wind turbine itself, and no additional sensors need to be installed. Its reliability and stability are thus somewhat higher than the vibration measurement process. The motor current signal analysis method [16] is also called Sensorless Detection Method. It was first proposed to be used in the research direction of asynchronous generator operation monitoring and fault diagnosis [17, 18]. This method of analyzing the corresponding signals by using the characteristics of the stator current signal of the motor has been detecting faults of the generator body, such as fault diagnosis of the stator [19], rotor [20] and air gap flux of the generator.
2. Theoretical basis for motor current analysis method
2.1. Planetary gear system dynamics model
The structure of the gearbox [21] in a wind turbine is different from that of a general gearbox. The structure is usually composed of a sun gear, a plurality of planet gears, a ring gear, a planet carrier, etc., and the motion mode [22] in which the ring gear fixes the sun gear rotating around the central axis is the most common. The planetary gears not only rotate around their respective central axes, but also revolve around the central axis of the sun gear. The planetary gear train structure is shown in Fig. 1.
Fig. 1Planetary gear system
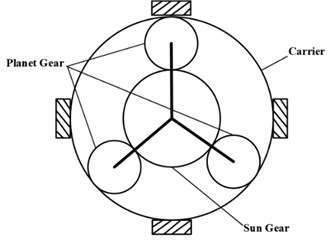
Fig. 2Planetary gear train equivalent mechanical parameters
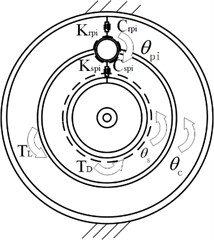
In this paper, a purely torsion model with concentrated parameters is used. As shown in Fig. 2, the gear mesh is considered as spring and damping, also each component only considers the vibration in the torsional direction. Among them, , , , are the meshing stiffness and damping coefficient between the sun gear and the planetary gear, the planetary gear and the inner ring gear respectively, and , and are the rotation angles of the sun gear. and are their input torque and load torque. According to the Lagrange equation, the pure torsional dynamic equation of the system can be showed in Eq. (1):
The first equation in Eq. (1) is obtained by dynamic analysis of the sun gear, the second equation is obtained by dynamic analysis of each planet, and the third equation is planets and planets. A whole kinetic analysis was obtained. , , and represent the elastic meshing force and meshing damping force between the sun gear and the planetary gear, the planetary gear and the ring gear, respectively; represents the equivalent radius of the planet carrier; and are the Base circle radius of sun gear and the planetary gear. Assume that the relative displacement of the sun gear and the planet gear on the meshing line is , and the relative displacement of the planet gear and the ring gear on the meshing line is , resulting in Eq. (2) and Eq. (3):
Substitute Eq. (2) and Eq. (3) into Eq. (1), the dynamic equation of the dynamic system Eq. (4) is obtained:
Among them:
and , and represented as the equivalent mass of the sun gear, planet gear and planet carrier.
From the differential equations Eq. (4), two outputs can be obtained, which are the pitch line displacement caused by the meshing of the sun gear and the planetary gear, and the pitch of the pitch generated by the meshing of the planetary gear and the ring gear. In order to simplify the analysis of the movement of the planetary gear train, only the movement between the sun gear and the planet gears is considered here. Therefore, it can be further simplified here as the meshing motion between a pair of gears. The equations also show that the meshing stiffness and the external exciting force have a certain influence on the output of the system model. The basis of the identification and degree of fault diagnosis can also be determined by the change of these two parameters. Details of the movement of the sun gear-planetary after simplification will be detailed in the next section.
2.2. Simplified sun-planet gear model
Considering the weight of the simplified sun gear-planetary model gear set weight model, the gear is equivalent to a set of springs. By considering a set of intermeshing gears as the object of study, the mathematical expression Eq. (5) of the differential equation of the geared pair:
In dynamic systems, the effect of static and elastic deformation on the overall system can be neglected under certain circumstances. Therefore, the Eq. (5) is simplified to obtain Eq. (6). After this section, if is not specifically emphasized, the default is the relative displacement of the gear mesh in dynamic situations:
It can be known from Eq. (6) that the type of vibration of the gear meshing is a kind of self-excited vibration, and the formula means that the characteristic of the vibration of the gear pair itself can be expressed by the excitation force function. is a modulated signal whose magnitude is determined by the overall stiffness of the gear and the course of the fault function. The function of the meshing stiffness of a normal and non-damaged gear changes with time. Under ideal conditions, it can be regarded as a square wave function; the variation law of depends on the fault type of the gear, if in the event of a broken tooth fault, periodically appears with the frequency of the gear. That is to say, the main cause of gear vibration is the periodic signal generated by and modulation. The meshing stiffness changes as the gears enter during the meshing of the gears, and the meshing period and the meshing frequency are also determined accordingly. Therefore, the change law of the meshing stiffness corresponding to the gears of different types and different coincidence coefficients is also different. Eq. (7) is the gear meshing frequency formula:
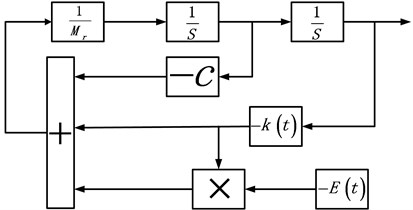
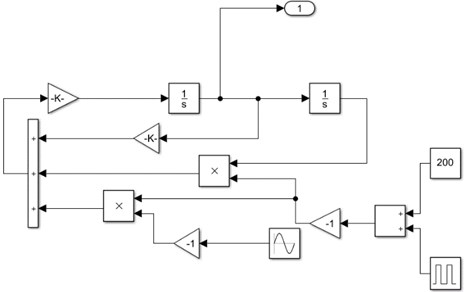
So far, several important parameters required for the calculation in the differential equation Eq. (6) have been discussed clearly. Using the MATLAB/SIMULINK model to solve the above-mentioned differential equation solving process, the corresponding calculation block diagram flow is shown in Fig. 3.
Fig. 3Gear pair calculation
Consider an example, the number of teeth of the large gear is 34, the number of teeth of the small gear is 23, the modulus is 3, the tooth width is 20 mm, and the calculated mass considering the motor mass is 4.5 kg, 200-250 kN, 300 N.s/m. Fig. 4 shows the actual SIMULINK model. Because the time of the broken tooth failure is usually very short, the simulation time here takes 1 s. The input speed of the large gear end is 1200 r/min.
Fig. 4Gear pair Simulink model
It can be known from Eq. (6) that when is set to a constant, the entire dynamic system is in normal motion. The simulation results obtained are shown in Fig. 5. The relative acceleration and relative velocity have a large change in the initial stage of the simulation, but when the whole dynamic system is in the state of steady state operation, both parameters approach a constant value.
Fig. 5Acceleration and speed under normal conditions
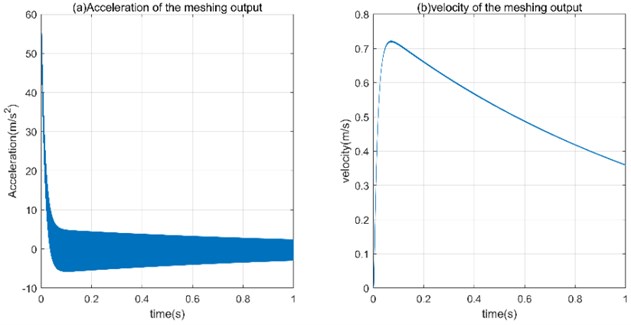
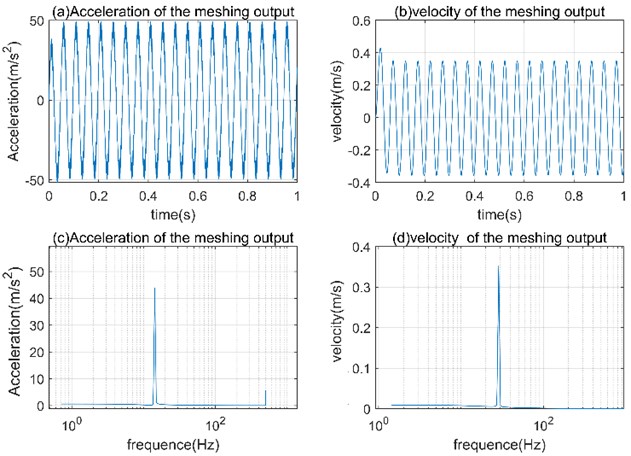
Fig. 6 shows the time and frequency domain waveforms of the relative acceleration and relative velocity produced by the tooth engagement when the broken tooth fault occurs. From the time domain waveform, the amplitude of the relative acceleration is much higher than the relative speed. This is because the gear meshing requires a certain speed, and a short acceleration process is required in the initial simulation stage to meet the meshing condition. The amplitude-frequency curves (c) and (d) of Fig. 6 clearly show that both the relative acceleration and the relative velocity have a frequency that is less than the frequency of the frequency. The theoretical frequency is 20 Hz, and the simulation result is 28.64 Hz, which is in line with the simulation expectation, indicating that the model has certain reliability. Regarding a high-frequency signal appearing in the relative acceleration, it is just a mutual verification of the rapid change of the acceleration in the time-domain waveform, which proves the condition that the meshing needs to be satisfied.
Fig. 6Time domain and frequency domain under broken tooth conditions
2.3. Basic principle of asynchronous generator
Doubly fed Induction Generator are often used in wind turbines for simulation of off-line conditions. Therefore, it is necessary to introduce the relevant theory of asynchronous motor in detail in this section as the theoretical basis for the construction of the subsequent simulation model. According to the AC generator theory, the dynamic characteristics of an asynchronous generator [24] in the - rotating coordinate system can be described by the following equation:
Voltage equation:
where: and are the stator cross-axis voltages respectively; and are the stator cross-axis currents respectively; and are the rotor cross-axis voltages respectively; and are the rotor cross-axis currents respectively; , are fixed, Rotor resistance; and are the orthogonal axis components of the stator flux linkage; and are the orthogonal axis components of the rotor flux linkage; , which is the angular velocity of the - coordinate system relative to the rotor, where and are respectively For motor synchronous speed and rotor angular speed; p is the differential operator, .
Magnetic flux linkage equation:
where: , and are the self-inductance and mutual inductance of the stator and rotor, respectively.
Electromagnetic torque equation:
Motion equation:
where: is the drag torque provided by the wind turbine; is the drag torque provided by the wind turbine; is the moment of inertia of the system
3. Block diagram implementation of digital simulation model
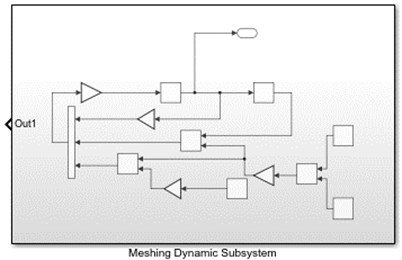
A dynamic model of the gear pair meshing has been established in Fig. 4 of Section 2.2. In this section, the above model is used to package the module using the sub-module packaging tool of MATLAB/SIMULINK. The block diagram after encapsulation is shown in Fig. 7. The normal operating conditions of the system and the broken tooth fault can be simulated by adjusting the parameters of the sub module.
Fig. 7Meshing dynamic subsystem
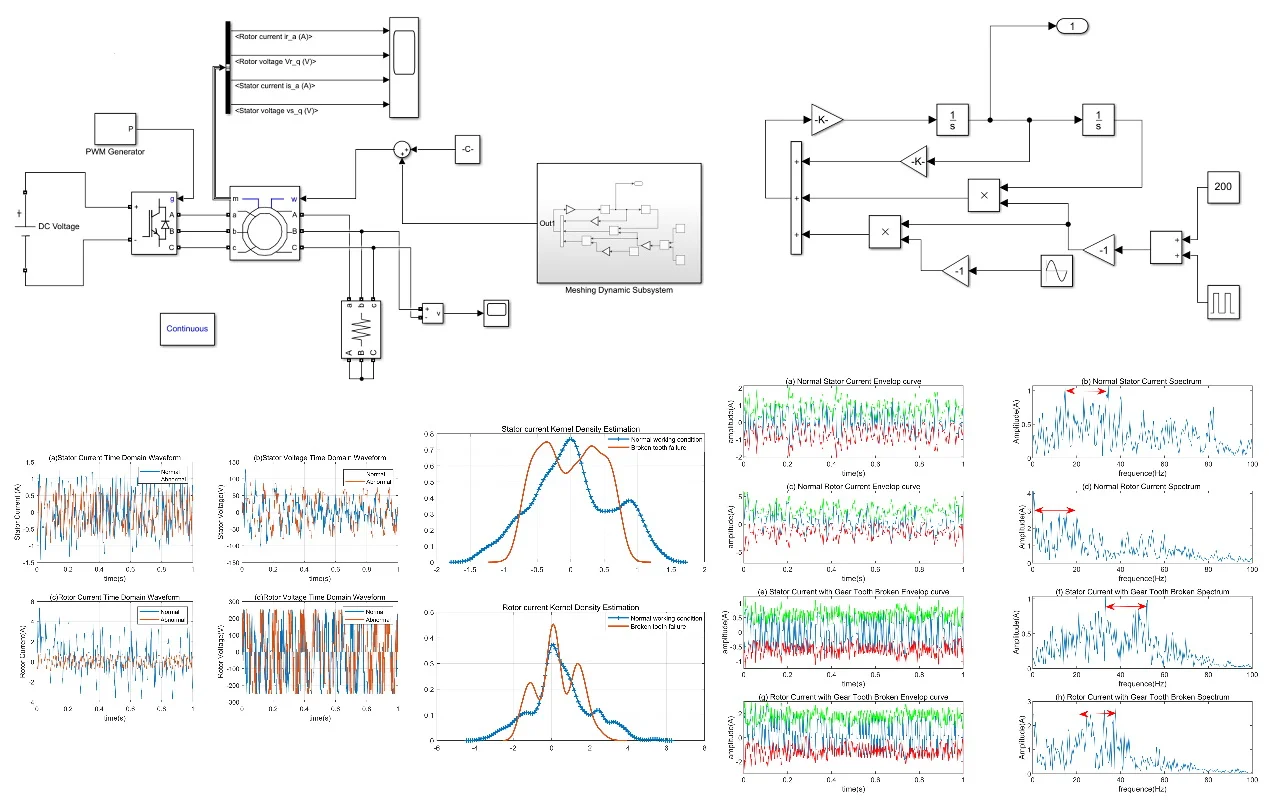
The twin-turbine generator model of the wind turbine is equivalent, and in the off-line condition, it is regarded as an asynchronous generator [23, 24]. Because the networked generator operating conditions are more complex, it is not conducive to the impact on the motor when the mechanical fault occurs, so this simplification will significantly improve the possibility of distinguishing the motor operating conditions. The system simulation model includes generator module, generator rotor variable frequency excitation module, load module, electrical parameter measurement module and gear fault simulation sub-module. The model of the doubly-fed generator is replaced by a wound-type asynchronous motor module to set the operation mode. The stator winding of the generator [25] is connected to the three-phase resistive load, and the PWM power inverter module is used to supply the generator rotor with one-way excitation, which only simulates the off-grid operation. The model built by the final simulation is shown in Fig. 8.
Fig. 8Completion model for system simulation
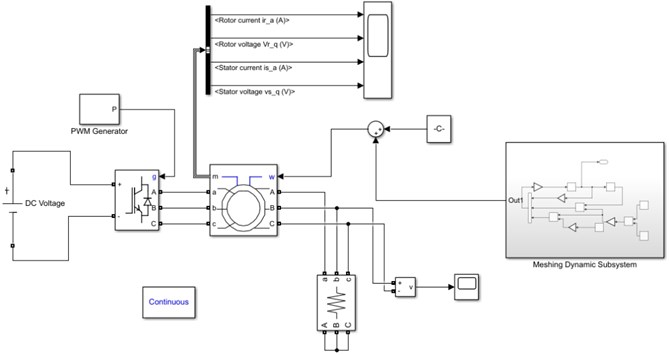
Table 1Asynchronous generator parameter
Parameter | Numerical value | Parameter | Numerical value |
Nominal power | 3000 VA | Stator resistance | 1.9188 ohm |
Line-line voltage | 220 V | Stator inductance | 0.2412 H |
Frequency | 50 Hz | Rotor resistance | 2.5712 ohm |
Pole pairs | 2 | Rotor inductance | 0.2412 H |
Initial conditions | 0 | Mutual inductance | 0.234 H |
The basic parameters required for the simulation system are: generator rated power, rated voltage, rated speed, stator resistance, stator inductance, rotor resistance and inductance converted to the stator side, and stator and rotor mutual inductance. The coordinate system takes the synchronous reference coordinate system [26]. The status is zero. The mechanical input of the generator is set to the speed input, and the output of the gear fault simulation sub-module and the superposition of an average speed are taken. Since the output of the gear failure simulation sub-module is only a velocity fluctuation component, the average velocity value needs to be added. Detailed parameters are described in the Table 1.
4. Discussion and analysis of simulation results
Since the key parameters are the electrical parameters of the generator, the parameters such as electromagnetic power and rotor speed are not concerned, so they are not analyzed in detail. In the variable step size ode45 ordinary differential equations solution used in Matlab 2018b, the relative error between the step sizes does not exceed 1e-3. Because the entire equation system is solved in a variable step size, the sampling frequency is automatically set in Simulink. The four physical parameters of rotor current, rotor voltage, stator current and stator voltage are mainly analyzed in the following two subsections. In the Fig. 4 of Section 2.2, the simulation sub-model is established. The normal working condition of the gear is different from that in the broken tooth state. This difference is expressed by the external exciting force and the meshing stiffness function.
4.1. Time domain waveform of electrical parameters
In Fig. 9(a), the normal stator current waveform [27, 28] and the waveform under the broken tooth fault have significant differences in amplitude. Moreover, due to the excitation frequency, the normal stator current waveform also exhibits a certain periodicity.
Fig. 9Generator current and voltage waveform within a second
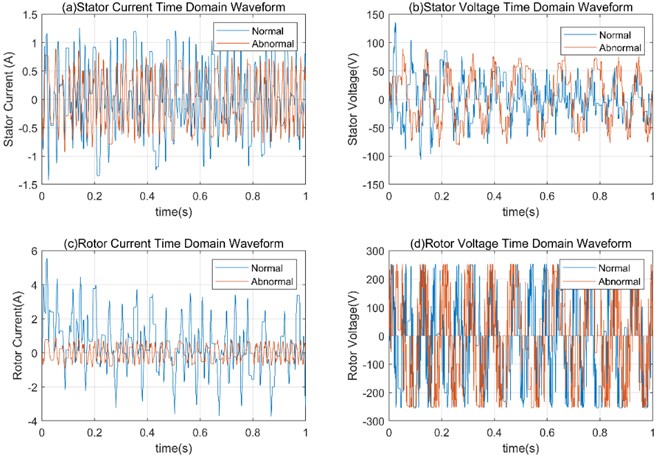
It can be observed from Fig. 9(a) that the effective value of the stator current amplitude in the broken tooth condition fluctuates within 1 A, and the range of the stator current amplitude under normal operating conditions exceeds this value. In Fig. 9(b), The normal working condition has a high stator voltage RMS at startup and gradually stabilizes within 50 V, while the stator voltage effective value in the fault state is about 75 V. The broken tooth fault causes the rms value of the stator voltage to be high. The normal rotor current in Fig. 9(c) differs greatly from the rotor current RMS at fault, and the normal rotor current rms value is about triple the rotor current at fault, with very significant differences. Fig. 9(d) shows that the rotor voltage under normal operating conditions and the rotor voltage under broken teeth have very significant periodicity, the amplitudes are substantially the same, and slight phase shifts can be observed.
In addition, the load on the AC generator was not analyzed in this result. In fact, the RMS of the resistive load line voltage amplitude is a voltage drop under normal operating conditions and broken tooth fault conditions, and the numerical performance is reduced from 200 V to 100 V. This feature can only be used as an indicator for the rational use of the system to determine the operating conditions of the system.
4.2. Kernel density estimation of current signal
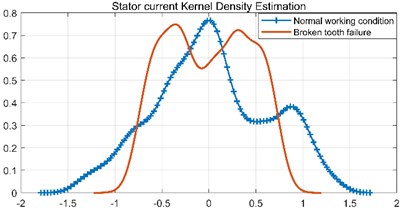
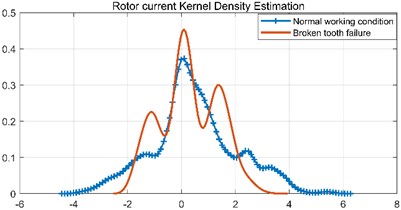
As a common method in non-parametric estimation in probability theory, kernel density estimation (KDE) is used to estimate the unknown density function [29]. In our case, the kernel function we used to analyze current signals is Gaussian kernel function. Applying this method of estimating the density function to the stator current and the rotor current of the generator yields the results shown in Fig. 10. From the Gaussian kernel density estimation of the stator current, it is observed that the current value distribution under normal operating conditions is close to the Gaussian distribution, and the current distribution under the broken tooth fault has two distinct peaks, which are significantly different. The normal operating conditions of the stator current and the current distribution under the breaking condition are the difference between the single peak and the triple peak, respectively, and are also very easy to observe. Therefore, the above analysis by the characteristics of the generator current is possible as a method of fault diagnosis.
Fig. 10Kernel density estimation of stator current and rotor current
4.3. Envelope spectrum and frequency band analysis of current signal
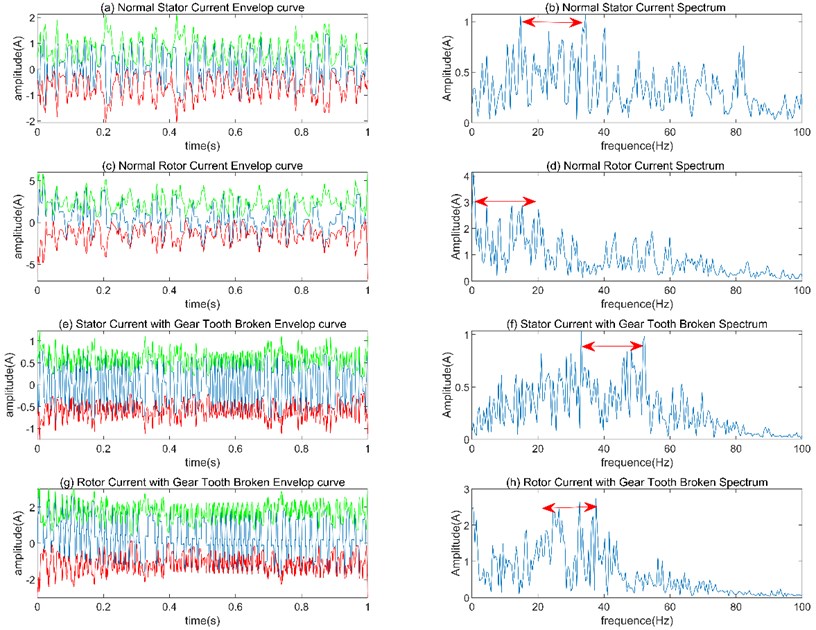
The upper and lower envelope curves of the current amplitude are plotted by smoothing the stator and rotor currents, and the spectrum is plotted by FFT. Fig. 11(a), (c), (e), (g) are the envelope curves of stator current in the normal state, rotor current in the normal state, stator current in the broken tooth state and rotor current in the broken tooth state. The right side (b), (d), (f), (h) of Fig. 11 is their corresponding spectrum. The current envelope in the normal state shows a more pronounced periodicity than the envelope curve in the case of a broken tooth fault, but the range of up and down fluctuations is larger, while the envelope curve in the case of a broken tooth is smoother. Analyzing the spectrogram, it is easy to observe the following features. The normal current spectrum, the main component of both the stator and the rotor, appears lower than the current spectrum of the fault. The main component of the normal stator current is in the range of 15 Hz to 35 Hz, while the frequency of the main component of the broken stator current is 35 Hz to 55 Hz, and the current frequency in the broken state is about 20 Hz higher than the normal frequency. In the same case, the rotor current shows an increase in frequency of the same principal component. In addition to this, the maximum amplitude of the stator current barely decreases under normal and broken teeth, while the amplitude of the rotor shows a significant decrease.
Fig. 11Envelope curve and spectrum of stator current and rotor current
5. Conclusions
Wind turbine mechanical fault diagnosis can be achieved by analyzing the current of the generator and can be used to accurately monitor the operation conditions of the unit. From the point of view of the time-varying mesh stiffness of the gear tooth in the wind turbine gearbox, we explore it influence on the stator and rotor currents of the generator through simulation. This combination of a kinetic model with a circuit model for mechanical diagnosis is effective and does not require additional sensors to measure it. The difference in generator currents under normal and broken gear conditions can be used as a basis for evaluating the operation conditions of the wind turbine.
References
-
Liu W. Y., Tang B. P., Han J. G., et al. The structure healthy condition monitoring and fault diagnosis methods in wind turbines: A review. Renewable and Sustainable Energy Reviews, Vol. 44, 2015, p. 466-472.
-
Liu W. Y. A review on wind turbine noise mechanism and de-noising techniques. Renewable Energy, Vol. 108, Issue 8, 2017, p. 311-320.
-
Walid Touti, Mohamed Salah, Khmais Bacha, et al. An improved electromechanical spectral signature for monitoring gear-based systems driven by an induction machine. Applied Acoustics, Vol. 141, 2018, p. 198-207.
-
Akshat Singhal, Khandekar Meera A. Bearing fault detection in induction motor using fast Fourier transform. IEEE International Conference on Advanced Research in Engineering and Technology, 2013.
-
Liang Xihui, Zuo M. J., Hoseini M. R. Vibration signal modeling of a planetary gear set for tooth crack detection. Engineering Failure Analysis, Vol. 48, 2015, p. 185-200.
-
Salameh Jack P., Cauet Sebastien, Etien Erik, et al. Gearbox condition monitoring in wind turbines: A review. Mechanical Systems and Signal Processing, Vol. 111, 2018, p. 251-264.
-
Satish Mohanty, Karunesh Kumar Gupta, Kota Solomon Raju Hurst based vibro-acoustic feature extraction of bearing using EMD and VMD. Measurement, Vol. 117, 2018, p. 200-220.
-
Moncef Soualhi, Khanh Nguyen T. P., Abdenour Soualhi, et al. Health monitoring of bearing and gear faults by using a new health indicator extracted from current signals. Measurement, Vol. 141, 2019, p. 37-51.
-
Salim Aouabdi, Mahmoud Taibi, Slimane Bouras, et al. Using multi-scale entropy and principal component analysis to monitor gears degradation via the motor current signature analysis. Mechanical Systems and Signal Processing, Vol. 90, 2017, p. 298-316.
-
Ruiliang Zhang, Fengshou Gu, Haram Mansaf, et al. Gear wear monitoring by modulation signal bispectrum based on motor current signal analysis. Mechanical Systems and Signal Processing, Vol. 94, 2017, p. 202-213.
-
Liu W. Y., Han J. G., Lu X. N. Experiment and Performance analysis of the Northwind 100 wind turbine in CASE. Energy and Buildings, Vol. 68, 2014, p. 471-475.
-
Glowacz Adam Acoustic fault analysis of three commutator motors. Mechanical Systems and Signal Processing, Vol. 133, 2019, p. 106-226.
-
Ottewill J. R., Ruszczyk A., Broda D. Monitoring tooth profile faults in epicyclic gearboxes using synchronously averaged motor currents: mathematical modeling and experimental validation. Mechanical Systems and Signal Processing, Vol. 84, 2017, p. 78-99.
-
Bram Corne, Bram Vervisch, Stijn Derammelaere, et al. The reflection of evolving bearing faults in the stator current’s extended park vector approach for induction machines. Mechanical Systems and Signal Processing, Vol. 107, 2018, p. 168-182.
-
Rangel Jose Magdaleno, Barreto Hayde Peregrina, Cortes Juan Ramirez, et al. Hilbert spectrum analysis of induction motors for the detection of incipient broken rotor bars. Measurement, Vol. 109, 2017, p. 247-255.
-
Li Feng, Pang Xinyu, Yang Zhaojian Motor current signal analysis using deep neural networks for planetary gear fault diagnosis. Measurement, Vol. 145, 2019, p. 45-54.
-
Balasubramanian A., Ranganath Muthu Model based fault detection and diagnosis of doubly fed induction generators – a review. Energy Procedia, Vol. 117, 2017, p. 935-942.
-
Megha Singh, Abdul Gafoor Shaik Faulty bearing detection, classification and location in a three-phase induction motor based on Stockwell transform and support vector machine. Measurement, Vol. 131, 2019, p. 524-533.
-
Bouzid Ben Khader M., Champenois G., Tnani S. Reliable stator fault detection based on the induction motor negative sequence current compensation. International Journal of Electrical Power and Energy Systems, Vol. 95, 2018, p. 490-498.
-
Liu Wenyi Design and kinetic analysis of wind turbine blade-hub-tower coupled system. Renewable Energy, Vol. 94, 2016, p. 547-557.
-
Liang X., Zuo M. J., Pandey M. Analytically evaluating the influence of crack on the mesh stiffness of a planetary gear set. Mechanism and Machine Theory, Vol. 76, 2014, p. 20-38.
-
Chen Xiaowang, Feng Zhipeng Time-frequency space vector modulus analysis of motor current for planetary gearbox fault diagnosis under variable speed conditions. Mechanical Systems and Signal Processing, Vol. 121, 2019, p. 636-654.
-
Gurmeet Singh, Naikan V. N. A. Detection of half broken rotor bar fault in VFD driven induction motor drive using motor square current MUSIC analysis. Mechanical Systems and Signal Processing, Vol. 110, 2018, p. 333-348.
-
Yassa N., Rachek M., Houassine H. Motor current signature analysis for the air gap eccentricity detection in the squirrel cage induction machines. Energy Procedia, Vol. 162, 2019, p. 251-262.
-
Frini Marouane, Soualhi Abdenour, Badaoui Mohamed El Gear faults diagnosis based on the geometric indicators of electrical signals in three-phase induction motors. Mechanism and Machine Theory, Vol. 138, 2019, p. 1-15.
-
Liboni Luisa H. B., Flauzino Rogério Andrade, Nunes Ivan Da Silva, et al. Efficient feature extraction technique for diagnosing broken bars in three-phase induction machines. Measurement, Vol. 134, 2019, p. 825-834.
-
Gao Q. W., Liu W. Y., Tang B. P., Li G. J. A novel wind turbine fault diagnosis method based on intergral extension load mean decomposition multiscale entropy and least squares support vector machine. Renewable Energy, Vol. 116, 2018, p. 169-175.
-
Guillen Jesus Rivera R., Perez De Santiago J.-J., Sanchez Juan Amezquita P., et al. Enhanced FFT-based method for incipient broken rotor bar detection in induction motors during the startup transient. Measurement, Vol. 124, 2018, p. 277-285.
-
He Hongwen, Zhou Nana, Sun Chao Efficiency decrease estimation of a permanent magnet synchronous machine with demagnetization faults. Energy Procedia, Vol. 105, 2017, p. 2718-2724.
Cited by
About this article

This research was supported by the National Natural Science Foundation of China (Grant No. 51505202), the 333 Project of Jiangsu Province (2016-III-2808), the Qing Lan Project of Jiangsu Province (QL2016013), the Natural Science Foundation of Jiangsu Province of China (No. 2020), the postgraduate research and practice innovation program of Jiangsu Province of China (2019XKT162).
