Abstract
In order to better solve the problem of automatic identification of quality control line and detection line in the detection of gold standard test strip, this paper proposes to collect the image information of gold standard test strip after color rendering through CMOS sensor, preprocess the obtained information, transform RGB image into gray image, build cloud model in the CIELAB/HSV/HSL space, and apply the improved AdaBoost algorithm to determine the position of detection line and quality control line Place. Compared with the traditional template matching method, it improves the accuracy and accuracy of recognition.
1. Introduction
In recent years, a lot of food safety problems have been exposed in the society, and the national food safety testing standards have also been improved. This also promotes the wide application of gold standard strip in food detection. But the traditional detection method, detection time-consuming, limited accuracy, needs a lot of manpower, at the same time, detection equipment is expensive and so on. This shows that it is of great social significance to develop an instrument which can detect food quickly and qualitatively. In this paper, a new image processing method is proposed based on the existing technology, and an improved AdaBoost algorithm is proposed to automatically find the detection line and quality control line. Compared with the traditional template matching or image corrosion technology, it is more accurate and convenient to determine the position of the quality control line and the detection line, rather than the whole part of the blank area between the quality control line and the detection line in the gold standard test strip. In this way, when calculating the mathematical model of the relationship between the quality control line, the detection line and the solution concentration, the affected blank area can be removed and the accuracy of the results can be improved.
2. Image preprocessing
Due to the reason of the test paper itself, the external light, dust, noise, etc. will interfere with the quality of the image obtained by the camera, resulting in errors in image analysis and affecting the detection results. Therefore, it is necessary to use image filtering method to solve the problem of image noise.
Common filtering methods include mean filtering, median filtering, bilateral filtering, etc.
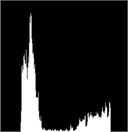
Fig. 1(a) is the image of gold standard test strip collected by CMOS camera after graying. Fig. 1(b) is the image obtained after average filtering of Fig.1.(a).Compared with the original image, the image filters out the background “noise”, but also destroys the details of the image, making the gold standard test strip look particularly fuzzy as a whole. Fig. 1(c) is the image after median filtering in Fig. 1(a).Compared with mean filtering, it protects the detail information of gold standard strip, but the position of detection line and quality control line of gold standard strip is distorted, which will affect the accuracy of detection results. Fig. 1(d) is the image after bilateral filtering. Compared with mean filtering and median filtering, bilateral filtering more truly reflects the image information of gold standard test strip, and the position information of detection line and quality control line is also well preserved. At the same time, compared with the histogram of original image and three filtering methods, we can know that the histogram of bilateral filtering can more simply and accurately extract the quality Characteristic value of control line and detection line. Therefore, the method of bilateral filtering is chosen as the filtering method of image preprocessing.
Fig. 1Image after preprocessing
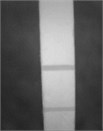
a) Original
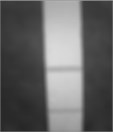
b) Mean filter
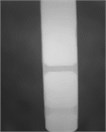
c) Median filter chart
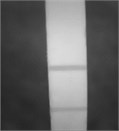
d) Bilateral filter
Fig. 2Histogram
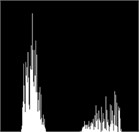
a) Original
b) Mean filter
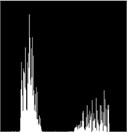
c) Median filter chart

d) Bilateral filtered
3. Automatic positioning technology of detection line and quality control line
3.1. Positioning technology of traditional detection line and quality control line
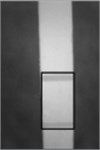
When testing the gold standard test paper, it is necessary to read the characteristic value of the test line and the quality control line, and establish the functional relationship between the test line, the quality control line and the concentration, so it is particularly important to determine the position of the test line and the quality control line. The traditional method to locate the detection line and quality control line mostly uses image corrosion or template matching. However, because the color of the gold standard strip is affected by the combination of antigen and antibody, when the color of the two areas is similar, the position of the quality control line and the detection line cannot be accurately located. For image corrosion, only one line can be located. Even if the adaptive corrosion method is used, the threshold value and the location of two target areas cannot be well determined. For template matching, quality control line, detection line and the background area between the two lines are located. As shown in Fig. 3.
Although this positioning method locates the quality control line and the detection line, it also locates the useless background area. This part is not useful for the concentration calculation, but it will affect the concentration detection results. Therefore, this paper proposes to automatically locate the position of the quality control line and the detection line by matching the neural network and the template.
Fig. 3Template matching method positioning area
3.2. Automatic positioning technology of detection line and quality control line based on improved AdaBoost algorithm
3.2.1. Improvement of weak classifier training algorithm
The training process of weak classifier is to calculate the eigenvalues of all training samples for each feature (),and select a threshold () from the threshold candidate set.Under different bias (),the classification error () of the corresponding weak classifier is minimized. There are two sources of classification errors, namely:
(A) Error caused by misjudgment of quality control line or detection line as non-quality control line or non-detection line.
(B) Error caused by misjudgment of non-quality control line or non-detection line as quality control line or detection line.
Therefore, the classification error can be divided into two parts:
(A) The sum of the weight of the wrong samples of the quality control line or the detection line which is not the quality control line or the detection line:
(B) Misjudge the non-quality control line or non-detection line as the sum of the weight of the wrong samples of the quality control line or detection line:
Among them, is the weight of the -th sample, is the indicative function, when is 1, when is 0.
The current AdaBoost algorithm treats the above two kinds of decision errors equally, but in the pictures collected by the colloidal gold detection device, generally the quality control line and detection line occupy a relatively small area, while the background area is relatively large, so the detection of quality control line and detection line in the image can be regarded as a small probability event, so the probability of class an error is greater than that of class B error Rate. In addition, in the process of strong classifier cascade, only through all strong classifiers can it be judged as quality control line or detection line. That is to say, if a target area, that is, the area of quality control line or detection line, is misjudged as a blank area, that is, the area of nonquality control line or detection line, this area will be excluded forever, and this error can’t be remedied. However, if the blank area is misjudged as the target area in a strong classifier, it is likely to be excluded by a strong classifier at a later level, which shows that this error can be remedied.
In view of the above situation, the training algorithm of weak classifier used in this paper is as follows for 1, 2, 3,…, and is the total number of features:
(1) The eigenvalues of each sample are calculated by the eigenvalue , and these eigenvalues are sorted.
(2) Given a constant , its value range is 0 1.
(3) Calculate the weight and of all positive samples (quality control line and detection line), and the weight and of all negative samples (non-quality control line and detection line); for and 0, 1, 2,…, and is the total number of training samples.
Calculate the weight asof the positive sample before the sample, and the weight as of the negative sample before the sample.
Calculating:
(4) Calculating:
Record and at this time.
(5) Calculate the minimum classification error rate ε, and determine the threshold value and direction sign p of the weak classifier:
It can be seen from the above algorithm that the two cases of classification error are handled separately, which increases the attention to the class an error situation and more conforms to the fact that the target area detects small probability events. To apply the method of training weak classifier to the training process of strong classifier, only the calculation of the classification error of the best weak classifier needs to be changed into the following formula:
Other processes remain the same.
3.2.2. Improvement of sample weight updating rule
If the current weak classifier , a training sample is not classified correctly, that 1, –1 or –1, 1, that is –1, then there are:
and , 1, don’t consider the normalization factor , .
If the current weak classifier classifies a training sample correctly, then –1, –1 or 1, 1, that is, 1, then there are:
and don’t consider the normalization factor .
The updating rule of sample weight of AdaBoost algorithm guarantees to focus on difficult samples, but its disadvantages are also obvious:
(1) When the training samples contain some difficult samples, AdaBoost algorithm is difficult to classify these samples correctly. AdaBoost algorithm will focus on analyzing the difficult samples, which will lead to a sharp increase in the weight of the samples, leading to the phenomenon of degradation.
(2) When the training samples contain some difficult samples, the weight of correctly classified samples decreases exponentially due to the weight normalization, and the performance of the algorithm decreases with the increase of the number of iterations.
This paper improves the AdaBoost algorithm’s weight update rule, that is, in each training, the average value and standard deviation of the sample weight are calculated. When the deviation between the weight of the wrong sample and the average weight m is greater than 3, the weight is no longer increased. The specific algorithm is as follows:
(1) Given the training samples (, ), (, ),…, (, ), where +1, –1 represents the samples of quality control line and detection line (positive samples) and non-quality control line and detection line (negative samples), respectively, determine the weak classifier and the number of iterations (that is, the number of weak classifiers);
(2) Initialize sample weight: , , , where is the total number of training samples.
(3) For 1:.
(A) Using the weak classifier algorithm, calculate the weighted classification error, find the weak classifier corresponding to the minimum classification error, record , , , which are respectively , , . The classification error of this optimal weak classifier can be expressed as:
(B) Order , where , , are the minimization factors of .
(C) Order:
Calculate the average value and standard deviation of the sample weight of the current round:
(D) Update sample weight:
where is the normalization factor.
(4) Get the final strong classifier .
4. Experimental results and analysis of improved AdaBoost algorithm
In order to test the effectiveness of the improved algorithm, C++ language is used to implement the algorithm before and after the improvement. A set of detection card images with different concentrations and attributes are collected, and the improved algorithm is used to train the samples.
(1) Classifier C1, the existing AdaBoost algorithm trains a cascade classifier with a total of 10 layers.
(2) Classifier C2, an AdaBoost algorithm with improved weight updating method, also trains a cascade classifier with a total of 10 layers.
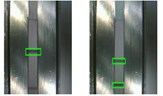
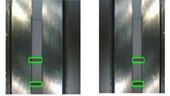
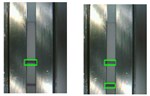
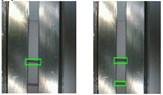
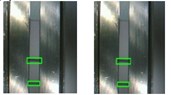
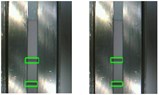
As shown in Fig. 4, there are seven groups of detection results, the left side is the classification results of C1 classifier trained by traditional algorithm, and the right side is the classification results of C2 classifier trained by improved algorithm. According to Fig. 4(a, c, e), compared with traditional algorithm, the target area selected by improved algorithm is more accurate. According to Fig. 4(b), compared with traditional algorithm, the improved algorithm is selected by improved algorithm the target area is more accurate. To sum up, the improved algorithm for quality control line and detection line detection accuracy is higher than the traditional algorithm.
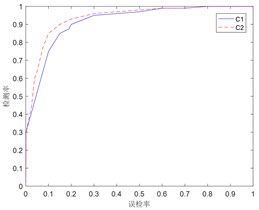
The ROC curve of Fig. 5 can be obtained through a large number of tests. It can be seen from Fig. 5 that under the same false detection rate, the classifier obtained by the improved AdaBoost algorithm has higher detection rate, which shows that the improved algorithm has stronger generalization ability.
Fig. 4Comparison of algorithm before and after improvement
a)
b)
c)
d)
e)
f)
Fig. 5ROC curve
5. Conclusions
In this paper, the method of image acquisition is used to collect the information of the gold standard test paper card. Firstly, the image collected is preprocessed by bilateral filtering, and then the quality control line and detection line in the gold standard test paper card are automatically located by the improved AdaBoost algorithm, and the effectiveness of the algorithm is verified by experiments. Compared with the traditional template matching method, on the premise of ensuring the correct rate of image matching, the improved AdaBoost algorithm can remove the useless blank area and only select the quality control line and detection line area, which will make the concentration value of the sample to be measured more accurate and reduce the introduction of invalid data in the calculation.
References
-
Xu F., Di X., Ming X., et al. Quantum dot-based immunochromatography test strip for rapid detection of campylobacter jejuni. Journal of Nanoscience and Nanotechnology, Vol. 13, Issue 7, 2013, p. 4552-4559.
-
Ang S. H., Thevarajah T. M., Woi P. M., et al. A lateral flow immunosensor for direct, sensitive, and highly selective detection of hemoglobin A1c in whole blood. Journal of Chromatography B Analytical Technologies in the Biomedical and Life Sciences, Vols. 1015-1016, 2016, p. 157-165.
-
Lifang Jia The Research of the Smart and Quantitative Analytical Colloidal Gold Instruments Based on Image Processing. China Ji Liang University, 2014.
-
Jianwei Bi Design of Colloidal Gold Test Instrument Based on CCD Image Processing. China Ji Liang University, 2016.
-
Gonzalez Rafael C., Woods Richard E. Digital Image Processing. Third Edition, Publishing House of Electronics Industry, 2012.
About this article

This work was supported by Jilin Provincial Science and Technology Program (No. 20180201090GX); The Education Department of Jilin Province Science and Technology Program (No. JJKH20200778KJ).
