Abstract
Cancer is one of the leading causes of death in the world. Breast cancer is the most common form of cancer among women and is responsible for 15 % of all cancer related deaths. Though there are significant advancements in cancer treatment strategies, clinical tumour treatment methods currently employed are often accompanied by severe side effects as they induce damage to the normal cells along with the cancer cells. The alterations in the biophysical and biomechanical properties of a cell as it undergoes transformation from a normal to cancerous cell results in changes in its dynamic characteristics. These changes can be utilised to induce selective cytotoxicity of tumour cells. In the present study, two simulation models (homogenous and non-homogenous) of normal (MCF-10A) and cancerous (MCF-7) breast cells are developed. A finite element approach using Ansys is adopted to investigate the variation in dynamic characteristics of the cells using the two modelling approaches. Results indicate that the natural frequencies of cells modelled as a homogenous system is greater than that of cells whose sub-cellular material properties are considered for analysis. A comparison of the first four natural frequencies using the two modelling approaches for both MCF-10A and MCF-7 cells are illustrated and the corresponding mode shapes reported. A plot highlighting the variation in the natural frequencies of MCF-10A and MCF-7 using the two modelling approaches is presented.
1. Introduction
The human body contains trillions of cells which grow, divide and die in a conventional manner. Replication of DNA during the interphase stage forms a crucial step in cell division. An error during the replication process induces changes in the genome of the cell, giving rise to mutations. Some mutations result in uncontrolled, uncoordinated and undesirable cell division leading to cancer. The World Health Organisation (WHO) estimates that breast cancer is the most common form of cancer affecting 2.1 million women each year and is responsible for 15 % of all cancer related deaths. The treatment methods currently employed to treat cancer include chemotherapy, radiation therapy, surgery, targeted therapy and immunotherapy. Radiotherapy and chemotherapy are known to induce damage to healthy cells surrounding the tumour, giving rise to numerous side effects which negatively impacts the quality of life of a patient. The transformation of a normal cell to cancerous cell is accompanied by various alterations in its biophysical and biomechanical properties. Mechano-oncology deals with utilisation of the differences in these properties at cellular and subcellular levels to specifically target and annihilate cancer cells. Dynamic analysis of cancer cells by experimental, mathematical and simulation approaches gives an insight into understanding the differences in mechanical properties and helps in development of treatment strategies that specifically target tumor cells. Experimental analysis in vivo is extremely expensive, requires considerable amount of skill and time, thereby posing a great challenge to researchers. Experimental constraints have led to researchers adopting a numerical and analytical approach to study cellular systems. On the other hand, simulation approach allows effective and detailed analysis of the biomechanical behaviour of cellular systems. Simulation techniques potentially reduce the cost and time in the development and analysis of cellular models due to ease of use and accessibility, helping a larger scientific community to illustrate the effects of different inputs on a biological system.
The mechanical properties of cancer cells are investigated using various techniques. Lekka et al., [1, 2] used scanning force microscopy and atomic force microscopy to determine the elastic properties of human epithelial cells and melanoma cells respectively. Suresh [3] utilised micropipette aspiration to study the properties of various normal and cancer cells. Literature mentioned above reveals that there is significant reduction in the stiffness of cancer cells as compared to their normal counterparts. This change in stiffness results in a corresponding variation of its dynamic characteristics such as its natural frequency. Precise knowledge of tumour specific frequencies would provide a firm platform for the development of new treatment strategies that would either target cancer cells or aid the existing techniques to treat cancer. Numerous attempts are made to specifically target cancer cells due to the change in their natural frequency as compared to that of normal cells. Jagannathan et al., [4] modelled and analysed breast cancer cells, MCF-7 (Michigan Cancer Foundation-7) and prostate cancer cells, LNCap (Lymph Node Carcinoma of the Prostate) to determine their natural frequencies. Geltmeier et al., [5] determined the natural frequencies of normal breast cells, MCF-10A (Michigan Cancer Foundation-10A) and cancerous (MCF-7) breast cells and utilized low frequency ultrasound to specifically target and destroy breast tumour cells (MCF-7). Roberts [6] made use of histotripsy as an ablative therapy to annihilate preclinical models of normal prostate cells (benign prostatic hyperplasia or BPH). Zimmerman et al., [7] utilised radiofrequency electromagnetic fields that are amplitude-modulated at tumour specific frequencies, to disrupt the mitotic spindle and inhibit cell division. Vadalà et al., [8] presented a review on employing pulsed electromagnetic field (PEMF) and possibility of it being combined with other available therapies to treat various types of cancers. Fraldi et al., [9] developed a frequency-based hypothesis for mechanically targeting and selectively attacking cancer cells. A mechanical model of the cell comprising of various sub-cellular elements is utilised in evaluating the frequency response of the cell. Schuster et al., [10] carried out an investigation to study the effect of low, medium and high energy density ultrasound at three individual frequencies on inhibiting the growth of cancer cells.
The literature review indicates that there is very little information provided on the modelling techniques used to generate the cellular models and the boundary conditions applied for analysis. Obscurity exists in the variation of natural frequencies of cells obtained by considering or neglecting the mechanical properties of subcellular elements. In the present study, an effort is made to develop two models, namely a non-homogenous model and a homogeneous model to investigate the dynamic characteristics of normal and cancerous breast cells. Material properties of subcellular elements are taken into account in the case of non-homogenous model whereas the cell is assumed to have uniform material properties throughout for the homogenous model. A comparison of the natural frequencies for the two models of MCF-10A and MCF-7 is reported.
2. Modelling and simulation
The shape of cells in general is hard to define. Extensive variability in cell size and shape is noticed in tumour cells. Based on reported literature on the study of breast cells, the shape of the cell is assumed to be spherical [4, 5] with appropriate modifications in geometry and boundary conditions. Two types of breast cells, namely MCF-10A and MCF-7 are considered for the current study. Homogenous (model I) and non-homogenous (model II) simulation models of both MCF-10A and MCF-7 are developed using SolidWorks. The interaction of cells with the physiological environment associated with cell culture is taken into consideration while modelling the cell and incorporating the necessary boundary conditions.
A cell consists of numerous sub-cellular elements out of which the cell membrane, cytoplasm and nucleus largely contribute to its functioning. The cell membrane is the outermost layer of the cell, made up of a phospholipid bilayer implanted with proteins. The cytoplasm is a viscous material that is present between the membrane and nucleus. The nucleus, which controls the major functioning of the cell, is considered as a rigid body, suspended in the cytoplasm.
For model I, the cell is assumed to be composed of a homogenous material and the material properties of individual sub-cellular elements namely the cytoplasm, cell membrane and nucleus are neglected as shown in Fig. 1.
Model II is developed considering the properties of sub-cellular elements as shown in Fig. 2. The properties of the cytoskeleton are assumed to be incorporated within the material properties of the cytoplasm. The geometrical parameters and material properties considered for the model I is listed in Table 1.
Fig. 1Model I
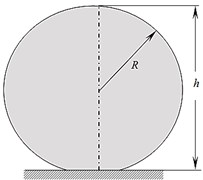
Fig. 2Model II
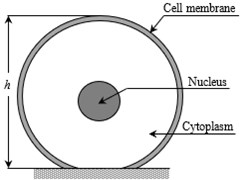
Table 1Geometrical parameters and material properties of model I [4, 5]
Cell type | Volume (µm3) | Density (g/cm3) | Young’s modulus (kPa) | Poisson’s ratio |
MCF-10A | 678 | 1.020 | 0.730 | 0.49 |
MCF-7 | 3,375 | 0.994 | 0.425 | 0.49 |
It is observed that there is a considerable difference in the mechanical properties between healthy and cancer breast cells. This difference forms a key factor that can be used to distinguish a cancer cell from a normal cell. The geometrical parameters and mechanical properties considered for the cellular constituents of model II is tabulated in Table 2.
Table 2Geometrical parameters and material properties of model II [5]
Cellular elements | Parameter | MCF-7 | MCF-10A |
Cell | Volume (µm3) | 3,375 | 678 |
Cell membrane | Thickness (nm) | 200 | 200 |
Density (g/cm3) | 1.5 | 1.5 | |
Young’s Modulus (kPa) | 1.125 | 1.1 | |
Poisson’s ratio | 0.49 | 0.49 | |
Cytoplasm | Density (g/cm3) | 1.05 | 1.05 |
Young’s modulus (kPa) | 0.15 | 0.25 | |
Poisson’s ratio | 0.49 | 0.49 | |
Nucleus | Volume (µm3) | 1122 | 360 |
Density (g/cm3) | 1.3 | 1.3 | |
Young’s modulus (kPa) | 0.15 | 0.25 | |
Poisson’s ratio | 0.49 | 0.49 |
Based on the known volume of the cell, the radius for MCF-10A and MCF-7 is calculated. Boundary conditions pertaining to the in-vitro cell culture environment in a petri dish are considered for analysis. The radius of the contact area between the cell membrane and the petri dish is calculated using the formulation from [11] as:
where is the radius of contact area at the base, is the initial radius of the cell, 100 µJ/m2, corresponds to adhesion energy per unit area, 300 Pa.s, is the viscosity and 10 s, is the characteristic deforming time.
Due to the interaction of the cell with the surface of the petri dish, the height of the cell reduces while the volume of the cell remains constant. The height of the cell is calculated using the simple relation:
where is the obtained height of the cell, is the radius of the cell after spreading and is the radius of the base of the cell in contact with the petri dish.
The developed models are imported into Ansys Workbench for analysis. An adaptive size function is used to mesh the model. A fixed boundary condition is incorporated between the base of the cell and the surface of the petri dish. The inter-cellular adhesion is determined from [12] and is given a fixed boundary condition. Modal analysis is carried out for models I and II of MCF-10A and MCF-7 and the corresponding natural frequencies are extracted. The natural frequencies corresponding to the first four modes for both model I and II of MCF-10A are tabulated in Table 3.
Table 3Natural frequencies for model I and II of MCF-10A
Mode | Natural frequency (Hz) | % error | |
Model I | Model II | ||
1 | 22,942 | 14,240 | 37.93 |
2 | 22,998 | 14,284 | 37.89 |
3 | 30,563 | 21,047 | 31.13 |
4 | 36,471 | 21,797 | 40.23 |
Table 4Natural frequencies for model I and II of MCF-7
Mode | Natural frequency (Hz) | % error | |
Model I | Model II | ||
1 | 9,611 | 5,768 | 39.98 |
2 | 9,657 | 5,799 | 39.95 |
3 | 12,854 | 8,718 | 32.17 |
4 | 16,469 | 9,406 | 42.88 |
The natural frequencies corresponding to the first four modes for models I and II of MCF-7 are presented in Table 4 along with the percentage error in the natural frequencies.
As observed in Tables 3 and 4, an approximate 36 % error in natural frequencies is observed between model I and II due to the difference in the modelling technique adopted for dynamic analysis. A comparison between the natural frequencies obtained for model I of MCF-10A and MCF-7 is displayed in Table 5.
Table 5Comparison of natural frequencies for model I of MCF-10A and MCF-7
Mode | Natural frequency (Hz) | % reduction in natural frequency | |
MCF-10A | MCF-7 | ||
1 | 22,942 | 9,611 | 58.11 |
2 | 22,998 | 9,657 | 58.01 |
3 | 30,563 | 12,854 | 57.94 |
4 | 36,471 | 16,469 | 54.84 |
Table 6Comparison of natural frequencies for model II of MCF-10A and MCF-7
Mode | Natural frequency (Hz) | % reduction in natural frequency | |
MCF-10A | MCF-7 | ||
1 | 14,240 | 5,767.6 | 59.49 |
2 | 14,284 | 5,798.8 | 59.40 |
3 | 21,047 | 8,718.1 | 58.58 |
4 | 21,797 | 9,405.9 | 56.84 |
The natural frequencies corresponding to the first four modes for model II of MCF-10A and MCF-7 are compared and presented in Table 6.
From Tables 5 and 6, it is observed that there is approximately a 60 % reduction in the natural frequencies as the cell undergoes transformation from a healthy to a cancer cell.
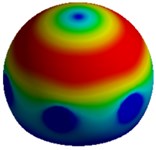
Figs. 3 and 5 indicate that the first and second natural frequencies for model I of both the cells correspond to a lateral mode of vibration along the and direction of the system respectively. A twisting mode shape about the vertical axis -axis is observed for the third natural frequency of the system. Finally, the fourth mode shape shows an axial mode of vibration along the -direction.
Fig. 3First 4 mode shapes for model-I of MCF-10A

a) Mode I, 22,942 Hz
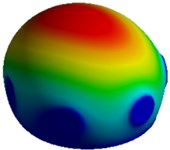
b) Mode II, 22,998 Hz
c) Mode III, 30,563 Hz
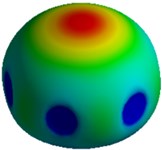
d) Mode IV, 36,471 Hz
Fig. 4First 4 mode shapes for model-II of MCF-10A

a) Mode I, 14,240 Hz
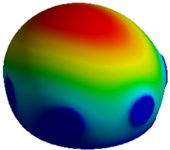
b) Mode II, 14,284 Hz
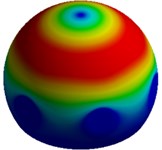
c) Mode III, 21,047 Hz
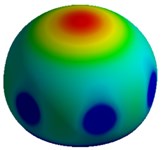
d) Mode IV, 21,797 Hz
Fig. 5First 4 mode shapes for model-I of MCF-7

a) Mode I, 9,611 Hz
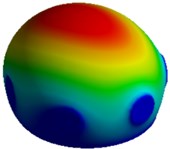
b) Mode II, 9,657 Hz
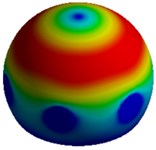
c) Mode III, 12,854 Hz
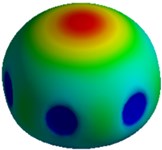
d) Mode IV, 16,469 Hz
Fig. 6First 4 mode shapes for model-II of MCF-7

a) Mode I, 5,768 Hz
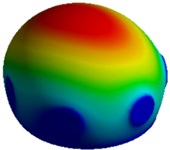
b) Mode II, 5,799 Hz
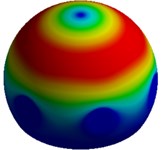
c) Mode III, 8,718 Hz
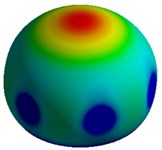
d) Mode IV, 9,406 Hz
Figs. 4 and 6 represent the fundamental mode shapes for model II of MCF-10A and MCF-7. A lateral mode of vibration in the and direction of the system is observed for the first and second natural frequencies respectively. Similar to model I, the third mode shape depicts a twisting mode of vibration about the axis of the system. The 4th mode is observed to be an axial mode of vibration along the -axis.
Figs. 7 and 8 graphically show the error in natural frequencies for first four modes of Model I and II of MCF-10A and MCF-7 respectively.
Fig. 9 graphically represents the reduction in natural frequencies for the first four modes of Model I of MCF-10A and MCF-7. Fig. 10 graphically demonstrates the reduction in natural frequencies for the first four modes of Model II of MCF-10A and MCF-7.
Fig. 7Natural frequencies of Model I and II of MCF-10A
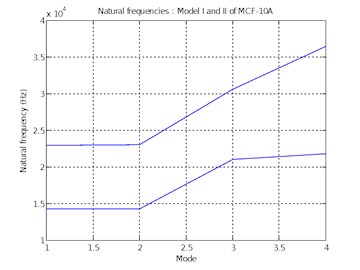
Fig. 8Natural frequencies of Model I and II of MCF-7
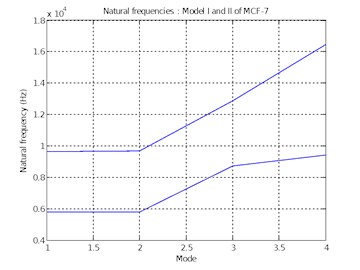
Fig. 9Natural frequencies of Model I of MCF-10A and MCF-7
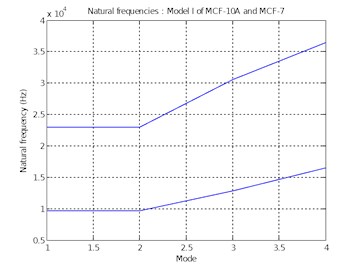
Fig. 10Natural frequencies of Model II of MCF-10A and MCF-7
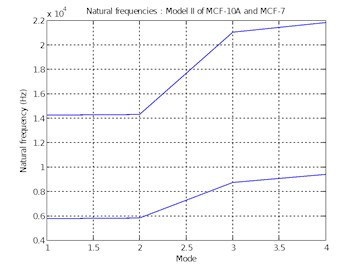
It is noticed that the natural frequencies of MCF-10A is about 2.4 times that of MCF-7. The reduction in natural frequencies observed in the case of cancer cells is attributed to the decrease in its stiffness as the cell turns cancerous.
3. Conclusions
The current study establishes a basic model of an adherent breast cell for the purpose of modelling and simulation. Homogeneous and non-homogeneous models are developed to evaluate the dynamic characteristics of normal and cancerous breast cells. Results indicate that the natural frequencies of cells that are modelled as a homogeneous system is approximately 36 % more than that of the cells whose sub-cellular material properties are considered for analysis. The natural frequencies of normal breast cells (MCF-10A) is found to be about 2.4 times that of breast tumour cells (MCF-7). This difference in natural frequencies due to increased cellular mass and decreased stiffness of cancer cells can be exploited for the development of new strategies that specifically identify and target cancer cells.
References
-
Lekka M., Laidler P., Gil D., Lekki J., Stachura Z., Heynkiewicz A. Z. Elasticity of normal and cancerous human bladder cells studied by scanning force microscopy. European Biophysics Journal, Vol. 28, 1999, p. 312-316.
-
Lekka M., Pogoda K., Gostek J., et al. Cancer cell recognition-mechanical phenotype. Micron, Vol. 43, Issue 12, 2012, p. 1259-1266.
-
Suresh S. Biomechanics and biophysics of cancer cells. Acta Biomaterialia, Vol. 3, Issue 4, 2007, p. 413-438.
-
Jaganathan Saravana Kumar, Subramanian Aruna Priyadarshni, et al. Natural frequency of cancer cells as a starting point in cancer treatment. Current Science, Vol 110, Issue 9, 2016, p. 1828.
-
Geltmeier A., Rinner B., Bade D., et al. Characterization of dynamic behaviour of MCF7 and MCF10A cells in ultrasound field using modal and harmonic analyses. PLoS ONE, Vol. 10, Issue 8, p. e0134999.
-
William Roberts W. Development and translation of histotripsy: current status and future directions. Current Opinion in Urology, Vol. 24, Issue 1, 2014, p. 104-110.
-
Zimmerman Jacquelyn W., Jimenez Hugo, Pennison Michael J., et al. Targeted treatment of cancer with radiofrequency electromagnetic fields amplitude-modulated at tumor-specific frequencies. Chinese Journal of Cancer, Vol. 32, Issue 11, 2013, p. 573-581.
-
Vadalà M., Morales Medina J.-C., Vallelunga A., Palmieri B., Laurino C., Iannitti T. Mechanisms and therapeutic effectiveness of pulsed electromagnetic field therapy in oncology. Cancer Medicine, Vol. 5, Issue 11, 2016, p. 3128-3139.
-
Fraldi M., Cugno, Deseri L., Dayal K., Pugno N. M. A frequency-based hypothesis for mechanically targeting and selectively attacking cancer cells. Journal of the Royal Society Interface, Vol. 12, Issue 111, 2015, https://doi.org/10.1098/rsif.2015.0656.
-
Schuster A., Schwab T., Bischof M., Klotz M., Lemor R., Degel C., Schafer K. H. Cell specific ultrasound effects are dose and frequency dependent. Annals of Anatomy, Vol. 195, Issue 1, 2013, p. 57-67.
-
Cuvelier D., Thery M., Chu Y. S., Dufour S., Thiery J. P., Bornens M., Nassoy P., Mahadevan The universal dynamics of cell spreading. Current Biology, Vol. 17, Issues 17-8, 2007, p. 694-699.
-
Horzum Utku, Ozdil Berrin, Okvur Devrim Pesen Step-by-step quantitative analysis of focal adhesions. MethodsX, Vol. 1, 2014, p. 56-59.
