Abstract
This paper focuses on analyzing the effect of geometrical parameters on structural performance of the ventilated brake disc. Multi-objective optimization through response surface methodology was deployed for improving the structural performance of ventilated brake discs. Simulation runs were designed based on central composite design technique. The second order regression models correlating the geometry parameters with maximum deformation and equivalent stress were developed. ANOVA was performed to test the significance of disc geometry parameters. The deformation and equivalent stress were influenced by flange outer peripheral radius. While the spigot radius had a significant effect on the deformation but not on equivalent stress. Also, the mounting surface radius influenced the equivalent stress developed on the ventilated brake disc rotor. The multi-objective optimization of geometrical characteristics for minimum deformation (4.2332 µm) and minimum equivalent stress (4.00989 MPa) yielded significant reduction in total deformation and equivalent stress i.e., 10.28 % and 9.12 % respectively at optimal levels of geometrical parameters.
1. Introduction
Ventilated brake discs were originally tested on racing cars in 1960s and are extensively used in automobile and railway brake system since then. Owing to its lighter weight than solid discs ventilated brake discs prove to provide better results during a braking event. Brake disc with better cooling performance controls the rise in temperature and prevents thermal-related problems such as hot judder caused by the thermal deformation of the disc, rapid wearing of the pad and vapor lock of the brake oil. Also, additional heat transfer occurs on the surface of the vent hall. These ventilated brake discs require rapid cooling performance and robust structural design for which strength and stiffness are prime design criteria. These design criteria can be met by optimizing the parameters such as loading, geometry and material of the disc.
Among these loading is considered as noise factor while geometry and material are control factors which are controlled at different levels for optimizing the braking performance. Several studies on the simulation and analysis of structural and thermal performance of ventilated brake discs have been reported. W. S. Chung et al. [1] reported the mathematical model for the braking pressure in a hydraulic brake system. Thermo-mechanical analysis was performed to estimate the temperature rise and thermal deformation of a disc. The deformation of the disc material gradually increased in the radial direction and reached its peak at the circumference region. M. Duzgun et.al [2] investigated thermal behavior of three different ventilated brake disc designs: cross-drilled (CD), cross-slotted (CS), and cross-slotted with side groove (CS-SG) discs. It was observed that the thermal stress increased with ventilation application and was localized at the inner and outer peripheral of the disc. S. S. Kang et al. [3] performed thermal deformation analysis and thermal stress analysis due to heat transfer for ventilated and solid brake disc. It was reported that increase in vent diameter led to increase in thermal deformation in the diameter direction and the same decreased in axial direction. Ali Belhoeine et al. [4] developed a numerical model to analyze the thermal behavior of a solid and ventilated discs. Three types of cast irons (AL, FG25, FG20 and FG15) with varying carbon contents were considered for analysis. It was noted that the quality of results concerning to the temperature field was influenced by several parameters such as design, number of elements, type of materials braking mode implemented and so on. Ali Belhocine et al. [5] analyzed the thermo-mechanical behavior of the dry contact between the brake disc and pads during a braking event. The thermal stresses were increased with increase in the contact pressure of the pad were which in turn caused the crack propagation and fracture of the bowl. S. P. Jung et al. [6] developed the mathematical model to evaluate the braking power and heat flux generated during a braking process. The cross section of the disc geometry was optimized using response surface methodology and the maximum temperature of the disc was found to be linearly correlated with the design parameters. Numerous studies have focused on prediction models to encounter engineer problems [8, 9]. Box and Hunter (1957) suggested that a second-order response surface design should be rotatable i.e., the variance of predicted response was constant on spheres. Rotatability is a reasonable basis for the selection of a response surface design [10]. The response surface methodology (RSM) with employment of Taguchi’s orthogonal arrays, central composite design, regression models and so on, have shown significant improvements in process optimization [11-13].
From the literature review [1-13], it was found that some of the authors have reported the structural and thermal performance of various brake discs. Since, the structural performance of ventilated brake discs is a function of disc geometry and material, a comprehensive study on optimal combination of geometric parameters needs to be carried out. In this process, optimizing a single performance characteristic may deteriorate the other design criteria and hence, simultaneous optimization of the structural performance characteristics becomes necessary. Hence, this paper focuses on analyzing the effect of geometric parameters on the total deformation and equivalent stresses developed in the ventilated brake disc. Simulation runs were designed based on central composite design technique. Regression models were developed to correlate the structural performance characteristics with the geometric parameters. ANOVA was performed to test the significance of disc geometry parameters. Multi- objective optimization was carried out using Response surface methodology.
2. Finite element modelling and simulation of ventilated brake disc
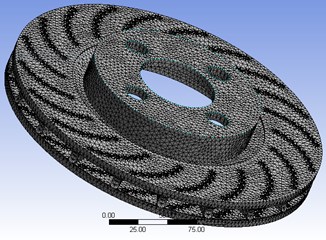
The ventilated brake disc was modelled using Solidworks 14.0 and then exported to Ansys 17.0 for structural analysis. The material of the ventilated brake disc was considered as grey cast iron [4]. Standard dimensions of the disc rotor were in compliance with the works of Jung et al [7]. The finite element model was created using 4-node tetrahedron element and had 2,29,433 nodes and 1,35,999 elements. The finite element model of the ventilated brake disc is as shown in Fig. 1.
Fig. 1Finite element model of the ventilated brake disc
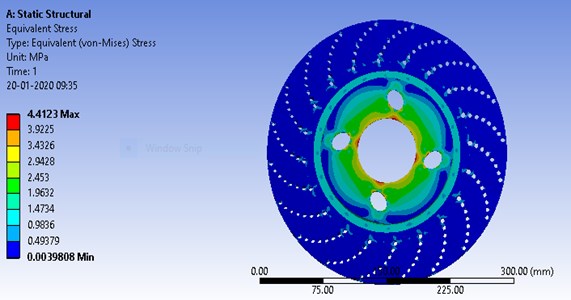
A force of 500 N and a twisting moment of 120 N/m were applied on the contact region between the disc and the pad. “The total deformation and equivalent stress were developed on the surface of the disc as shown in Fig. 2 and 3 respectively”. The maximum deformation of 0.0047 mm and the maximum stress developed of 4.4123 MPa was obtained which requires to be further reduced by performing the optimization of disc geometry parameters.
Fig. 2Deformed ventilated brake disc
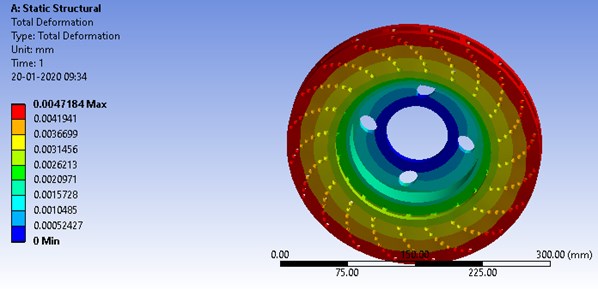
Fig. 3Equivalent stress distribution on the ventilated brake disc
3. Simulation based on central composite design (CCD)
CCD is the most popular class of design for fitting a second order model. The practical deployment of a CCD arises through sequential experimentation. In this technique the distance of the axial runs from the design center and the number of center points . In the present study, a three-level five-factor central composite rotatable design was employed. The independent input variables chosen are as shown in Fig. 4 and their description is as follows
– A – Friction ring inner peripheral radius.
– B – Flange outer peripheral radius.
– C – Spigot radius.
– D – Mounting face radius.
– E – Spigot parallel (distance between lower end point of B and end of spigot considered parallelly) as shown in Fig. 4.
The variables and their levels were chosen based on limited literature available on ventilated brake disc geometry optimization [6]. The levels adopted for each of the geometrical characteristics are as shown in Table 1. A total of 32 simulation runs are performed based on central composite full factorial design table. The experimental design and simulation results are as shown in Table 2.
Fig. 4Geometry of the brake disc
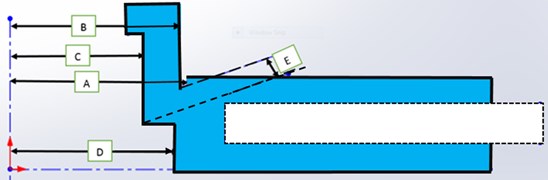
Table 1Levels of geometry parameters
Parameter | Levels | ||
–1 | 0 | 1 | |
A (mm) | 84.0 | 86.0 | 88.0 |
B (mm) | 76.0 | 77.25 | 78.5 |
C (mm) | 70.0 | 71.25 | 73.5 |
D (mm) | 84.0 | 86.0 | 88.0 |
E (mm) | 5.0 | 6.0 | 7.0 |
Table 2Central composite design table with response functions
Run order | Pt type | Blocks | A (mm) | B (mm) | C (mm) | D (mm) | E (mm) | Maximum deformation (µm) | Equivalent stress (MPa) |
1 | 1 | 1 | 88 | 76.00 | 70.00 | 88 | 7 | 4.7894 | 5.0215 |
2 | 1 | 1 | 84 | 78.50 | 73.50 | 88 | 5 | 4.8128 | 4.4239 |
3 | 0 | 1 | 86 | 77.25 | 71.75 | 86 | 6 | 4.7184 | 4.4123 |
4 | 1 | 1 | 88 | 76.00 | 73.50 | 84 | 7 | 5.3555 | 4.4504 |
5 | 1 | 1 | 88 | 76.00 | 70.00 | 84 | 5 | 4.7208 | 4.6278 |
6 | 1 | 1 | 84 | 78.50 | 70.00 | 84 | 5 | 4.2858 | 4.1818 |
7 | 1 | 1 | 88 | 78.50 | 70.00 | 84 | 7 | 4.5247 | 4.6099 |
8 | –1 | 1 | 86 | 77.25 | 71.75 | 88 | 6 | 5.0392 | 4.8298 |
9 | 1 | 1 | 84 | 76.00 | 73.50 | 84 | 5 | 4.6319 | 4.2790 |
10 | 1 | 1 | 88 | 78.50 | 73.50 | 84 | 5 | 4.9339 | 4.3839 |
11 | 0 | 1 | 86 | 77.25 | 71.75 | 86 | 6 | 4.7184 | 4.4123 |
12 | 0 | 1 | 86 | 77.25 | 71.75 | 86 | 6 | 4.7184 | 4.4123 |
13 | –1 | 1 | 86 | 77.25 | 70.00 | 86 | 6 | 4.3332 | 4.2839 |
14 | 1 | 1 | 84 | 78.50 | 73.50 | 84 | 7 | 4.8156 | 4.5007 |
15 | –1 | 1 | 86 | 77.25 | 71.75 | 84 | 6 | 4.5008 | 4.5627 |
16 | 1 | 1 | 88 | 78.50 | 73.50 | 88 | 7 | 4.5843 | 4.2471 |
17 | –1 | 1 | 86 | 76.00 | 71.75 | 86 | 6 | 4.9074 | 4.4954 |
18 | 1 | 1 | 84 | 76.00 | 73.50 | 88 | 7 | 5.4003 | 4.6386 |
19 | –1 | 1 | 86 | 78.50 | 71.75 | 86 | 6 | 4.4741 | 4.3266 |
20 | 0 | 1 | 86 | 77.25 | 71.75 | 86 | 6 | 4.7184 | 4.4123 |
21 | –1 | 1 | 84 | 77.25 | 71.75 | 86 | 6 | 4.6423 | 4.4487 |
22 | –1 | 1 | 88 | 77.25 | 71.75 | 86 | 6 | 4.7106 | 4.6444 |
23 | 0 | 1 | 86 | 77.25 | 71.75 | 86 | 6 | 4.7184 | 4.4123 |
24 | 1 | 1 | 84 | 76.00 | 70.00 | 88 | 5 | 4.7529 | 4.8197 |
25 | 1 | 1 | 88 | 76.00 | 73.50 | 88 | 5 | 5.5335 | 4.9806 |
26 | –1 | 1 | 86 | 77.25 | 73.50 | 86 | 6 | 4.9275 | 4.5922 |
27 | 1 | 1 | 84 | 76.00 | 70.00 | 84 | 7 | 4.5632 | 4.5127 |
28 | 0 | 1 | 86 | 77.25 | 71.75 | 86 | 6 | 4.7184 | 4.4123 |
29 | –1 | 1 | 86 | 77.25 | 71.75 | 86 | 7 | 4.6967 | 4.6785 |
30 | –1 | 1 | 86 | 77.25 | 71.75 | 86 | 5 | 4.7019 | 4.2214 |
31 | 1 | 1 | 84 | 78.50 | 70.00 | 88 | 7 | 4.3118 | 4.2702 |
32 | 1 | 1 | 88 | 78.50 | 70.00 | 88 | 5 | 4.4485 | 4.4695 |
4. ANOVA and regression model
To test the significance of the geometrical parameters ANOVA was performed at 95 % confidence interval for maximum deformation and equivalent stress as shown in Table 3 and 4.
The maximum deformation was influenced by the parameters A, B, C, D and the interactions AD, AE, BD, CD and DE. Equivalent stress was influenced by the parameters , B, D, D2 and the interaction BD. R-squared () values obtained for maximum deformation and equivalent stress were 95.85 % and 85.51 % respectively showed high correlation between the geometrical parameters considered and the responses.
Table 3Analysis of variance for maximum deformation
Source model | DOF | Adj SS | Adj MS | F-value | P-value | |
A | 1 | 0.000000 | 0.000000 | 11.09 | 0.007 | Significant |
B | 1 | 0.000001 | 0.000001 | 69.27 | 0.000 | Significant |
C | 1 | 0.000001 | 0.000001 | 105.02 | 0.000 | Significant |
D | 1 | 0.000000 | 0.000000 | 10.39 | 0.008 | Significant |
E | 1 | 0.000000 | 0.000000 | 0.27 | 0.611 | |
A2 | 1 | 0.000000 | 0.000000 | 0.00 | 0.994 | |
B2 | 1 | 0.000000 | 0.000000 | 0.05 | 0.829 | |
C2 | 1 | 0.000000 | 0.000000 | 0.55 | 0.472 | |
D2 | 1 | 0.000000 | 0.000000 | 2.21 | 0.165 | |
E2 | 1 | 0.000000 | 0.000000 | 0.13 | 0.727 | |
AB | 1 | 0.000000 | 0.000000 | 4.02 | 0.070 | |
AC | 1 | 0.000000 | 0.000000 | 0.21 | 0.658 | |
AD | 1 | 0.000000 | 0.000000 | 8.72 | 0.013 | Significant |
AE | 1 | 0.000000 | 0.000000 | 6.39 | 0.028 | Significant |
BC | 1 | 0.000000 | 0.000000 | 1.76 | 0.212 | |
BD | 1 | 0.000000 | 0.000000 | 16.80 | 0.002 | |
BE | 1 | 0.000000 | 0.000000 | 3.29 | 0.097 | |
CD | 1 | 0.000000 | 0.000000 | 0.97 | 0.035 | Significant |
CE | 1 | 0.000000 | 0.000000 | 0.44 | 0.520 | |
DE | 1 | 0.000000 | 0.000000 | 8.59 | 0.014 | Significant |
Error | 11 | 0.000000 | 0.000000 | - | - | |
Lack of fit | 6 | 0.000000 | 0.000000 | - | - | |
Pure error | 5 | 0.000000 | 0.000000 | - | - | |
Total | 31 | 0.000003 | - | - | - |
The CCD based second order regression model which is represented in Eq. (1):
where, coefficients of the regression model are represented as (constant), (linear effects), (interaction effects), (quadractic effects), (radom error). The second order regression model for maximum deformation and equivalent stress that are shown in Eq. (2) and Eq. (3) respectively.
Considering the significance of linear, quadratic and interaction effects of the geometrical parameters which were tested for adequacy through ANOVA, “the response surface model thus obtained is as shown in Eq. (2) and Eq. (3):
Table 4Analysis of variance for maximum equivalent stress
Source model | DOF | Adj SS | Adj MS | F-value | P-value | |
A | 1 | 0.10273 | 0.102725 | 5.91 | 0.033 | Significant |
B | 1 | 0.32323 | 0.323235 | 18.60 | 0.001 | Significant |
C | 1 | 0.00502 | 0.005020 | 0.29 | 0.602 | |
D | 1 | 0.14080 | 0.140804 | 8.10 | 0.016 | Significant |
E | 1 | 0.01632 | 0.016320 | 0.94 | 0.353 | |
A2 | 1 | 0.00678 | 0.006777 | 0.39 | 0.545 | |
B2 | 1 | 0.01968 | 0.016982 | 0.98 | 0.344 | |
C2 | 1 | 0.00772 | 0.007723 | 0.44 | 0.519 | |
D2 | 1 | 0.10059 | 0.100586 | 5.79 | 0.035 | Significant |
E2 | 1 | 0.00479 | 0.004791 | 0.28 | 0.610 | |
AB | 1 | 0.01541 | 0.015407 | 0.89 | 0.367 | |
AC | 1 | 0.03281 | 0.032806 | 1.89 | 0.197 | |
AD | 1 | 0.00006 | 0.000062 | 0.00 | 0.953 | |
AE | 1 | 0.00769 | 0.007687 | 0.44 | 0.520 | |
BC | 1 | 0.02700 | 0.027003 | 1.55 | 0.239 | |
BD | 1 | 0.21532 | 0.215319 | 12.39 | 0.005 | Significant |
BE | 1 | 0.00399 | 0.003991 | 0.23 | 0.641 | |
CD | 1 | 0.00005 | 0.000047 | 0.00 | 0.959 | |
CE | 1 | 0.01864 | 0.018639 | 1.07 | 0.323 | |
DE | 1 | 0.07805 | 0.078050 | 0.49 | 0.058 | |
Error | 11 | 0.19120 | 0.017382 | – | – | |
Lack of fit | 6 | 0.19120 | 0.031867 | – | – | |
Pure error | 5 | 0.00000 | 0.00000 | – | – | |
Total | 31 | 1.31953 | – | – | – |
5. Results and discussions
5.1. The influence of geometric parameters on the maximum deformation and equivalent stress of ventilated brake disc
The main effects plot obtained for maximum deformation and equivalent stress is as shown in the Figs. 5-6. Maximum deformation increased from 0.0047 to 0.00485 mm with increase in inner peripheral radius of friction ring from 84 mm to 86 mm. This may be attributed to the fact that deformation increases in radial direction and reaches its peak in circumferential region as indicated by Chung et al. [1]. As the outer peripheral radius of the flange increased from 76 mm to 78.5 mm maximum deformation decreased significantly from 0.00495 to 0.00455. With increase in spigot radius from 70 mm to 73.5 mm maximum deformation increased significantly from 0.0045 mm to 0.0050 mm. Variation in maximum deformation remained insignificant with increase in mounting surface radius from 84 mm to 86 mm but showed an increase from 0.00468 to 0.00487 mm when the mounting surface radius increased from 86 mm to 88 mm. The variation occurring in maximum deformation through spigot parallel remained insignificant.
Equivalent stress increased from 4.45 to 4.60 MPa with increase in inner peripheral radius of friction radius from 84 to 88 mm whereas with increase in outer peripheral radius of the flange from 76 to 78.5 mm it decreased significantly from 4.65 to 4.37 MPa. Equivalent stress variation remained insignificant with increase in spigot radius. Variation in equivalent stress remained insignificant with increase in mounting surface radius from 84 to 86mm but showed an increase 4.42 to 4.63 MPa when the mounting surface radius increased from 86 to 88 mm. The variation occurring in equivalent stress with increase in spigot parallel distance remained insignificant from 5 to 6 mm but increased from 4.4 to 4.54 MPa when the spigot parallel distance increased from 6 to 7 mm.
Fig. 5Main effects plot for total deformation corresponding to each geometrical parameter
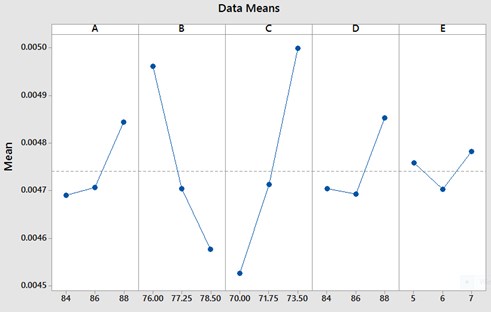
Fig. 6Main effects plot for equivalent stress corresponding to each of the geometrical parameter
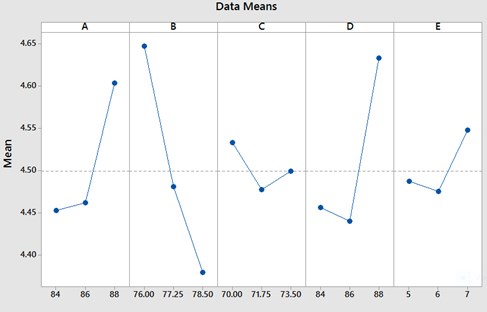
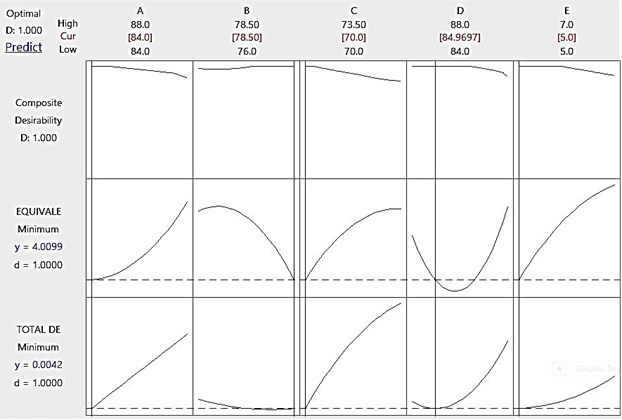
Fig. 7Optimum levels of geometrical parameters
5.2. Optimization of geometrical parameters through response surface methodology
For multi-response optimization desirability function approach was used. For each response, a desirability function assigns a value 0 to 1. While 0 represents completely undesirable vale and 1 composite desirability value represents the ideal response value [7]. With composite desirability function equal to 1, the response surface optimizer yielded the least deformation of 4.2332 µm and minimum equivalent stress of 4.00989 MPa, thereby reducing the total deformation by 10.28 % and reducing the equivalent stress by 9.12 % by simultaneously optimizing deformation and equivalent stress with the geometrical parameters : Friction ring inner peripheral radius of 84.0 mm, Flange outer peripheral radius, 78.50 mm, Spigot radius 70.00 mm, Mounting face radius 84.9697 mm and spigot parallel distance of 5.0 mm. The optimum levels of parameters for minimum deformation and minimum equivalent stress were obtained using response surface optimizer through Minitab 17 as depicted in Fig. 7.
6. Conclusions
The ventilated brake disc was analyzed for maximum deformation and equivalent stress. The static structural analysis yielded a maximum deformation of 0.0047 mm and the maximum stress of 4.4123 MPa. The second order regression models corresponded to geometrical parameters (A, B, C, D and E) with 95.85 % and 85.5 % for maximum deformation and equivalent stress respectively. The deformation and equivalent stress were influenced by flange outer peripheral radius. While the spigot radius had a significant effect on the deformation but not on equivalent stress. Also, the mounting surface radius influenced the equivalent stress developed on the ventilated brake disc rotor. The multi-objective optimization of geometrical characteristics for minimum deformation (4.2332 µm) and minimum equivalent stress (4.00989 MPa) yielded the optimal levels of parameters at friction ring inner peripheral radius of 84.0 mm, flange outer peripheral radius 78.50 mm, spigot radius 70.00 mm, mounting face radius 84.9697 mm and spigot parallel distance 5.0 mm. In future, effect of geometrical parameters on thermo-mechanical characteristics of the brake disc rotor will the conducted.
References
-
Chung Won Sun, et al. Numerical analysis method to estimate thermal deformation of a ventilated disc for automotive. Journal of Mechanical Science and Technology, Vol. 24, 2010, p. 2189-2195.
-
Duzgun Mesut, et al. Investigation of thermo-structural behaviors of different ventilation applications on brake discs. Journal of Mechanical Science and Technology, Vol. 26, 2012, p. 235-240.
-
Kange Sung-Soo, et al. Thermal deformation and stress analysis of disk brakes by finite element method. Journal of Mechanical Science and Technology, Vol. 26, 2012, p. 2133-2137.
-
Ali Belhocine, Abd Rahim, Abu Bakar, Oday Ibraheem Abdullah Structural and contact analysis of disc brake assembly during single stop braking event. Transactions of the Indian Institute of Metals, Vol. 68, 2015, p. 403-410.
-
Ali Belhocine, Mostefa Bouchetara Thermal- mechanical coupled analysis of a brake disc rotor. Heat and Mass Transfer, Vol. 49, 2013, p. 1167-1179.
-
Jung Sung Pil, Kim Young Guk, Park Tae Won A study on thermal characteristic analysis and shape optimization of a ventilated disc. International Journal of Precision Engineering and Manufacturing, Vol. 13, 2012, p. 57-63.
-
Bharatish A., Kishore Kumar B., Rajath R., Murthy Narasimha H. N. Investigation of effect of C02 laser parameters on drilling characteristics of rocks encountered during mining. Journal of King Saud University - Engineering Sciences, Vol. 31, Issue 4, 2019, p. 395-401.
-
Aydin Shishegarana, Mohammad Reza Khalili, Behnam Karami, Timon Rabczuke, Arshia Shishegaran Computational predictions for estimating the maximum deflection of reinforced concrete panels subjected to the blast load. International Journal of Impact Engineering, Vol. 139, 2020, p. 103527.
-
Ebtehaj Isa, et al. Combination of sensitivity and uncertainty analyses for sediment transport modeling in sewer pipes. International Journal of Sediment Research, Vol. 35, 2020, p. 157-170.
-
Box G. E. P., Hunter J. S. Multifactor experimental designs for exploring response surfaces. Annals of Mathematical Statistics, Vol. 28, 1957, p. 195-242.
-
Khuri A. I., Mukhopadhyay S. Response surface methodology. WIREs Computational Statistics, Vol. 2, 2009, p. 128-149.
-
Kaur S., Sarkar B. C., Sharma H. K. Optimization of enzymatic hydrolysis pretreatment conditions for enhanced juice recovery from guava fruit using response surface methodology. Food and Bioprocess Technology, Vol. 2, 2009, p. 96-100.
-
Asokan Pappu, Vijay Kumar Thakur, Ravi Patidara Shyam, Asolekard R., Saxena M. Recycling marble wastes and jarosite wastes into sustainable hybrid composite materials and validation through response surface methodology. Journal of Cleaner Production, Vol. 240, 2019, p. 118249.
Cited by
About this article

