Abstract
When the shear wall and two orthogonal frame beams cannot intersect, a special steel reinforced concrete (SRC) cantilever structure was designed. The cyclic load test on 1:2 scale model was completed and the hysteretic loop, the ductility coefficient, the strength reduction coefficient and the equivalent viscous damping coefficient were obtained, showing that the SRC cantilever structure has agreeable seismic performance. The cracks generated by cyclic load are obliquely intersected with the frame beam, demonstrating that the SRC cantilever structure fails due to combined shear, bending and torsion.
1. Introduction
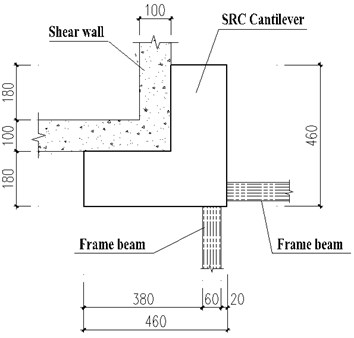
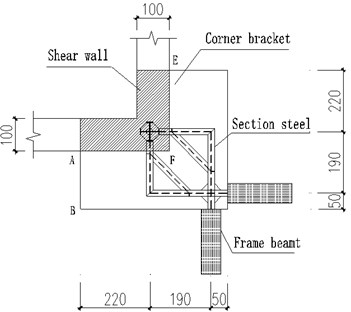
The South China International Port Service Center is a high-rise building with irregular frame-shear wall structure, having about 1000 apartments. Each apartment has an attic, so the net space for each apartment is strictly required. The floor consists of a large reinforced concrete (RC) plate with thickness of 200 mm, supported by orthogonal RC beams with 600 mm square section. At the corner area of RC core tube shear wall, the orthogonal frame beams cannot be connected with the shear wall, so a special steel reinforced concrete (SRC) cantilever structure (Fig. 1) was designed according to the position relationship between shear wall and frame beams and the dimension requirements based on results of structural analysis, which avoids the difficulty in arranging attics in more than 1/4 apartments if the oblique frame beams are adopted.
Fig. 1SRC cantilever connects frame beams and shear wall /cm
Under the action of huge values of vertical force and bending moment transferred from the frame beams, shear force, bending moment and torsional moment will be generated in sections paralleling to each side of shear wall or frame beam. Since there are no design guidelines and relevant calculation formulas in codes on SRC structures under combined bending, shear and torsion [1-4], it is necessary not only to carry out static test research on the load transfer mechanism, failure mode and bearing capacity of the newly designed SRC cantilever structure, but to carry out cycle loading tests on seismic study. Although some experimental researches on torsional behaviour and bearing capacity [5-9] have been completed, most of them focus on pure torsional and strength calculation under static loads [5-8]. For this specially designed SRC cantilever structure, the static load test has been completed [5] showing that the bearing capacity and deflection were met the requirements specified in design codes, so the seismic performance of SRC cantilever structure needs further study.
In this article, the experimental research on the newly designed SRC cantilever structure under cyclic load was completed to obtain the seismic performance parameters, such as hysteretic curve, ductility coefficient, loop stiffness and effective viscous damping coefficient, so that the SRC cantilevered structure can be safely used in real high-rise buildings.
2. Test model
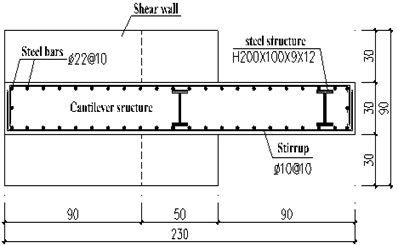
The design loads needed to be transferred from end of each RC frame beam to shear wall include vertical force 1280 kN and bending moment 1300 kN⋅m. The designed SRC cantilever structure (Fig. 1) has length and width of 4600 mm and thickness of 600 mm, and the inserted steel structure with section of H400×200×18×24 (mm). To facilitate the transportation and applying loads of the test model, the scale ratio 1:2 of the prototype was adopted, Fig. 2 shows the dimensions and the arrangement of steel bars and steel structure (H200×100×9×12, Q345) in sections paralleling to frame beam, in which concrete C35 and longitudinal steel bras 22-Ø 22 mm@100 (HRB 335) and stirrups Ø10 mm@100 were adopted.
In order to simulate the end loads of the frame beams, two RC cantilever beams with length of 700 mm and width of 300 mm were made at the position of the frame beam, and their height were the same as that of the SRC cantilever structure (Fig. 2(a)).
Fig. 2Test model of SRC cantilever /cm
a) Dimension
b) Arrangement of steel bars and steel structure
3. Loading system
Fig. 3 shows the layout of loading system of SRC cantilever structure model, and the displacement extensometer was arranged below the intersection point of two frame beams. Due to the space limitation of the loading equipment, the loads of the two loading points on each frame beam in Fig. 3 were combined, that is, a loading steel plate was arranged between the two loading points and the jack load was applied to the loading plate.
According to the Specifications for Seismic Test of Buildings [10], the test was controlled by load before yielding and displacement after yielding. The initial load at the end of the cantilever structure model was 300 kN (there are two loading points in Fig. 3), and then the load was repeated step by step with the increment of 50 kN until yield (the obvious inflection point on the hysteresis curve is taken as the judgment standard). The vertical displacement of the corresponding displacement measuring point at the time of yielding is assumed to be , after yielding, the yield displacement is used as the level difference for loading, and the cyclic loading of each stage is 3 times until the failure of the test model (it reaches the maximum bearing capacity and drops below 85 % of the maximum bearing capacity).
Fig. 3Loading system/cm
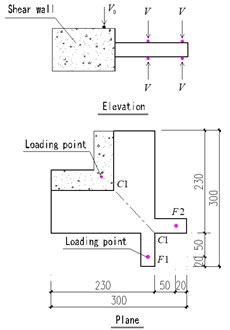
Fig. 4Picture of test loading
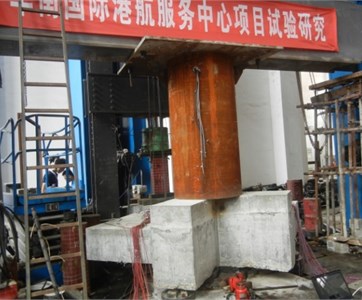
Fig. 4 shows the test loading device. The load test was carried out on a 2000 t multifunctional press in the National Engineering Laboratory of Central South University. Because the model is in the state of large eccentric force when the cantilever part is loaded ( in Fig. 3), an axial force is required to be applied at the top of the shear wall before exerting . is provided by the press and is provided by another separate loading system (back jacking system in Fig. 4). The test model is 90 cm and the loading device of the press cannot descend to the top of the model, so a 1.8 m high steel pipe was arranged on the top of the shear wall of the model.
4. Loading test process and failure characteristic
Before the loading test, 8000 kN was exerted over shear wall part firstly, then the initial cyclic load 300 kN was applied. When 350 kN, the first crack appeared in point C1 and extended perpendicular to C1C2 (Fig. 3, Fig. 5(a)). During cyclic load 350 kN-700 kN, more cracks developed paralleling approximately to the initial crack and the crack width increased to 0.08-0.09 mm. At 750 kN, the existing cracks propagated and widened quickly showing that the model reached yielding strength, the corresponding displacement at intersection point of two cantilevers was 24.52 mm. Then, the cyclic load was applied depending on .
At 1150 kN, the cracks in convex corner of shear wall widened tremendously and the model reached the maximum strength. Fig. 5 shows the distribution of cracks generated by cyclic loading (bird view) when the load was removed where the crack width retracted, which illustrates that most of the cracks are perpendicular approximately to the center line C1C2 (Fig. 3). The characteristics of crack distribution that most of the cracks are obliquely intersected with frame beam (Fig. 5) demonstrates that the cantilever structure fails due to combined shear, bending and torsion.
Fig. 5Cracks generated by cyclic loading (bird view)
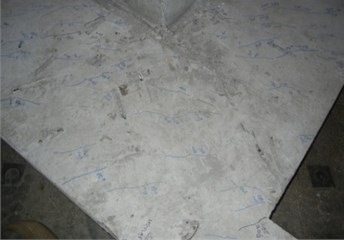
a) Cracks around corner of shear wall
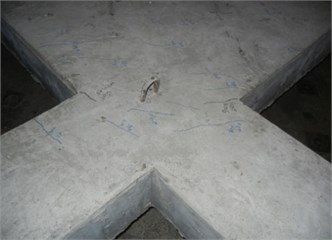
b) Cracks near frame beams
5. Experimental results and analysis
The load-displacement skeleton curve is shown in Fig. 6, in which the vertical displacement at intersection point of two cantilevers is 24.52 mm corresponding to yielding strength 375 kN, displacement of 99.18mmcorresponding to the ultimate strength 575 kN.
Fig. 6Load versus displacement skeleton curve
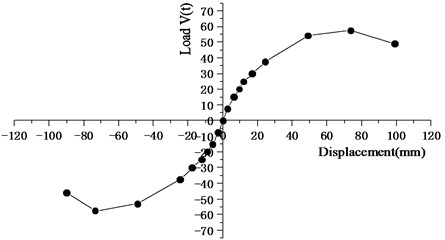
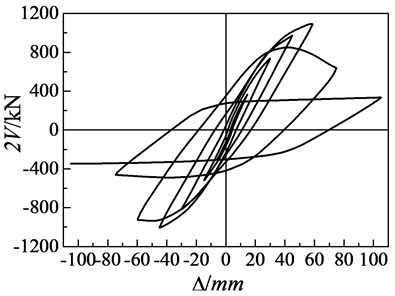
Fig. 7 is the load-displacement hysteretic curve of test model, showing that the hysteretic loop is full and the energy dissipation capacity of the structure is good. When reaching the maximum load, the hysteretic loop is quite full with a slight pinch phenomenon, which indicates that the energy dissipation capacity is slightly reduced. The main reason is that the cracks in the cantilevered structure at the corner have a closing process at first, which leads to energy consumption
Fig. 7Load versus displacement hysteretic curve
The ductility coefficient and strength reduction coefficient of cantilever structure model are shown in Table 1. In Table 1, the ductility coefficient is 4.044 and the strength reduction coefficient is 0.852, showing that the cantilever structure has agreeable seismic performance.
Table 1Ductility coefficient and strength reduction coefficient
Yielding displacement (mm) | Ultimate displacement (mm) | Ductility coefficient | Strength reduction coefficient |
24.52 | 99.18 | 4.044 | 0.852 |
Fig. 8 shows the curve of the loop stiffness of the cantilever structure with the number of loading cycles. The loop stiffness decreases with the increases of load, and the degenerating rate of the loop stiffness is basically proportional to the load.
Fig. 8Load versus loop stiffness
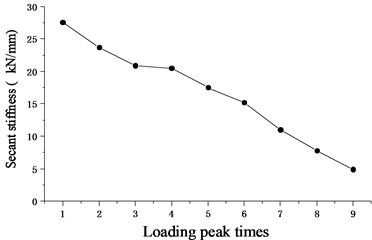
Table 2 shows the equivalent viscous damping coefficient corresponding to vertical displacements. According to the table 2, the equivalent viscous damping coefficient of the cantilever structure is between 0.073 and 0.128, and 0.128 corresponds to the maximum displacement, showing that the cantilever structure has good seismic performance.
Table 2Equivalent viscous damping coefficient
Displacement | ||||
Viscous damping coefficient | 0.073 | 0.128 | 0.133 | 0.128 |
6. Conclusions
In high-rise buildings it is often encountered that the shear wall and two orthogonal frame beams cannot intersect, so the SRC cantilever structure was used commonly as a typical connection. Based on the completed cyclic load test on 1:2 scale model of designed SRC cantilever structure, following conclusions are made:
1) The cracks generated by cyclic load are obliquely intersected with the frame beam or side of shear wall at failure state show that the SRC cantilever structure fails due to combined shear, bending and torsion.
2) The obtained shape of hysteretic loop, ductility coefficient, strength reduction coefficient and equivalent viscous damping coefficient show that the SRC cantilevered structure has agreeable seismic performance.
References
-
GB 50017:2017. Standard for Design of Steel Structures. Ministry of Housing and Urban Rural Development of the People’s Republic of China, 2017.
-
YB 9082:2006. Technical Specification of Steel-Reinforced Concrete Structures. China Metallurgical Construction Research Institute, 2006.
-
JGJ 138:2016. Code for Design of Composite Structures. Ministry of Housing and Urban Rural Development of the People’s Republic of China, 2016.
-
EN 1994-1-1:2004. Eurocode 4: Design of Composite Steel and Concrete Structures Part 1-1: General Rules and Rules for Buildings. European Committee for Standardization, 2004.
-
Hu D., Peng X. Z., Shi T. F. Analysis and optimization design of cantilever structure of shear wall corner. IOP Conference Series: Materials Science and Engineering, Vol. 772, Issue 1, 2020, p. 012062.
-
Li Z. J., Liu J. M., Zhang Y. Y., Song C. C. Calculation of ultimate torque at H-shaped SRC pure torsional action based on the bond-slip. Journal of Qingdao Technology University, Vol. 38, Issue 6, 2017, p. 13-19.
-
Chen Z. P., Chen Y. L., Zhong M. Experimental investigation on anti-torsion performance of welded stud steel reinforced concrete beams. Journal of China Civil Engineering, Vol. 51, Issue 6, 2018, p. 72-79.
-
Song C. C., Liu J. M., Ai T. T., Li Z. J. Analysis of torsional stiffness of closed rectangular SRC members in pure torsion. Journal of Qingdao Technology University, Vol. 39, Issue 1, 2018, p. 26-32.
-
Soto A. G., Caldentey A. P., Peiretti H. C., Benítez J. C. Experimental behaviour of steel-concrete composite box girders subject bending, shear and torsion. Engineering Structures, Vol. 206, 2020, p. 110169.
-
JGJ T101:2015. Specifications for Seismic Test of Buildings. Ministry of Housing and Urban Rural Development of the People’s Republic of China, 2015.
About this article

