Abstract
In order to reduce the noise in the electric vehicle, the sound package is optimized by wrapping the motor with sound absorption and insulation materials. Firstly, the SEA model of electric vehicle is established, and its accuracy is verified. Then the orthogonal experimental design method is used to optimize the wrapping material, thickness and the percentage of coverage, at the same time, the lightweight of automobile is considered in order to control the mass of sound package. After optimization, the sound pressure level of the driver's head is greatly reduced under various frequencies. The motor package can effectively reduce the interior noise of the vehicle, and the orthogonal experimental design method can avoid the blindness of optimization. The combination of the two provides a certain guidance for the optimization of the sound package of the electric vehicle motor.
1. Introduction
Electric vehicles are considered as the main development direction of new energy vehicles in the future because it’s more energy-saving, more environmentally friendly and more sustainable [1]. It is found that the electric vehicle motor noise is not high, but it is especially loud at high frequency [2], in the high frequency region, the traditional analysis method cannot get the specific value of each vibration response of the interior noise because of the closely spaced modes [3]. Statistical Energy Analysis (SEA) method can effectively analyze and predict the characteristics of high frequency noise in automobiles [4]. Yuksel Gur [5] et al. used SEA method to optimize the sound package of a lightweight design fuel vehicle. The SEA simulation results of vehicle and instrument panel were given and compared with the experimental data and it shows that SEA method can be used to optimize the sound package of vehicle design and is an effective sound package optimization tool based on the accurate SEA model.
The problem of large interior noise caused by motor noise of an electric vehicle is studied as follows: Firstly, establish the vehicle SEA model of the whole vehicle, and verify the accuracy of the finite element analysis model, Secondly, wrap the motor with sound package materials, at the same time, consider the influence of material thickness and the coverage ratio, the orthogonal test design method is used to obtain the optimal scheme.
2. Statistical energy analysis
The analysis method based on statistical energy is a method combining statistics and finite element analysis, it’s an important means to effectively solve the sound package analysis in medium and high frequency bands [6]. The first step of SEA method is to divide the research object into different subsystems [7], each subsystem is a conservative system, and satisfy the law of conservation of mechanical energy, then the equilibrium equation of the system can be derived [8]:
where, is the natural frequency, is the coupling loss factor of subsystem to subsystem , is the energy of subsystem , is the internal loss factor of subsystem .
Then we can get the power balance equation of the system and the energy of the system, the expression of sound pressure is as follows [9]:
where represents the average sound pressure of the system, represents the air density, represents the sound velocity, represents the system energy, represents the system volume, the subscript represents the system number.
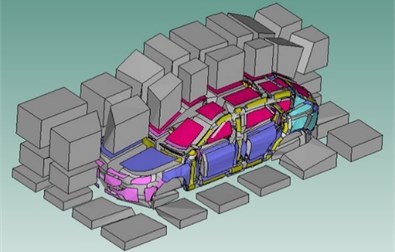
The interior sound cavity is divided into front row, rear row and trunk according to the seat position. The front row and rear row cavity are divided into head, waist and leg, and all of them are divided into left and right according to the middle of the car. The exterior sound cavity is divided into front and rear floor area, front and rear engine room area, wheel area, roof area and door area. The door area is divided into glass and door panel area, and the other cavity subsystems are divided into left and right parts. In this study, the body structure is divided into 614 panel subsystems, the interior cavity is divided into 40 subsystems, and the exterior cavity is divided into 96 subsystems. The established SEA model is shown in Fig. 1.
Fig. 1The established SEA model
3. Vehicle test and SEA model validation
3.1. Verification of PBNR
In this study, PBNR test is used to obtain the sound insulation from the driver’s head to each measuring point. PBNR can be obtained from the noise transfer function, and its calculation formula is as follows [10]:
where is the sound pressure, is the volume acceleration of the sound source.
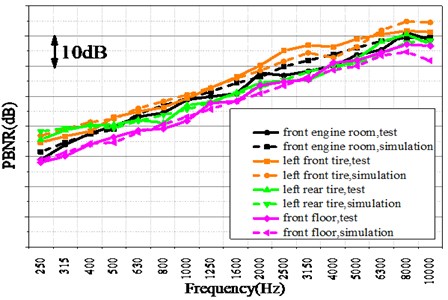
Add unit sound power excitation to the driver’s head cavity of the vehicle SEA model, the PBNR from the driver’s head to the front engine room, the front floor, the left front tire and the left rear tire are simulated, and the simulation results are compared with the test to verify the accuracy of the SEA model. Fig. 2 shows the PBNR value of the test and simulation.
Fig. 2Comparison of PBNR
3.2. Verification of exterior sound field
The verification of exterior sound field is usually needed to verify the accuracy of the SEA model. A series of measuring points are selected inside and outside the car, the measuring points inside the car should be placed at the driver’s head position. The measuring points outside the car are mainly placed in the position where the excitation is easy to transfer to the car and should cover the whole car, such as the wheel, motor, roof, floor, door, door glass and windshield glass area. The test vehicle is placed on the revolving drum test table in the semi-anechoic chamber, and the vehicle slowly accelerates to a constant speed of 100 km/h. And then the sound pressure of all measuring points is obtained. The measured sound pressure at the measured points outside the car is used as an excitation and is input into the SEA model of the electric vehicle, the sound pressure of driver’s head in the car is simulated and compared with the results directly measured in the test. Fig. 3 shows the comparison of the test and simulation results of the driver's head sound pressure level in the car.
Fig. 3Comparison of SPL
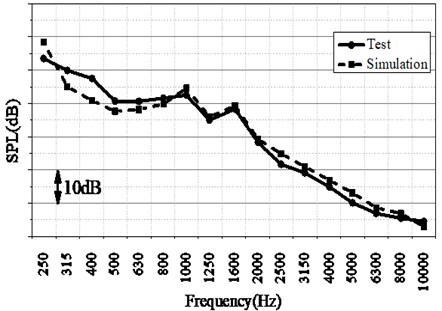
It can be seen from the Fig. 2 and Fig. 3 that in 500 to 10000 Hz, the test results of the PBNR from the driver’s head to the measuring points outside the vehicle and the SPL of the driver’s head are in good agreement with the simulation results, and the difference is less than 3 dB, which verifies the accuracy of the SEA model established in this study.
4. Optimization of motor sound package
In order to reduce the transmission of motor noise to the vehicle, the motor is packaged with double-layer sound package materials. Some studies [11-13] found that the thickness and coverage of the sound package have a great impact on the optimization of the sound package, thus it is necessary to select the package material, thickness and coverage ratio `when wrapping the motor. In this study, the orthogonal experimental design method is used to quickly obtain the optimal package scheme. There are two basic concepts in orthogonal experiment design, namely factor and level. Factor refers to the parameter that will affect the test results, and the level refers to the corresponding state of the factor. The orthogonal experimental design does not need to test all the schemes one by one, only a few representative schemes need to be selected, through the analysis of the extreme difference and the observation value, the best optimization scheme can be quickly found out from these few schemes, which greatly reduces the number of experiments and improves the efficiency [14]. After the selection, a total of four factors were selected, and they are represented by A, B, C and D respectively. Each factor has three levels which denoted by subscripts 1, 2, 3. The selection is shown in Table 1.
Table 1Factor level table
Inner material | Outer material | Thickness of inner material | Coverage ratio | |
1 | Mineral cotton | Fiber glass | 10 mm | 70 % |
2 | Sound absorption cotton | EVA | 15 mm | 75 % |
3 | Soft felt | Hard felt | 20 mm | 80 % |
According to Table 1, the standard orthogonal table with four factors and three levels is selected to arrange the experiment, as shown in Table 2. The sound pressure of the motor at 100 km/s is measured at first, and input the sound pressure in SEA model in turn by the scheme listed in Table 2 for simulation. The sound pressure reduction value of the driver's head and the sound package mass are recorded. Calculate the arithmetic mean of the corresponding results for each level under each factor, and record it as , where a represents factor and represents level . Calculate the extreme difference according to the formula , the extreme difference of the factor of the inner material can be obtained [15]. The results are shown in Table 2. refers to the extreme difference of the reduction of driver’s head sound pressure, and refers to the extreme difference of sound package mass.
Table 2Orthogonal table and results
Number | Factor and level | Reduction of driver’s head sound pressure (dB) | Sound package mass (kg) | |||
Inner material | Outer material | Thickness of inner material | Coverage ratio | |||
1 | 1 | 1 | 1 | 1 | 0.2937 | 0.6797 |
2 | 1 | 2 | 2 | 2 | 3.0952 | 2.3434 |
3 | 1 | 3 | 3 | 3 | 0.6328 | 0.2987 |
4 | 2 | 1 | 2 | 3 | 0.2380 | 0.8660 |
5 | 2 | 2 | 3 | 1 | 1.8537 | 1.9303 |
6 | 2 | 3 | 1 | 2 | 0.1977 | 0.3752 |
7 | 3 | 1 | 3 | 2 | 1.1891 | 0.7719 |
8 | 3 | 2 | 1 | 3 | 4.7521 | 2.6907 |
9 | 3 | 3 | 2 | 1 | 1.2540 | 0.4463 |
0.2458 | 1.9481 | 0.8023 | 0.2664 | – | ||
1.6353 | 2.6601 | 0.5227 | 0.7405 | |||
According to the orthogonal design theory, the bigger the extreme difference of a factor, the greater its impact on results [16]. It is customary to call the arithmetic mean of all the analysis results corresponding to a certain level of a factor as the observation value of the level of the factor, and the level corresponding to the best observation value of the average observation value of each factor is called the optimal level of the factor for the observation value. For the factor of the reduction of SPL of driver's head, the greater the reduction, the better it is, so the level corresponding to the maximum average observed value is the optimal level for this factor. For the factor of sound package mass, the smaller the better, so the level corresponding to the minimum average observation value is the optimal level for this factor, and the optimal scheme table is obtained, as shown in Table 3.
Table 3Optimal scheme
Factor | Inner material | Outer material | Thickness of inner material | Coverage ratio |
Optimal level of SPL | 3 | 2 | 1 | 3 |
Optimal level of mass | 2 | 1 | 3 | 1 |
It can be seen from Table 3 that if only consider the SPL of the driver’s head, the best scheme should be , that is, the inner material is soft felt, the outer material is EVA, the thickness of inner material is 10 mm, and the coverage ratio is 80 %. If only consider the sound package mass, the best scheme is , that is, the inner material is sound-absorbing cotton, the outer material is glass fiber, the thickness of inner material is 20 mm, and the coverage ratio is 70 %. In fact, we hope that the SPL of the driver’s head will be greatly reduced, and the sound package mass will be smaller. The two schemes contradict each other and need to be considered comprehensively. For the multi-objective optimization problem with multiple factors at different levels, the optimal scheme is usually obtained by using matrix analysis method [17]. Two evaluation parameters are weighted to obtain the weight matrix affecting the test: .
From the weight matrix, it can be seen that the weights of the three levels corresponding to factor A are 0.0379, 0.0568 and 0.0286, and the weight of level 2 is the largest. Similarly, the weight of level 2 of factor B, the weight of level 1 of factor C, and the weight of level 1 of factor D is the largest. Thus, the optimal scheme is , that is, the inner material is sound-absorbing cotton, and the outer material is EVA. The thickness of sound-absorbing cotton is 10 mm and the EVA is 20 mm, and the coverage ratio is 70 %. The scheme is not in the 9 schemes designed by the orthogonal experiment design method, and needs to be verified.
Fig. 4SPL of driver's head cavity
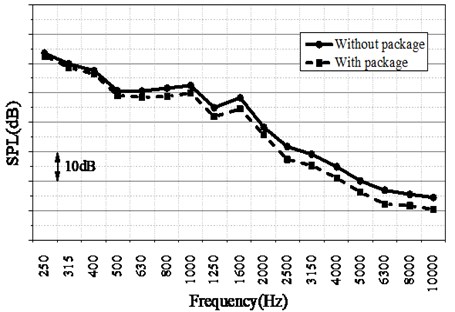
Fig. 4 shows the comparison curve of driver’s head SPL before and after the motor is wrapped according to the optimal scheme under motor excitation. It can be seen from Fig. 4 that after optimization, the SPL of the driver’s head has been reduced at various frequencies. The maximum reduction is at 6300 Hz, which is 5.70 dB, the total SPL is reduced by 2.10 dB, and the total sound package mass is 0.97 kg.
5. Conclusions
The innovation of this paper is to introduce matrix analysis method to weight multiple evaluation parameters, which provides an effective solution for multi-objective optimization of electric vehicle sound package. Based on the accurate vehicle SEA model, through the orthogonal experimental design method and the reasonable analysis of some tests, the best optimization scheme can be found to avoid the blindness of optimization, and it provides a guiding role for the optimization of the motor sound package of electric vehicles.
References
-
Wan Gang China’s electric vehicles have entered the stage of industrialization. Environmental Protection, Vol. 18, 2010, p. 13-15.
-
Jin Chunmei Overview of research on characteristics and digitalization of sound source of electric vehicle. SAIC Motor Corporation Limited, 2014, p. 11-13.
-
Pang Jian Noise and Vibration Control of Automobile. China Machine Press, 2015, p. 216-217.
-
Chen Shuming, Wang Dengfeng, Chen Xin, et al. A survey of statistical energy analysis methods for vehicle middle-high frequency noise. Computer Simulation, Vol. 26, Issue 4, 2009, p. 287-291.
-
Gur Yuksel, Pan Jian, Wagner David Sound package development for lightweight vehicle design using statistical energy analysis. SAE Technical Paper 2015-01-2302, 2015.
-
Meng Xianglong Sound Package optimization for Vehicle Design using Statistical Energy Analysis (SEA). Jilin University, 2020.
-
Liu Wang-Lin Research on Prediction and Control of Vehicle Inner Noise in Full Frequency Band. Chongqing University, 2016.
-
Hou Xianjun, Guo Jin, Du Songze, et al. Research and application of SEA analysis method for vehicle interior noise simulation. Noise and Vibration Control, Vol. 37, Issue 5, 2017, p. 119-123.
-
Wu Yin Research on Interior Noise in Middle and High Frequency and Optimal Sound Package Design of Electric Battery MPV. Hunan University, 2017.
-
Lin Lei, Gu Yan, Pan Lei The measurement method optimization of automotive power based noise reduction test. Research and Application, Vol. 10, 2019, p. 40-43.
-
Hou Zhaoping, Fu Nian, Deng Jianghua, Liu Renquan Analysis and optimization of acoustic insulation performance of automobile front circumference assembly. Automotive Science and Technology, Vol. 2, 2019, p. 34-39.
-
Liu Guojie, Wang Xuchu Optimization of material and structure of cowl insulation based on NVH performance. Practical Automobile Technology, Vol. 22, 2018, p. 229-234.
-
Wang Haojin, Xie Xuemin Research and improvement on the insulation theory of one vehicle. Mechanical Engineer, Vol. 11, 2017, p. 113-115.
-
Wu Yun, Yuan Jiyou Application of orthogonal experimental design in the development of automotive braking system. SAECCE-CIT022, 2019, p. 886-889.
-
Ren Luquan Optimum design and analysis of experiments. Second Edition, Higher Education Press, Beijing, 2003.
-
Tang Rongjiang, Li Shenfang, Zheng Weiguang, et al. Optimization design of sound insulation property in front wall using hybrid FE-SEA method. Journal of Applied Acoustics, Vol. 38, Issue 1, 2019, p. 22-28.
-
Zhou Yuzhu A Matrix analysis of orthogonal design. Mathematics in Practice and Theory, Vol. 39, Issue 2, 2009, p. 202-207.
Cited by
About this article

This research was financially supported by Project of the Key Technology of Sound Package Development (011512.07).
