Abstract
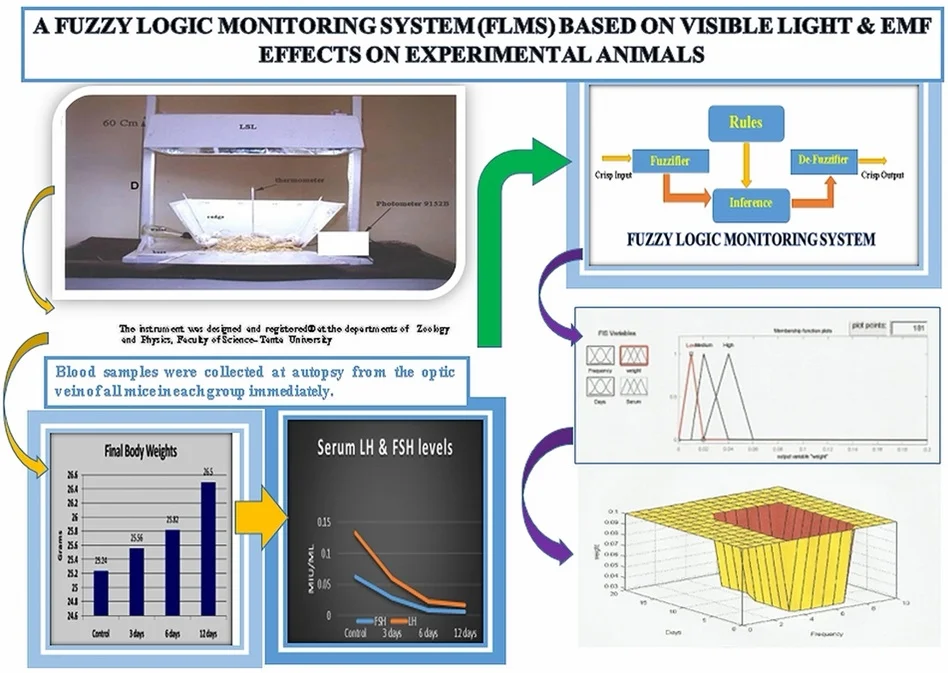
Recently, there is a large concern focusing on the effects of electromagnetic radiation on human health hazards. So there has been a progress in medical data analysis using different systems such as artificial intelligent techniques. One of these is a Fuzzy logic technique. In this research a fuzzy logic-based monitoring system is used with interference effects on experimental animals. This system shown an ability to support the recent studies with great results and analysis. The performance of the fuzzy inference system was validated through a real data have been collected through an experiment. Therefore, the study designed to investigate the effect of sub-chronic exposure of electromagnetic field on experimental mice. In this experiment, the mice exposed to EMF (12 h/day) in a EMF exposure machine designed especially for exposure of biological.
1. Introduction
The effects of electro-magnetic interference on experimental animals using fuzzy logic monitoring system has been evaluated, the effect of two different electric-field and magnetic –filed on Mice. Effective doses similar to the level of human exposure to EMF has been posed. Mice groups were exposed to iso-thermal non-ionizing radiation, (Artificial visible light of intensity 77 mW/cm2 on the area of 72.5 cm2 and frequency of EM radiation between (1 GHz and 1.5 GHz [1-3].
Recently, extremely low frequency electromagnetic field (LF-EMF) especially at the visible light range (400-800 nm) have determine consequences on human health [1].
Also, epidemiological studies indicated that exposure to visible light may cause several health hazards particularly of fetus maturation and biological activities on the embryos [3, 4].
2. Maxwell
Maxwell’s equations take the form of an electromagnetic wave in an area that is very far away from any charges or currents (free space) – that is, where and are zero. It can be shown, that, under these conditions, the electric and magnetic fields satisfy the electro-magnetic wave equation: The electromagnetic wave equation is a second-order partial differential equation that describes the propagation of electromagnetic waves through a medium or in a vacuum. The homogeneous form of the equation, written in terms of either the electric field or the magnetic field B, takes the form [2, 5]:
It should also be noted that in most older literature, () is called the magnetic flux density or Magnetic induction (Jordan).
Electromagnetic radiation can be classified into ionizing radiation and non-ionizing radiation [2, 17].
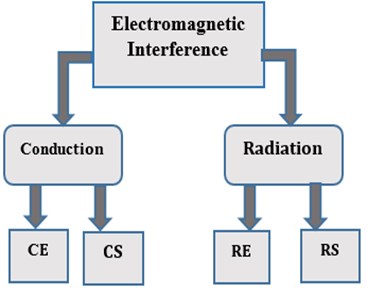
It is also known as radio frequency interference. It is a phenomenon where one electromagnetic field interferes with another resulting in the distortion of both fields. we can widely categorize electromagnetic-interference into two major groups as emissions and susceptibility [2].
Classification of Electromagnetic Interference. It is further classified as:
– CE-conducted emission.
– RE-radiated emission.
– CS-conducted susceptibility.
– RE-radiated susceptibility.
The CE and RE deals with undesirable emissions from a device as internal sources of noise. Similarly, CS and RS deals with a device as external sources of noise [2].
Fig. 1Types of electromagnetic radiation
3. Materials and methodology
Experimental setup. The mice were exposed to isothermal non-ionizing EMF, represented by the man-made visible light (artificial visible light of intensity of 77 mW/cm2 on the area of 72.5 cm2 and frequency of EM radiation between 3.9×10¹⁴ Hz and 7.5×10¹⁴ Hz W/cm2) 8 hours per day for 3, 6 and 12 day [6-8, 10-15].
Fig. 2Artificial visible light of intensity of 77 mW/cm2 on the area of 72.5 cm2 and frequency of EM radiation between 3.9×10¹⁴ Hz and 7.5×10¹⁴ Hz W/cm2) 8 hours per day for 3, 6 and 12 days
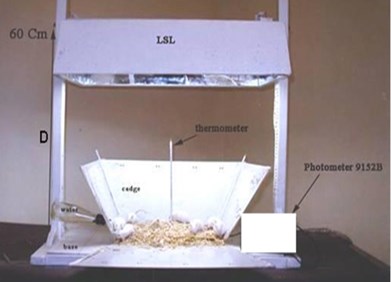
Instrumental procedure. The instrument was designed and registered® at the Departments of Zoology and Physics, Faculty of Science, Tanta University [10].
Animal groups:
– The mice were divided into 3 treated groups, plus one control group. Each group comprised 15 male mice [16-26].
– G1 15 Mice exposure 12 days (8 hours/day).
– G2 15 Mice exposure 6 days (8 hours/day).
– G3 15 Mice exposure 3 days (8 hours/day).
– G4 15 Mice (CONTROL) not exposed.
4. Analysis procedure
– All mice were sacrificed at the following day of the last exposure.
– Control mice were sacrificed at the same time.
– The animals were sacrificed, grossly examined for abnormalities, and organs, tissues and blood were collected and then prepared for histopathological and biochemical investigations.
Blood biochemistry:
– Blood samples were collected at autopsy from the optic vein of all mice in each group and immediately centrifuged at 3000 rpm for 15 min. Plasma was collected and preserved frozen at –20 °C before measurement of:
– Serum Total proteins, Albumin and Albumin/Globulin ratio levels.
– Serum testosterone levels.
– Serum follicular stimulating hormone (FSH) levels.
– Serum luteinizing hormone (LH) levels.
– Serum Gonadotropic releasing hormone (GnRH).
– Serum Growth hormone (GH).
– Serum aspartate aminotransferase (AST) activity.
– Serum alanine aminotransferase (ALT) activity.
5. Results
From Fig. 3 the difference was significant between testes weights of mice exposed for 12 days as compared to testes of control mice but was not significant between mice exposed to visible light for 3 or 6 days and the controls. The testes weights of all mice in the visible light exposed groups were gradually decreased as compared to the testes of control mice [21-39].
Fig. 3Final body weights
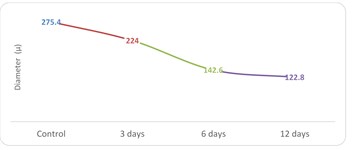
a) Mean diameter of Seminiferous tubules (µ)
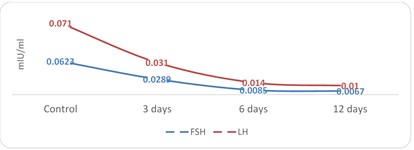
b) Serum LH & FSH levels
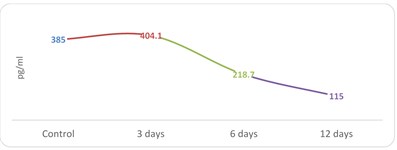
c) Serum GnRH levels
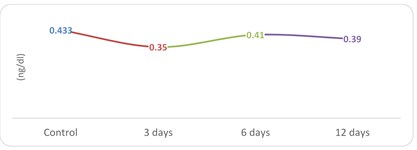
d) Serum GH levels
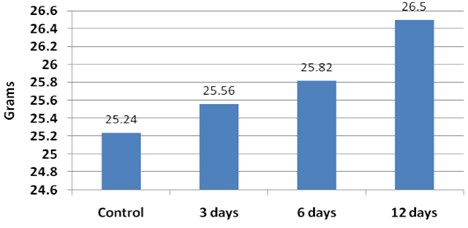
e) Final body weights
Table 1Results of proteins and albumin
Experimental group | Exposure interval | Total proteins levels (g/dl) | Albumin level (g/dl) | A/G ratio |
1 | 12 days | 7.94 ± 11.85 | 3.15 ± 2.33 | 1.75 ± 2.30 |
2 | 6 days | 7.42 ± 21.52 | 4.55 ± 11.3 | 1.91 ± 0.93 |
3 | 3 days | 7.84 ± 11.29 | 3.71 ± 12.5 | 2.00 ± 3.48 |
4 | Control | 8.00 ± 10.51 | 4.95 ± 8.45 | 1.99 ± 2.45 |
Fig. 4Two photomicrographs showing general testis histology of a control mouse (A)
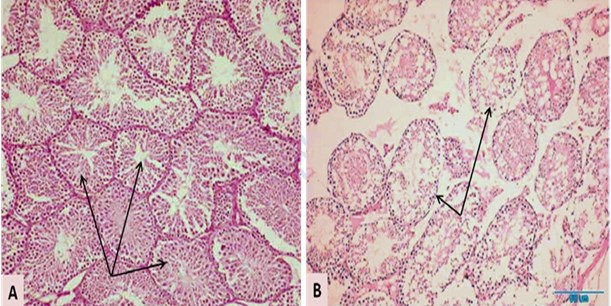
General histology of the testis of mouse exposed to visible light for 12 days. Note the intact seminiferous tubules in (A), and the degenerated seminiferous tubules in (B) (arrow). Hematoxylin and Eosin [40-52].
6. FLMS structure
Fuzzy inference system (FIS) is a processing operation of a given input data to a specific limited output ranges done by using fuzzy logic techniques. This process consist of membership functions, fuzzy logic operators, and rules. Fuzzy inference system have two types of implementation methods Mamdani-type and Sugeno-type. The two methods been applied in different areas such as automatic control, decision analysis and expert systems.
The fuzzy logic controller takes input values from the real world. These values are referred to as “Crisp” values since they are Represented as single number, not a fuzzy one. There are three parts to a fuzzy controller, the fuzzification of the inputs, the defuzzification of the outputs, and the rule-base. In order for the fuzzy controller to understand the inputs. The crisp input has to be converted to a fuzzy number. This process is called fuzzification Fig. 5.
Fig. 5Fuzzy logic control block diagram
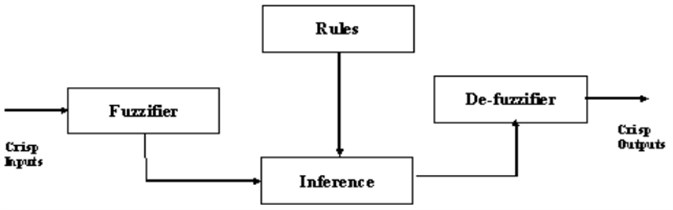
The next step in fuzzy control process is the implementation of the rule base. This is where the fuzzy inputs are compared and based on the membership of each. The final step is to convert the fuzzy outputs of rule-base to crisp ones.
This process is known as defuzzification. This process will take a fuzzy number and apply it to a membership function to achieve the crisp number that will be sent to the real world [53-58].
6.1. FLMS Structure Introduction
As mentioned previously the system based on artificial visible light of intensity (77 mW/cm2) and frequency range between (3.9×10¹⁴ Hz) up to (7.5×10¹⁴ Hz) and 8 hours per day for (3 days, 6 day and 12 days) as a system inputs.
The system output consist of two parameters:
1 – Testis weight in (grams).
2 – Level of Serum follicular stimulating hormone (FSH) levels in (ml).
6.2. Building the system using fuzzy logic toolbox
First step of the design was to open an Fuzzy Inference System (FIS) file from the Fuzzy toolbox in Matlab (Math work software), then input data applied to the system.
(Days, Frequency values) as inputs to the system.
The second step was to use the evalfis function for evaluation which indicate purpose fulfill fuzzy inference computing process:
Synopsis output =evalfis(input,fismat).
Fismat =fis matrix.
The description of this function is [Computes the output vector output of the fuzzy inference system] given by the FIS matrix fismat.
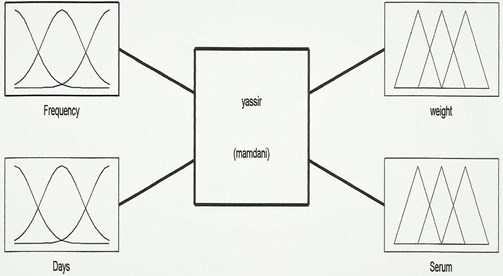
Because the system consist of two inputs and two outputs MAMDANI method selected, that because it is suitable for our system design [58].
Fig. 6The fuzzy inference system (FIS)
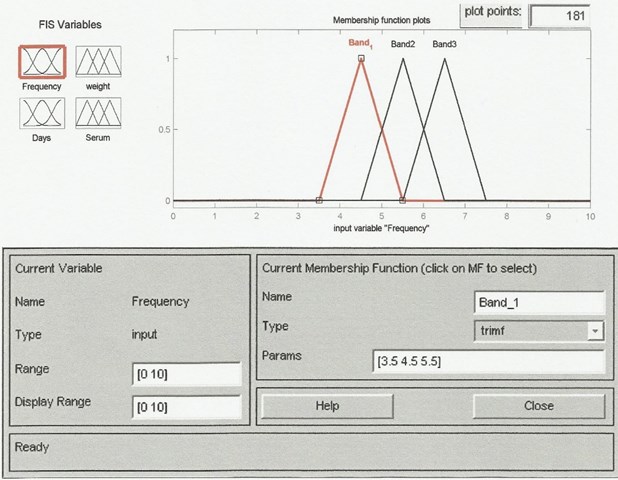
6.3. Input membership
The first input is frequency and the second input is days.
The range of the input variables lead to classify the values into three Linguistic variables:
– Band 1: 3.5-5.5×10¹⁴ Hz.
– Band 2: 5.5-6.5×10¹⁴ Hz.
– Band 3: 6.5-7.5×10¹⁴ Hz.
– So system response shown in Figs. 8, 9.
Fig. 7Trained data evaluation
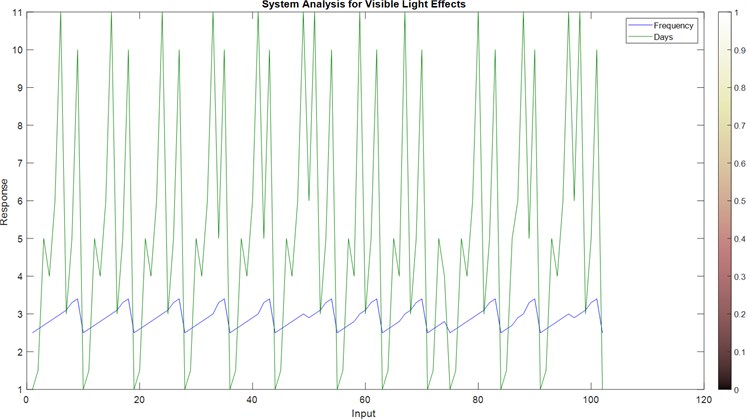
Fig. 8Input frequency membership
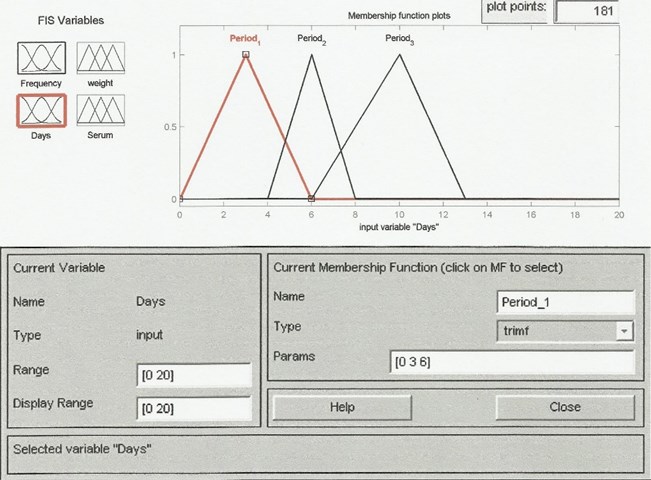
The second input is the days, has the membership (Fig. 9).
Fig. 9The membership of input days of exposure
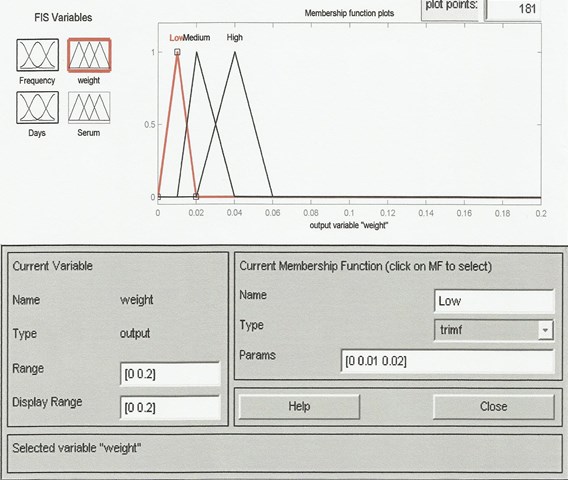
6.4. Output membership
The system have two outputs as mentioned before.
The first output is (Weight in grams), the second output is (Serum level in ml).
The Figs. 10, 11 shown the output membership.
Fig. 10Weight membership
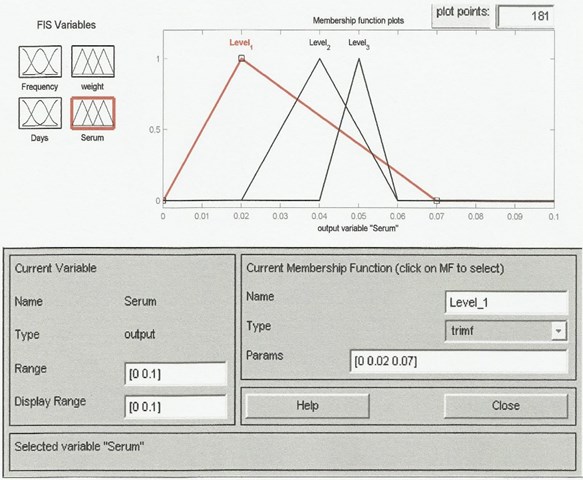
The second output membership is Serum level which is shown in Fig. 11.
Fig. 11FSH serum level membership
6.5. Rules editor
Fig. 12Rules editor
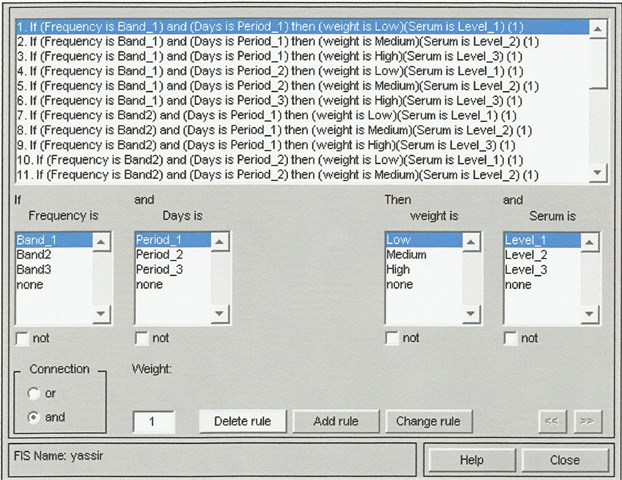
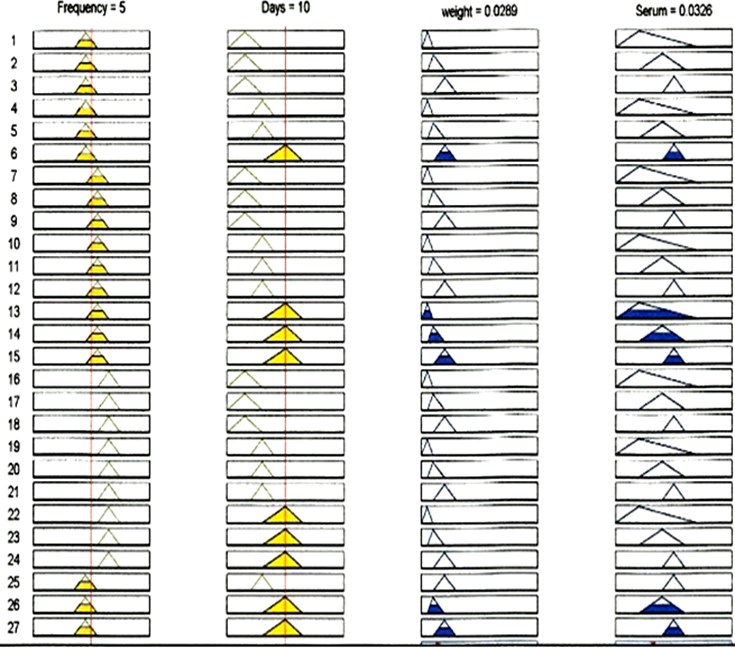
6.6. The rule viewer
The rule viewer is a cornerstone of the system it is also presenting the fuzzy inference process. It’s based on the fuzzy inference diagram.
Every rule is a row of plots and each column is a variable. Then first column of plots shows the membership functions referenced by the previous one, or if-part, of each rule.
The second column of plots shows the membership every row of plots represents one rule. To display the rule just click it then it will appear in status bar. Status line shows the most recent operation.
Fig. 13Rules viewer
6.7. The surface viewer
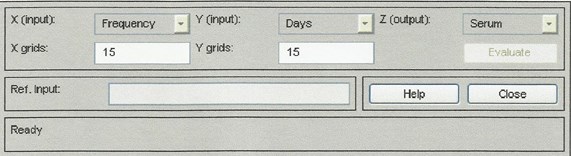
The surface viewer is supported by snapmenu which help you to select any two inputs and any one output for plotting. Just below these menus are two input fields placed to let you specify how many -axis and -axis grid lines you want to include. Which help you to maintain the calculation time reasonable for complex problems.
By clicking the evaluate button the calculation start, and the plot comes up immediately after the calculation is completed.
Fig. 14Fuzzification method of weight variable
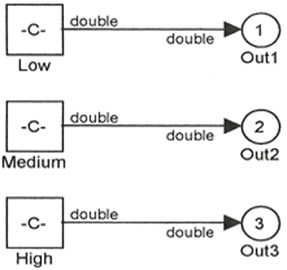
Fig. 15Serum fuzzification
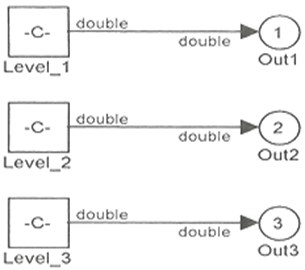
Fig. 16System 3D control surface (weight)
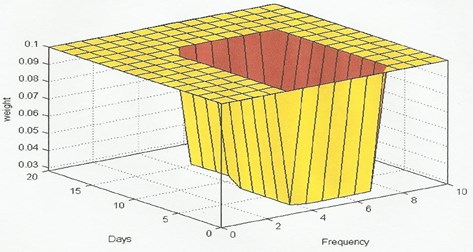
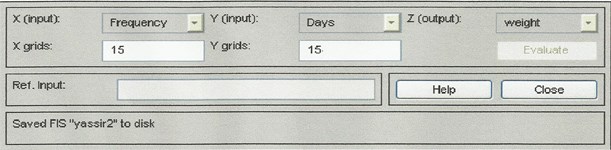
Fig. 17System 3D control surface of FSH (serum)
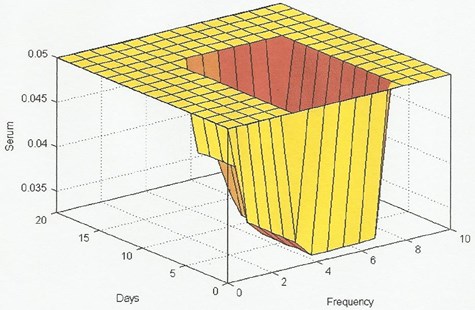
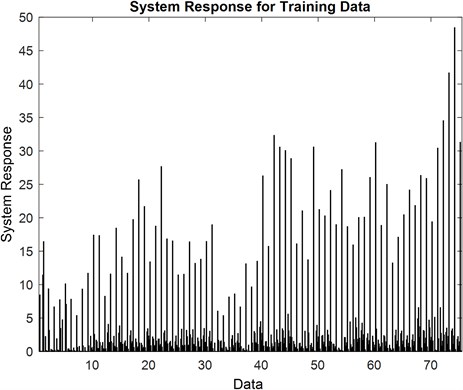
As you see there are so many peaks in the figure this is according to non linearity of the system. That because the system train data randomly.
Fig. 19 and Fig. 20 shows the relation between the input Frequency and output. There is a data concentration shown between (10-40) this is clearly appearing in Fig. 20.
Fig. 18Input frequency and output weight
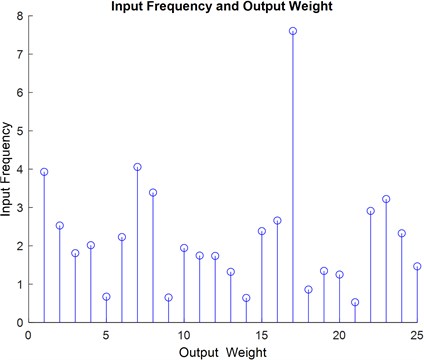
Fig. 19Input frequency and serum level
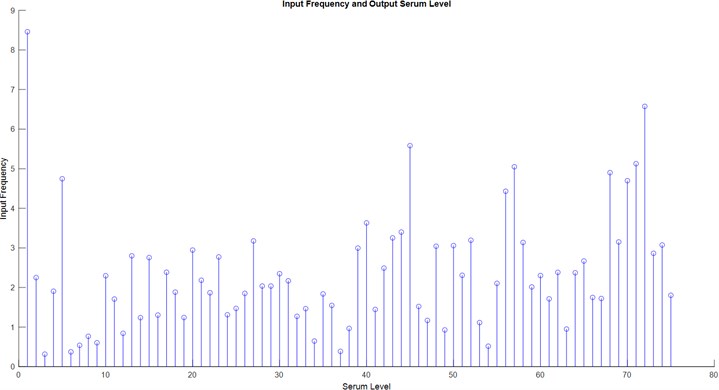
Fig. 20System response of the training data
7. Conclusions
We assume that any radiation exposure, no matter how small, carries with it some risk. However, we know that on average these risks are comparable to or smaller than risks we encounter in other activities or occupations that we consider safe. Since we have extensive control over how much radiation exposure we receive on the job, we can control and minimize this risk. The best approach is to keep our dose as low as reasonably achievable. Minimizing the dose minimizes the risk.
Technically, application of fuzzy logic monitoring based system in Biomedical engineering branches is very useful for different purposes, such as safety purposes especially in laboratories and areas under risky radiation hazards.
The fuzzy logic monitoring based system contains the control rules directly derived from the observed process. The functioning of the fuzzy logic is transparent, and it was adjusted through experimentation. The results indicate that man-made visible light may affect the endocrine homeostasis of mice by exerting histopathological.
References
-
Stavroulakis P. Biological Effects of Electromagnetic Radiation. 1st edition, Springer, 2003.
-
Kwee S., Raskmark P. Changes in cell proliferation due to environmental non-ionizing radiation: 1-ELF electromagnetic field. Bioelectrochemistry and Bioenergetics, Vol. 36, Issue 2, 1995, p. 109-114.
-
C95.1, Standard for Safety Level with Respect to Human Exposure to Radio Frequency Electromagnetic Fields, 3 KHz to 300 GHz, IEEE, 2005.
-
Maxwell Clerk J. A dynamical theory of the electromagnetic field. Philosophical Transactions of the Royal Society of London, Vol. 155, 1865, p. 155, 459-512.
-
Cao Y. N., Zhang Y., Liu Y. Effects of exposure to extremely low frequency electromagnetic fields on reproduction of female mice and development of off springs. Chinese Journal of Industrial Hygiene and Occupational Diseases, Vol. 24, Issue 8, 2006, p. 468-470.
-
Starr Cecie, Evers Christine, Starr Lisa Biology: Concepts and Applications. 9th edition, Thomson, Brooks/Cole, 2006.
-
Wood John P., Lascaratos Gerassimos, et al. The influence of visible light exposure on cultured RGC-5 cells. Molecular Vision, Vol. 14, 2007, p. 334-344.
-
Gallawa John Carlton Contributor and Signer of the current Microwave Oven. National Trade Magazines, Electronic Servicing and Technology, Appliance, TechTalk, 2001.
-
Lim Hwan Jin, Ali Zeeshan M., Sanders Ruth A., Snyder Ann C., et al. Effects of low-level light therapy on hepatic antioxidant defense in acute and chronic diabetic rats. Journal of Biochemical and Molecular Toxicology, Vol. 23, Issue 1, 2009, p. 1-8.
-
Fouad Abou-Zaid A., et al. Can man-made visible light radiation affect the reproductive capacity of male mice. The Egyptian Journal of Experimental Biology, Vol. 2, 2006, p. 81-91.
-
Hymer W. C., Welsch J., Buchmann E., Risius M., Whelan H. T. Modulation of rat pituitary growth hormone by 670 nm light. Growth Hormone and IGF Research, Vol. 19, Issue 3, 2009, p. 274-279.
-
Sadiku Matthew N. O. Elements of Electromagnetics. 4th Edition, Oxford University Press, New York, 2007, p. 386.
-
Aitkin Hugh G. J. The Continuous Wave Technology and the American Radio, 1900-1932. Princeton University Press, 1985.
-
Gribbin John Q is for Quantum – An Encyclopedia of Particle Physics. Simon and Schuster, 2000.
-
Serway R. A., Jewett J. W. Principles of Physics: a Calculus-Based Text. Cengage Learning, 2001, p. 809.
-
Kavet Robert, William H., Bailey T., Bracken Dan, Patterson Robert M. Recent advances in research relevant to electric and magnetic field exposure guidelines. Bio Electro Magnetics, Vol. 29, Issue 7, 2008, p. 499-526.
-
Recommendations on Limits for Exposure to Ionizing Radiation. NCRP Report No. 91, Bethesda, National Council on Radiation Protection and Measurements, 1987.
-
Benbrahim Jala, Telecom S. R. Broadband Wireless Access for Low Cost Connectivity and Increased Bandwidth. ITU African Indicators Report, 2004.
-
Vardarajan S., Dola Sanjay S. EMI-EMC Analysis Reduction of Electromagnetic-Interference in Pressure Sensor Using Micro Strip Filter. 1st edition, LAP Lambert Academic Publishing, Latvia, 2019.
-
Kurppa K., Hoimberg P. C., Pantela K., Nurminen T., Saxen L. Birth defects and exposure to video display terminals during pregnancy, a finnish case-referent study. Scandinavian Journal of Work, Environment and Health, Vol. 11, Issue 5, 1985, p. 353-356.
-
Westerholm P., Ericson A. Pregnancy Outcome and VDU Work in a Cohort of Insurance Clerks. Work with Display Units, Elsevier, 1987, p. 104.
-
Bjerkedal T., Egenas J. Video Display Terminals and Birth Defects. Work With Display Units, Elsevier, Amsterdam, 1987, p. 111.
-
McDonald A. D., McDonald J. C., Armstrong B., Cherry N., Nolin A. D., Robert D. Work with visual display units in pregnancy British Journal of Industrial Medicine on JSTOR, Vol. 45, Issue 8, 1988, p. 509-515.
-
McDonald A. D., Cherry N. M., Delorme C., McDonald J. C. Visual display units and pregnancy Evidence from the Montreal study. Journal of Occupational and Environmental Medicine, Vol. 28, Issue 12, 1986, p. 1226-1231.
-
Wertheimer N., Leeper E. Fetal loss associated with two seasonal sources of electromagnetic field exposure. American Journal of Epidemiology, Vol. 129, Issue 1, 1989, p. 220-224.
-
Cheng David K. Field and Wave Electromagnetics. 2nd Edition, Prentice Hall, Intermediate Level Textbook, 1989.
-
Nigel Henbest, Marten Michael The New Astronomy. 2nd Edition, Cambridge University Press, 1996.
-
Lorrain Paul, Corson Dale R., Lorrain Francois Electric magnetic fields and waves, induction electric circuits. 3rd Edition, W. H. Freeman and Company, 1998.
-
Hayt Wiliam H., Jr Buck John A. Engineering Electromagnetic. 6th Edition, McGraw-Hill, 2001.
-
Davies A. Handbook of Condition Monitoring Techniques and Methodology. Springer, New York, 1997, p. 275.
-
Narinder Kumar Comprehensive Physics XII. Laxmi Publications, 2008, p. 1416.
-
Ottosen Lars D. M., Hindkjaer Johnny, Ingerslev Jakob Light exposure of the ovum and pre-implantation embryo during ART procedures. Journal of Assisted Reproduction and Genetics, Vol. 24, Issues 2-3, 2007, p. 99-103.
-
Trottier Lorne EMF and health: a growing hysteria in skeptical inquirer. The Official Journal of the Committee for Skeptical Inquiry, Vol. 33, Issue 5, 2009.
-
Wong Riley Margaret T.-T., Bai Xeutao, Buchmann Ellen, Whelan Harry T. Light-emitting diode treatment reverses the effect of TTX on cytochrome oxidase in neurons. NeuroReport, Vol. 12, Issue 14, 2001, p. 3033-3037.
-
Eells J. T., Gopalakrishnan S., Abroe B., Albarracin R., Valter Kocsi K. 670 nm photobiomodulation attenuates light-induced retinal degeneration. Investigative Ophthalmology and Visual Science, Vol. 51, 2010, p. 2263.
-
Erdle Brandon J., Brouxhon Sabine, Kaplan Martin, et al. Effects of continuous-wave (670-nm) red light on wound healing. Dermatologic Surgery, Vol. 34, Issue 3, 2008, p. 320-325.
-
Boorman Clive J., Shimeld Sebastian M. Pitx homeobox genes in Ciona and amphioxus show left-right asymmetry is a conserved chordate character and define the ascidian adenohypophysis. Evolution and Development, Vol. 4, Issue 5, 2002, p. 354-365.
-
Kihara H., Yamaguchi S., Yoshimura F., et al. Pituitary folliculo-stellate cells immunostained with S-100 protein antiserum in postnatal, castrated and thyroidectomized rats. Cell and Tissue Research, Vol. 231, 1983, p. 235-249.
-
Wilson B. W., Matt K. S., Morris J. E., Sasser L. B., Miller D. L., Larry E. A. Effects of 60 Hz magnetic field exposure on the pineal and hypothalamic-pituitary-gonadal axis in the Siberian hamster (Phodopus Sungorus). Bioelectromagnetics, Vol. 20, 1999, p. 224-232.
-
Selmaoui B., Lambrozo J., Touitou Y. Endocrine functions in young men exposed for one night to a 50 Hz magnetic field. A circadian study of pituitary, thyroid and adrenocortical hormones. Life Science, Vol. 61, Issues 5-27, 1997, p. 473-486.
-
Parhar I. S. Gonadotropin-Releasing Hormone: Molecules and Receptors. 1st Edition, Elsevier, 2002.
-
Kim Yoon-won, Kim Hee-sung, Lee Jin-sang, Kim Young-jin, Lee Sang-kon, Seo Jae-nam, Jung Kyeong-cheon, Kim Nam, Gimm Youn-myoung Effects of 60 Hz 14 µT magnetic field on the apoptosis of testicular germ cell in mice. Bio Electro Magnetics, Vol. 30, Issue 1, 2008, p. 66-72.
-
Masaaki Oka, Kohsuke Sasaki Analysis of DNA copy number aberrations in hepatitis C virus-associated hepatocellular carcinomas by conventional CGH and array CGH. Modern Pathology, Vol. 17, 2004, p. 617-622.
-
Lim Jinhwan, Ali Zeeshan M., Sanders Ruth A., Snyder Ann C., Eells Janis T., Henshel Diane S., Watkins III John B. Effects of low-level light therapy on hepatic antioxidant defense in acute and chronic diabetic rats. Journal of Biochemical and Molecular Toxicology, Vol. 23, Issue 1, 2009, p. 1-8.
-
Schmidt M. H., Meyer G. A., Reichert K. W., et al. Evaluation of photodynamic therapy near functional brain tissue in patients with recurrent brain tumors. Journal of Neuro-Oncology, Vol. 67, 2004, p. 201-207.
-
Holmes S. J., Shalet S. M. Role of growth hormone and sex steroids in achieving and maintaining normal bone mass. Hormone Research in Paediatrics, Vol. 45, Issues 1-2, 1996, p. 86-93.
-
McEwen B. S. Steroid hormones Effect on brain development and function. Hormone Research in Paediatrics, Vol. 37, 1992, p. 1-10.
-
American Association for Clinical Chemistry, Washington, DC20006, 2008, http://www.labtestsonline.org/site/index.html.
-
Ozawa H., Abe E., Shibasaki Y., Fukuhara T., Suda T. Electric fields stimulate DNA synthesis of mouse osteoblast-like cells (MC3T3-E1) by a mechanism involving calcium ions. Journal of Cellular Physiology, Vol. 138, 1989, p. 477-483.
-
Henry Richard J. Clinical Chemistry. 2nd edition, New York, 1974, p. 131.
-
Munro H. N., Fleck A. Recent developments in the measurements of nucleic acids in biological materials. A supplementary Review Analyst, Vol. 91, 1966, p. 78-88.
-
Lai Henry, Narendra Singh Acute low-intensity microwave exposure increases DNA Single-strand breaks in rat brain cells. Bioelectromagnetics, Vol. 16, Issue 1, 1995, p. 207-210.
-
Zadeh Lotfi A. Fuzzy Relation Equation and Application to Knowledge Engineering Kluwer. Academic Publishers, Holland,1995.
-
Patyra M. J., Mlynek D. M. Fuzzy Logic Implementation and Applications. John Wiley and Sons Ltd and B. G. Teubner, England, 1996, p. 159.
-
Hawley Robert Artificial Intelligence Programming Environment. Halsted Press, 1987.
-
Mamdani E. H., Brian Gaines R. Fuzzy Reasoning and its Application. Academic Press, USA, 1981.
-
Fuzzy Logic Data Deduplication program, https://www.fuzzy-logic.com/home/downloads.
-
MathWorks, https://www.mathworks.com/products/get-matlab.html.
About this article

