Abstract
In the engineering measurement of explosion shock wave pressure, the installation method of shock wave pressure sensor is of great significance to accurately obtain shock wave pressure. Based on the actual shooting range explosion shock wave overpressure test program, this paper uses AUTODYN to establish a finite element numerical simulation model. The distance from the ground reflection pressure sensor to the explosion center is 3 m, 4 m, 5 m, and 6 m. The shock wave overpressure data in the range of 8° and 10° are acquired and analyzed. The analysis results show that the shock wave overpressure obtained when the sensor installation angle is absolute zero is the ideal value. When the sensor installation plate is within a certain range, the overpressure value of the explosion shock wave increases with the increase of the installation angle of the plate, and the installation angle of the sensor is positively correlated with the overpressure of the explosion shock wave.
1. Introduction
When the ammunition explodes, the shock wave, heat radiation, fragments, etc. produced can effectively kill the ground target. The explosive shock wave is used to evaluate the damage power characteristics of the ammunition.
Therefore, how to accurately measure the overpressure data of the explosive shock wave of ammunition is particularly important [1-3]. Therefore, it is necessary to study the factors that affect the accuracy of the explosive shock wave test, and obtain accurate explosive shock wave by controlling the influencing factors. Data, evaluate the damage power of ammunition, and use this as a reference to put forward requirements for the design of ammunition weapons.
Since the installation state of the shock wave sensor has a great influence on the accurate measurement of the shock wave overpressure value [4-5], it is necessary to analyze and study its specific influence state. At present, there are few researches at home and abroad on the influence of the installation angle of the sensor on the acquisition of the shock wave overpressure value. Such as: Li Chen, Kong Deren and others based on the impact of shock and vibration on the measurement of shock wave pressure sensors, designed a sensor installation structure for ground reflection pressure measurement, and carried out related simulation experiments. The analysis of the experimental results shows that the sensor installation structure can effectively suppress the impact of mechanical shock on the pressure sensor measurement, and is suitable for the shock wave overpressure measurement in the explosive field [6]. Zhang Xianpi, Pan Jianqiang and others have studied in detail the influence of the sensitive crystal package structure, the incident azimuth angle of the relative sensitive surface of the shock wave and the length of the transmission wire on the waveform for several influencing factors of the underwater explosion free field pressure sensor. They found that: shock wave when incident on the sensitive surface instead of horizontal, it will cause the distortion of the wave head and the increase of the rising edge [7]. Tong Xiao used the method of LS-DYNA modeling and simulation to explore the influence of the size of the sensor installation plate on the pressure measurement of the ground reflected shock wave. Through FLUENT modeling and simulation, the flow field distribution around the disc sensor installation structure and the wedge sensor installation structure under the action of the shock wave are simulated, and a wedge sensor installation structure is designed on this basis. The test results show that the designed wedge sensor mounting structure is very close to the standard free-field sensor test results, and can meet the requirements of the free-field shock wave pressure test [8]. It can be seen from the above research that there is currently no comprehensive analysis and research on the inclination angle of the sensor installation. It is necessary to establish a corresponding test model to analyze the influence of the installation angle of the sensor on the explosion shock wave.
This paper uses AUTODYN to establish the corresponding numerical simulation model to simulate the explosion shock wave of 8kgTNT, set different Gauss measuring points, obtain the sensor shock wave overpressure under different tilt angles, and use the absolute level as the ideal value to calculate the different tilt angles (0°, 3°, 5°, 8°, 10°) sensor response value error, the response value error is used as the basis for evaluating flat panel installation requirements.
2. Establishment of static explosion simulation model
2.1. Establishment of finite element simulation model
A finite element simulation model was established based on the actual surface reflected shock wave pressure test site. The 8 kg TNT bare grain was selected for simulation. The length-to-diameter ratio of the grain was 1:1. The detonation method was the central point detonation. The horizontal distance of the projection point is 3 m, 4 m, 5 m, 6 m. Because multiple sensors are placed at the same radius, the sensor installation plate in different positions will interfere with the pressure flow field, which will cause the pressure measured at different measuring points in the same radius. There is a certain error in the value, so only one sensor is arranged at a radius, and the tilt angle of the sensor is 0°, 3°, 5°, 8°, and 10°. The schematic diagram of the installation angle of the sensor installation plate is shown in Fig. 1.
Fig. 1Schematic diagram of installation plate angle

a)

b)

c)

d)
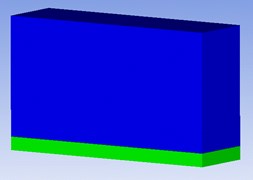
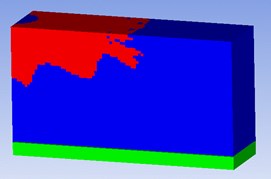
In order to improve the calculation accuracy, the length of the air domain at the measuring points 3 m, 4 m, 5 m, and 6 m is set to 4 m, 5 m, 6 m, 7 m, respectively, with a width of 1 m and a height of 2 m; the width of the concrete area is 1 m, and the height is 0.2 m; The diameter of the installation plate is set to 0.26 m, and the height is 0.1 m. Air is in an ideal gas state, using Euler solver, concrete and sensor mounting plates are solid, using Lagrange solver. At the same time, in order to monitor the change of shock wave pressure, Gaussian monitoring points are placed around the installation plate and at different distances above the concrete. First, establish a symmetrical two-dimensional detonation model to calculate the propagation of the shock wave of the TNT explosive in the two-dimensional model, and then use the Remap technology to map the shock wave to the three-dimensional model to continue the calculation. Fig. 2 shows the established mapped three-dimensional model.
Fig. 2Numerical simulation model: a) The overall diagram of the calculation model before mapping, b) Calculate the simulated overall picture after mapping
a)
b)
2.2. Material state equation and parameters
In the above model, air is an ideal gas, and the density is 0.001225 g/cm3, 4.29×10⁶J/kg, JWL state equation is shown in Eq. (1):
where is pressure, is volume, is internal energy, and are material parameters, and , and are constant parameters.
The material of the sensor mounting plate is STEEL-1006 in the AUTODYN material library, the Liner equation of state is used, and the damage model adopts the Johnson-Cook constitutive model that is suitable for the description of the mechanical behavior of metal materials under impact and explosion loads. The expression is [9-10]:
where: is the flow stress, is the equivalent plastic strain, is the yield stress parameter, is the strain strength parameter, is the empirical strain rate sensitivity coefficient, and n is the hardening index. The main material parameters are shown in Table 1.
Table 1The main material parameters of the sensor mounting plate
Density (Kg/m3) | Shear modulus (GPa) | Yield stress (MPa) | Hardening constant (MPa) |
78.3 | 81.8 | 792 | 510 |
Hardening index | Strain rate constant | Thermal softening index | Melting point (K) |
0.26 | 0.013 | 1.03 | 179.3 |
3. Analysis of numerical simulation results
3.1. Analysis of the evolution law of shock wave pressure
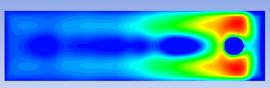
In order to clearly analyze the evolution law of shock wave in the TNT explosion process, the finite element simulation model of the shock wave pressure evolution cloud map during the explosion process is extracted. Because there are a large number of cloud map moments in the entire simulation process, we select it, and choose the explosion moment at the shock wave evolution cloud diagrams at 2.491 ms, 2.892 ms and 3.392 ms are displayed, as shown in Fig. 3.
From the above-mentioned shock wave pressure evolution cloud diagram, it can be seen that the explosion shock wave spreads in the air in the form of waves. the shock wave does not reflect when it does not meet the ground. Therefore, there is no local high pressure zone. When the shock wave propagates to the ground, reflection occurs. According to the law of shock wave reflection, the reflected pressure is 2-5 times the pressure of the incident shock wave, so a local high pressure area will be formed near the ground, as shown in the red area in Fig. 3.
Fig. 3Cloud diagram of shock wave pressure evolution process
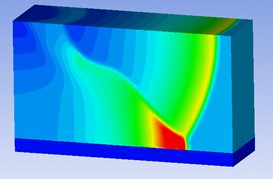
a) 2.491 ms
b) 2.892 ms
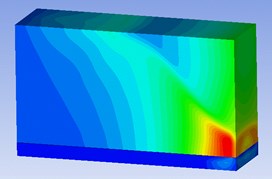
c) 3.392 ms
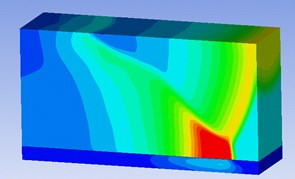
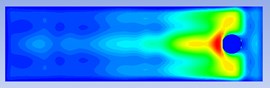
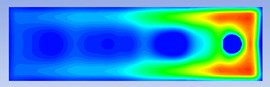
In order to analyze the impact of the sensor installation plate on the explosion shock wave propagation, the projected point of the explosion center is 3 m and the sensor installation plate inclination angle is 10°. the explosion moments are 2.495 ms, 2.534 ms, 2.589 ms, 2.638 ms, 2.689 ms and 2.728 ms respectively Analyze the evolution cloud diagram of the explosion shock wave at time, as shown in Fig. 4.
Fig. 4Cloud diagram of pressure evolution around the installation plate (tilt angle is 10°)
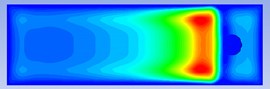
a) 2.495 ms
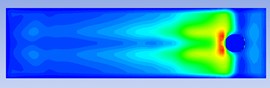
b) 2.534 ms
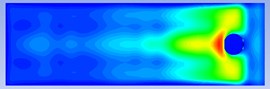
c) 2.589 ms
d) 2.638 ms
e) 2.689 ms
f) 2.728 ms
Analyzing the evolution process of the shock wave in Fig. 4, it can be seen that: (1) the evolution of the shock wave of the explosion in the air is a diffusion process that gradually attenuates from near to far in the form of a spherical wave. (2) When the sensor is installed on the plate without an angle, the pressure sphere of the shock wave will attenuate more uniformly in all directions, but when the sensor is installed on the plate at a certain angle, the spread of the shock wave will be hindered by the installation of the plate. the shock wave pressure will accumulate at the front end of the obstacle to form a local high pressure zone. the shock wave pressure here will be higher than the pressure in the surrounding area for a certain moment, but as the explosion time continues, the shock wave pressure will bypass this the obstacle continues to spread far away, and the pressure at the front end of the obstacle gradually drops, attenuating to a situation that is consistent with the surrounding pressure.
3.2. Analysis of simulation results
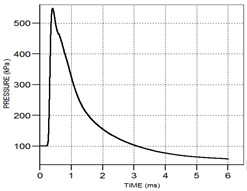
The above analysis of the evolution process of the shock wave in the air and the influence of the angle of the sensor installation plate during the propagation process of the shock wave, but the specific shock wave overpressure data cannot be directly obtained from the evolution cloud chart of the explosion shock wave, so it cannot be quantified. Analysis, so the overpressure value extraction is performed on the above shock wave simulation results, and the explosion shock wave overpressure time history curve and overpressure peak data at different distances and different angles are obtained. However, because the above shock wave curves are too many to display all of them, so Take the pressure time history curve obtained at a distance of 3 m from the burst center and the inclination angle of the sensor installation plate being 0°, 5°, and 10° respectively as an example for display, as shown in Fig. 5.
The above shock wave overpressure time curve is numerically extracted, and the peak value of shock wave overpressure is obtained at a distance of 3 m, 4 m, 5 m from the center of the burst, and the inclination angle of the sensor installation plate is 0°, 3°, 5°, 8°, 10°, respectively, as shown in the Table 2 and based on the shock wave overpressure peak when the installation angle is absolute zero, calculate the relative error between the overpressure peak at the other angles and the overpressure peak at absolute zero. the calculation results are shown in Table 3.
Fig. 5Pressure waveform diagram at 3m at different inclination angles
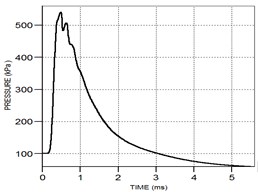
a) The inclination angle is 0°
b) The inclination angle is 50
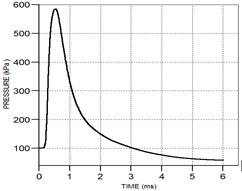
c) The inclination angle is 10°
Table 2Peak shock wave pressure at different distances and different installation angles (MPa)
Measuring point distance | Installation angle | ||||
0° | 3° | 5° | 8° | 10° | |
3 m | 0.413 | 0.435 | 0.448 | 0.450 | 0.485 |
4 m | 0.266 | 0.281 | 0.287 | 0.288 | 0.312 |
5 m | 0.086 | 0.090 | 0.092 | 0.093 | 0.495 |
6 m | 0.086 | 0.090 | 0.092 | 0.093 | 0.495 |
Table 3Relative error of shock wave pressure peak value at different distances and different installation angles
Measuring point distance | Installation angle | ||||
0° | 3° | 5° | 8° | 10° | |
3 m | 0.0 % | 5.3 % | 8.5 % | 9.0 % | 17.4 % |
4 m | 0.0 % | 5.6 % | 7.8 % | 8.3 % | 17.3 % |
5 m | 0.0 % | 6.2 % | 8.3 % | 9.5 % | 16.2 % |
6 m | 0.0 % | 4.9 % | 6.8 % | 7.6 % | 13.3 % |
Analyzing Table 2 and Table 3, it can be seen that the peak pressure of the reflected shock wave on the surface is significantly affected by the inclination angle of the sensor mounting plate. Due to the inclination of the installation plate, when the shock wave propagates to its surface, reflection will occur, causing the shock wave pressure around the plate to increase. When the shock wave encounters the mounting plate with different tilt angles, the incident angle of the shock wave increases with the increase of the tilt angle, so the pressure value measured by the sensor also increases, that is, the larger the tilt angle of the mounting plate, the corresponding Gaussian monitoring the greater the pressure value at the point; with absolute zero as the ideal value, the greater the tilt installation angle of the mounting plate, the greater the impact of the installation angle on the shock wave pressure measurement results. for example, when the inclination angle of the installation plate is 10°, the maximum relative error of the measured shock wave pressure value on the ground surface can reach 17.3 %. Therefore, in order to ensure the accuracy of the measurement results, the installation plate should be as flush with the ground as possible when performing the shock wave pressure test on the surface of the reflection spend.
4. Conclusions
This paper uses AUTODYN to establish the corresponding finite element numerical simulation model, simulates and analyzes the influence of the peak of the explosion shock wave overpressure by the inclination angle of the sensor plate installation, and compares the simulation data. the analysis results can be obtained:
1) When the explosion shock wave propagates in the air, affected by the angle of the sensor installation plate, the shock wave will gather at the front end of the installation plate, causing a local high pressure area at the front end of the plate. However, as the explosion time continues, the shock wave will bypass this plate continues to propagate forward, and the pressure at the front of the plate will gradually attenuate until it is consistent with the surrounding pressure.
2) As the angle of the sensor installation plate increases, the incident angle of the shock wave when it reaches the sensor also increases, resulting in an increase in the measured peak overpressure of the explosion shock wave, that is, when the sensor installation plate is within a certain tilt angle, the shock wave the magnitude of the peak overpressure is positively correlated with the tilt angle of the sensor mounting plate.
3) During the actual shooting range test, the sensor installation plate should be placed horizontally as much as possible, so as to accurately obtain the overpressure peak of the explosion shock wave at different measuring point distances, and provide scientific and effective data support for the damage assessment and design of the ammunition.
References
-
X. R. Meng, J. Q. Li, J. G. Ning, and X. Z. Xu, “Numerical simulation of explosion shock wave propagation in imitation bridge structure,” (in Chinese), Journal of High Pressure Physics, Vol. 33, No. 4, pp. 17–29, 2019.
-
R. L. Zhang, X. D. Cheng, Y. M. Zhang, and J. J. Jia, “Application of numerical simulation experiment method of explosive shock wave in the air,” (in Chinese), Experimental Technology and Management, Vol. 34, No. 2, pp. 110–115, 2017, https://doi.org/10.16791/j.cnki.sjg.2017.02.029
-
L. Q. Wang, F. Shang, and D. R. Kong, “Numerical simulation analysis of static and dynamic explosion shock wave,” Journal of Ordnance Equipment Engineering, Vol. 41, No. 12, pp. 208–213, 2020.
-
Y. P. Zhang, Y. Q. Sun, Y. Q. Gong, and H. L. Zeng, “Research on ground reflected shock wave pressure testing technology,” (in Chinese), in Proceedings of the 7th National Explosive Mechanics Experimental Technology Conference, 2012.
-
H. W. Zhang, Y. He, and C. Q. Zhang, “Numerical simulation on ground surface loading of shock wave from air explosions,” (in Chinese), Explosion and Shock Waves, Vol. 2, pp. 156–165, 1992.
-
C. Li, D. R. Kong, F. Shang, L. P. Li, and C. R. Zhao, “Simulation Test Study on Sensor Installation Structure of Ground Reflection Pressure Measurement,” (in Chinese), Journal of Test and Measurement Technology, Vol. 30, No. 5, pp. 442–449, 2016.
-
X. P. Zhang, J. Q. Pan, J. H. Liu, K. M. Zhang, and H. B. Mao, “Several typical problems in the use of underwater explosion free field pressure sensors,” (in Chinese), Protective Engineering, No. 3, 2015.
-
X. Tong, “Research on blast field shock wave pressure measurement and data processing method,” (in Chinese), Nanjing University of Science and Technology, 2015.
-
Y. Sugiyama, T. Homae, T. Matsumura, and K. Wakabayashi, “Numerical investigations on detonations in a condensed-phase explosive and oblique shock waves in surrounding fluids,” Combustion and Flame, Vol. 211, pp. 133–146, Jan. 2020, https://doi.org/10.1016/j.combustflame.2019.09.025
-
B. Hemmatian, J. Casal, E. Planas, B. Hemmatian, and D. Rashtchian, “Prediction of BLEVE mechanical energy by implementation of artificial neural network,” Journal of Loss Prevention in the Process Industries, Vol. 63, p. 104021, Jan. 2020, https://doi.org/10.1016/j.jlp.2019.104021
About this article

