Abstract
Ice cantilever beam is a generic construction component in cold region, referring recent decade research, many reports demonstrated ice mechanic characteristics separately, however, in most previous numerical simulations of ice material are based on the ‘Coulomb-Mohr’ constitutive models. In this article, author also used another ‘user defined constitutive model’ (‘Exponent’ temporary name), which is governed by “nonlinear isotropic harden power law” to simulate the ice cantilever beam mechanic behaviors. As per these numerical results, author made a few comparisons between ‘Coulomb-Mohr’ and ‘user defined’ model, all these compared results contain stress, strain, deformation items in elastic and plastic states respectively, in the meantime, author established series charts, such as ‘stress distributions on failure surface’, ‘dependance of loads with deformations’, ‘dependency of loads and flexural stress with equivalent and plastic strain’, etc., to prove the availability of ‘user defined’ constitutive model. Besides, author proposed some parameter assumptions for further research.
1. Introduction
Ice beam as the basic construction element which are wildly used in arctic construction activities and transportations, especially for arctic rescue work. The typical application scenarios can be simplified two situations: loads on circle area ice plates and loads on cantilever beams. Reviewing the former researches, Kerr [1], Frederking and Gold [2], firstly integrate initial ice mechanic research frame, demonstrated ice plates and beams basic mechanic behaviors which can be conducted by equations, according to massive laboratory tests, Sodhi and Morris [3], Sanderson [4], Beltaos [5] proposed relevant theoretical equations about ice mechanical parameters, such as the Young’s modulus, flexural strength, brine volume fractions, the bearing capacity of ice plate, etc. later, Masterson and Løset [6] also give comparisons about the bearing capacity of ice plate among various design codes based on empirical experiences and ISO 19906 Design codes. In the previous decade, Li et al., [7] researched the ultimate bear capacity of ice beam based on ice dynamic mechanical behaviors, overall, there are no any exceptions that they all adopted the ‘Coulomb-Mohr’ models as the constitutive model for ice material numerical simulations.
2. Problem statement
The failure patterns of ice material can be creep, crushing, bending, buckling, splitting, spalling, etc. Ice crushing failures highly dependent on the indentation speed and structure types, showing ductile and brittle mechanic characteristics accordingly (by U.S. Army [8]). Based on the study of previous theoretical calculation and numerical simulations reports, most of ice material numerical simulations based on the ‘Coulomb-Mohr’ model, however, from the tests and observations, it is obvious that the consolidation process from liquid water to solid ice, which also can be considered like the nonlinear isotropic hardening process, therefore, author proposed assumption that ice numerical constitutive model also can be substituted by ‘user defined’ model which is governed by the ‘nonlinear isotropic harden power law’. Therefore, it is valuable to perform the numerical simulations by these two models on ice cantilever beams and make some comparisons among their numerical results.
3. Experiments, methods and models demonstrations
3.1. The demonstration of cantilever beam failure experiments
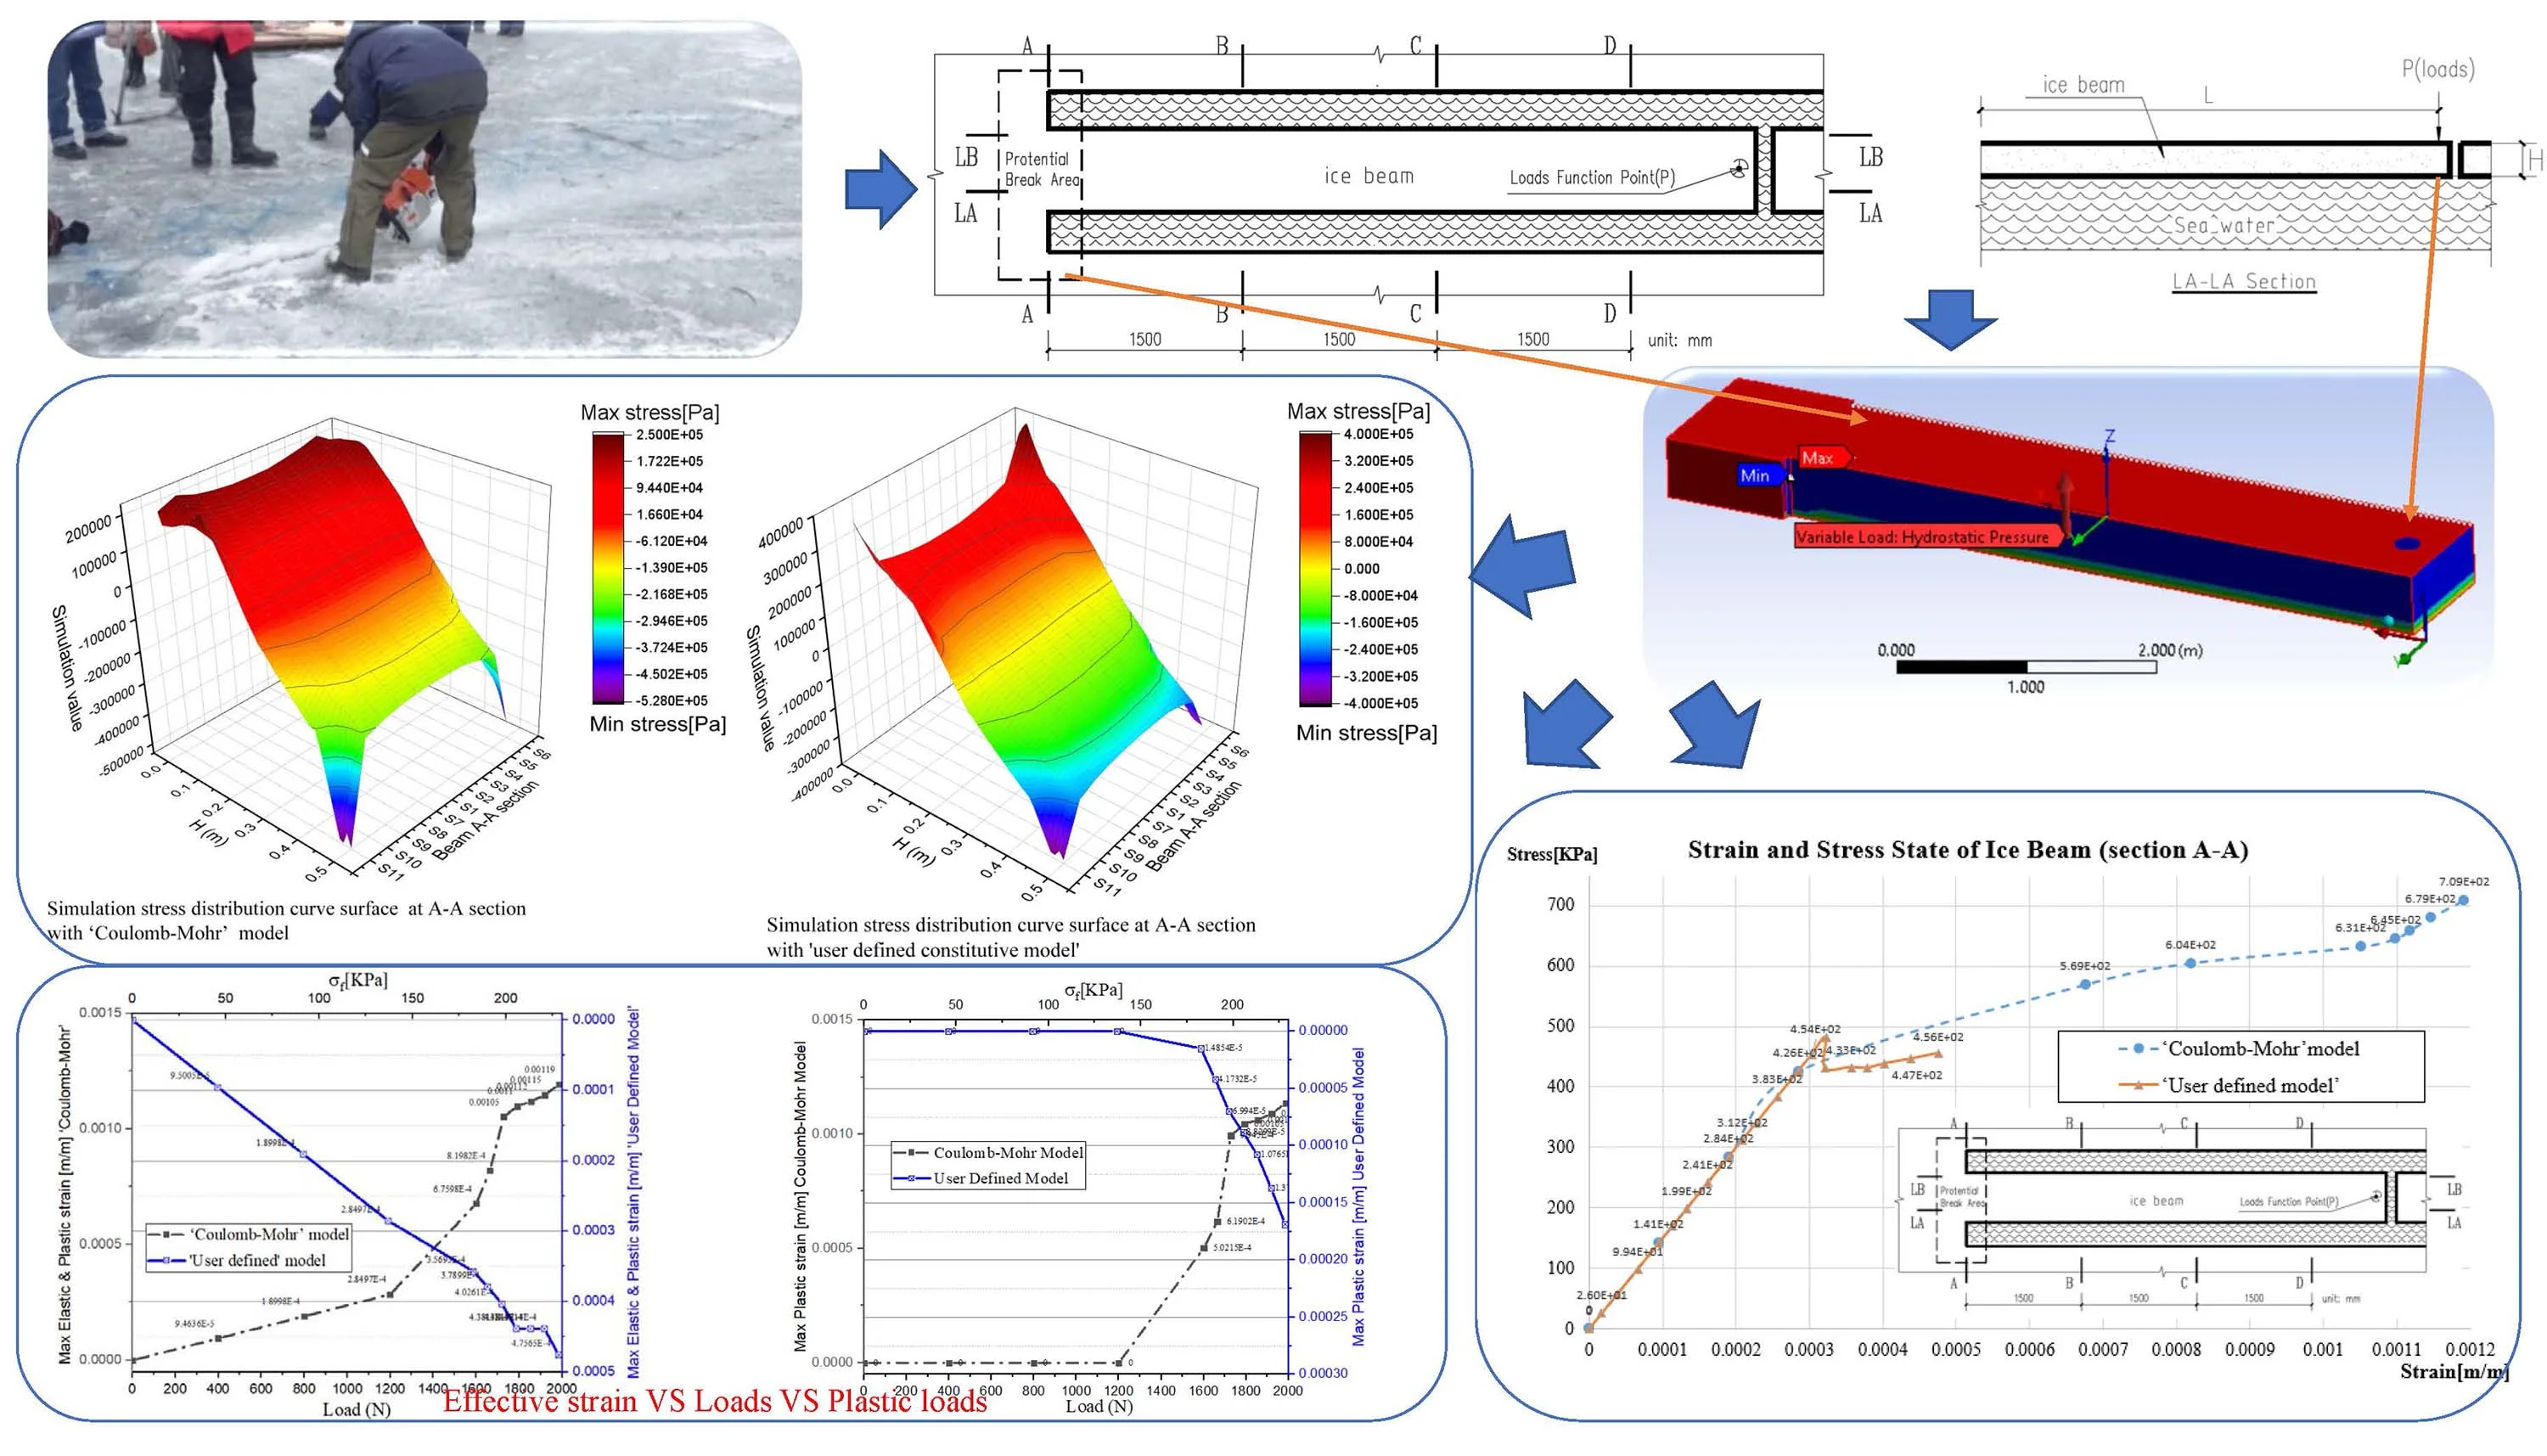
The cantilever beam failure test performed in the open air, with outdoor temperature at –2.0 °C in Novikbay in February, 2016 (Vladivostok), therefore, during the experiment process, the continuous increasing loads functioned on the ‘P’ point of cantilever beam (Fig. 1) till the beam failed around the fixed point (A-A section), the relevant parameters and beam dimensions recorded in Table 1.
Fig. 1Cantilever beam failure test scheme

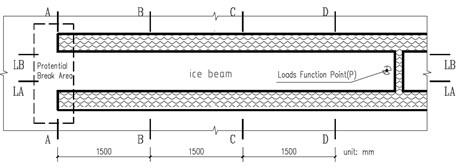
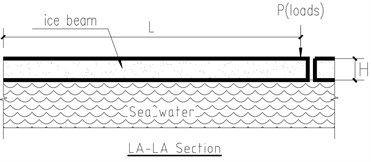
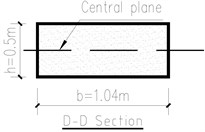
Table 1Loads parameters and beam dimensions
Parameters | Values | Parameters | Values |
Beam length (m) | 4.98 | Beam break load (KN) | 1.98 |
Beam thickness (m) | 0.50 | Buoyancy load (KN) | 2.45 |
Beam width (m) | 1.04 |
Due to the experiments performed in the static state (quasi-static), the implicit algorithm will be applied during the numerical simulation process.
3.2. The constitutive model and relevant theories demonstrations:
General descriptions about the ice microstructure constitutive properties and characteristics lead researchers regard this material like the geotechnical material categories – ‘Coulomb-Mohr’, this expression is also explained by the CSA [9], Referring the ANSYS material library (ANSYS 2020) [10], for researchers modelling, it is possible that not only adopt ‘Coulomb-Mohr’ material model, but also choose ‘User Defined Model’ (temporary name ‘Exponent’) to be deployed on the ice beams, their basic mechanic characteristics and key parameters are expressed below respectively:
1) About the ‘Coulomb-Mohr’ model [10]. when the combination of pressure and shear stress reaches the cohesion of the material particles. Yielding occurs when the shear stress on any plane in the material reaches this criterion (on yield surface), the equation expressed below Eq. (1):
where : shear strength, : apparent cohesion, : mean stress, : angle of internal friction, when material failed (), considering the failure of beam caused by maximum shear stress on the beam, also means, when the beam failure, the maximum shear stress must be on the break surface, .
2) About the ‘User Defined Model’ [10]. the power law equation has a user-defined initial yield stress and exponent . the current yield stress is given by solving the following equation Eq. (2):
where is the shear modulus determined from the user-defined elastic constants and is the accumulated equivalent plastic strain.
3) About the flexural strength, Westergaard [11] proposed the flexural strength () formulations from the perspective of geometric dimensions on the circle area ice plate, Timco & Brien [12] also expressed equations from the perspective of the brine volume fraction. In this study, we import the experiment break loads () to confirm , which is exactly conducted by the material mechanical principle Eq. (3):
where is the inertia moment, is the breadth of beam, is thickness of beam, , exert loads, is the length of beam.
4) About the deflection, the floating ice plate can be thought of as an elastic plate resting on an elastic foundation, and its deflection is governed by the differential equation which highly depended on the ‘flexural rigidity of the plate’ and ‘biharmonic operator ’, here we simplify the equation by classic material mechanic description as below Eq. (4):
Overall, the full set of ice cantilever beam mechanical and physical parameters extracted in Table 2.
4. The study of the simulation and relevant results
To analyze the stress and strain state of inner beam structure, it is necessary to mark several sections on the cantilever beam showing below (Fig. 1) and built the numerical model on ANSYS workbench (Fig. 2), full meshed procedures guided by finite element analysis procedures [14].
Stress state, strain state, deflections are the three key factors to assess the numerical model quality.
Table 2Mechanical and physical parameters (For Both models) [13]
Parameter item | Value | Parameter item | Value |
Elastic modulus (GPa) | 1.5 | Density (Kg/m3) | 917 |
Poisson’s ratio | 0.33 | Tensile Yield Strength (MPa) | 0.78 |
Bulk Modulus (GPa) | 1.47 | Compressive Yield Strength (MPa) | 1.30 |
Shear Modulus (GPa) | 0.56 | Theoretical deformation (mm) | 5.03 |
Different parameters of the two models | |||
Parameter item (Coulomb-Mohr) | Value | Parameter item (user defined model) | Value |
Apparent cohesion (KPa) | 410.0 | Initial yield stress (KPa) | 410.0 |
Angle of internal friction (Degree) | 25.0 | Exponent N | 0.2 |
Flexural strength (KPa) | 228.12 | ||
* Coulomb-Mohr model parameters measured by Zanegin, VD | |||
Fig. 2Floating ice plate and cantilever beam numerical model
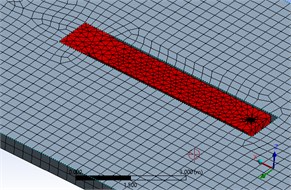
a) Float plate Outline
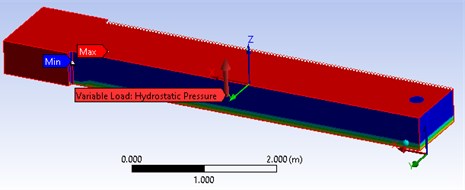
b) Detail of ice beam
4.1. Stress state analysis
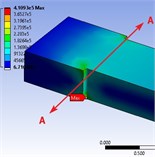
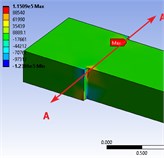
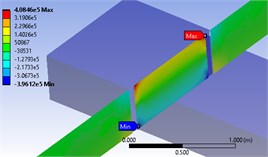
Functioned numerical model with the ‘Coulomb-Mohr’ parameters from Table 1, when loads (P) reached the measured failure loads, the simulation max failure shear stress and mean stress occurred on Section A-A (Fig. 3(a), 3(b)), substituting the simulation values (read from Fig. 3(a) and Fig. 3(b)) into Eq. (1), results come that 395.56 KPa, compared with initial condition 410 KPa, means , beam is at the critical point of failure at section A-A.
Fig. 3Stress simulation values with different constitutive models: a) max shear strength, b) mean stress, c) max normal stress
a)
b)
c)
For the user defined model (temporary name ‘Exponent’), it is easy to read the max normal stress on potential failure section A-A (Fig. 3(c)), 408 KPa, which is approximately equal to initial yield stress 410 KPa, the beam almost reached harden phrase, showed similar failure phenomenon like the previous model.
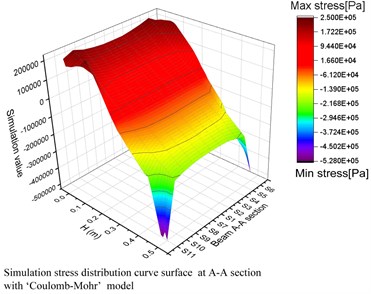
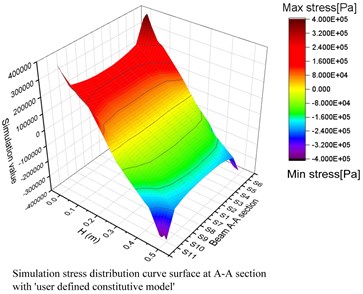
To be more precisely, focused on these models above, the marked section A-A is divided by several sub-sections showing in Fig. 4, extracting the normal stress distributions, then the 3D stress distributions charts can be established below (Fig. 5).
It is obvious that the 3D normal stress distribution charts reflected compressive and tensile values, meanwhile exhibited potential failure surface (section A-A), for these two models, most simulation stress values located in the range of (–230 KPa - 230 KPa). Apparently, due to the ‘Stress concentration effect’, a few exceeded or deviated simulation stress values appeared near the top and bottom areas. Overall, the main outline of stress distributions fit the material mechanic theory, albeit the peak values and outlines in the top (tensile) area showed different shapes.
Fig. 4Marked section A-A
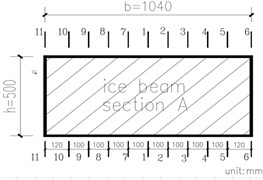
Fig. 5The stress distribution (3D) from beam section A-A
4.2. Strain state analysis
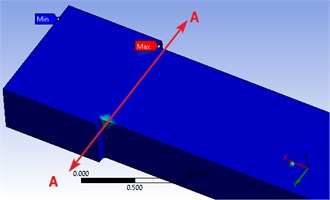
Compared with swath of float ice plate, the beam scale is much smaller than that. Masterson, et al. have demonstrated the strain measurements [15], but not suitable for the small scale beams, in this article, the beam strain states can be expressed by equivalent and plastic state respectively from the ANSYS workbench simulation results. It is easily to observe that the maximum strain occurred on section A-A (Fig. 6) from general mechanical principle and simulation results. the dependency of Max strain with loads and flexural stress depicted in Fig. 7 respectively.
Fig. 6Max strain occurred on section A-A
In terms of the ‘Coulomb-Mohr’ model, equivalent strains (refer Fig. 7(a)), have steady increment till loads reached 1200 (N), around = 140 KPa, the precise values swelled from 0 to 2.8×10⁻⁴, which indicates that strains performed elastic states, this state also can be verified in Fig. 7(b), where showed the plastic strain appeared when loads reached 1200 (N). during the loads continue growing up to the failure loads (1985 N), the irregular strain growth appeared, increased from 2.8×10⁻⁴ up to 1.2×10⁻³ till the critical point of failure came. All this procedure reflected the strain was non-linear and in irreversible plastic phrase. As for the ‘User-Defined Model’, from Fig. 7(b), it is clear that plastic strain started when loads equal to 1200 (N) as well, when loads hit the number of 1600 (N), = 170 KPa, the plastic strain increased from ‘0’ to 0.15×10⁻⁴, which is much smaller than the ‘Coulomb-Mohr’ model, the later plastic strain behavior showed linear form with the consequent loads. Overall, these numerical models can reflect the basic strain state of ice material.
Fig. 7Dependency of loads and flexural stress with strain
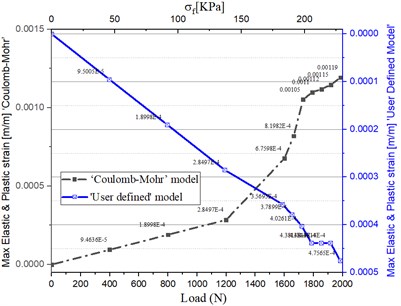
a) Equivalent strain curves
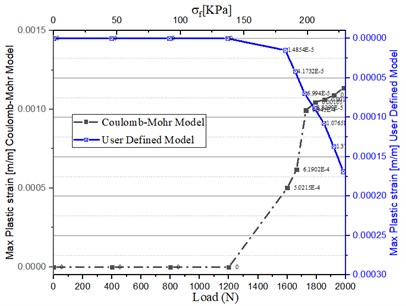
b) Plastic strain curves
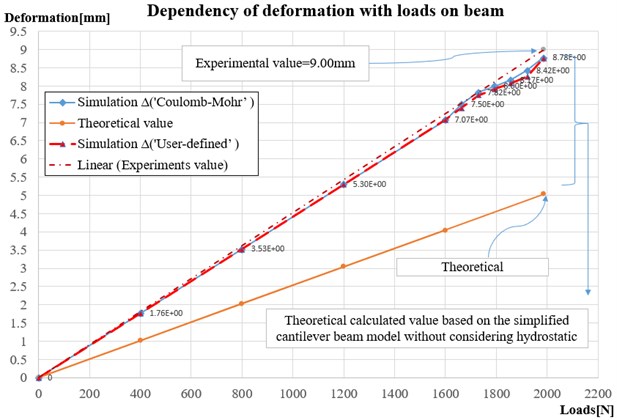
Fig. 8Dependance of loads with deformations
4.3. Deflection and strain-stress state analysis
As per Fig. 8, under the test loads, ‘Coulomb-Mohr’ model and ‘User Defined Model’ have the same deflection value 8.78 mm ,approximately equal to experimental value 9.00 mm. the simulation values fit the experimental data well, however, the theoretical calculation results = 5.03 mm have significant disparities with them, tracing back to the applied deflection equation (Eq. (3)), the possible main reason is conducted by ignoring the hydrostatic pressure.
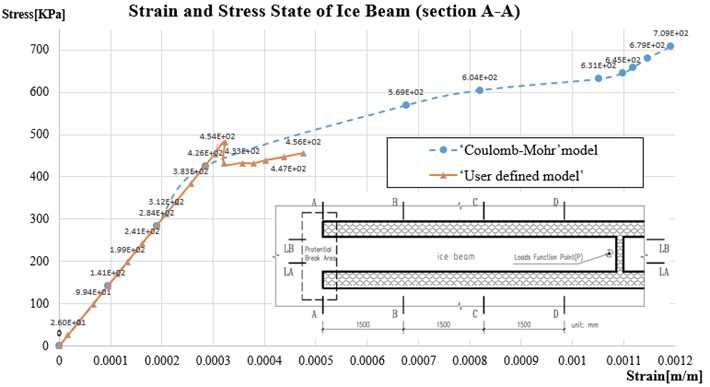
Despite of the initial assumption that ice beam can be considered as homogenous elastic components, according to the depict from Fig. 9, when exert loads functioned on beam, the strain and stress state can reflect partial non-linear mechanic pattern, also indicate the variable of Young’s Modulus. It is easy to calculate the elastic modulus from chart below at the range from 0.59 GPa to 1.5 GPa (‘Coulomb-Mohr’), and 0.24 Gpa to 3.5 GPa (‘User defined’), fit the initial parameters from Table 3.
Fig. 9Strain and stress curves of beam on section A-A
5. Conclusions
The findings from this study enhanced the understanding of the mechanic behaviors from ice cantilever beam, the numerical study included the in-depth analysis of stress, strain, deformations on solid ice beam with different constitutive models, the consequence conclusions below:
1) ‘Coulomb-Mohr’ constitutive model considered as the general model, can reflect the basic mechanical behavior of ice material under the static or quasi-static states, ‘User Defined Model’ whose failure pattern governed by ‘Non-linear isotropic harden’ power law, when the exponent coefficient = 0.2 (here author made assumption about this value), performed the similar mechanic characteristic like ‘Coulomb-Mohr’ did, as for the value, it can be a potential topic for future research and experiments.
2) From the numerical simulation perspective, under the same loads condition, ‘User defined Model’ performed smaller strain values than ‘Coulomb-Mohr’ did, however, the changing trend of elastic modulus followed the Coulomb-Mohr’s and appeared harden phrase, this phrase can be considered as the consolidation process from water to ice. Therefore, ‘User Defined Model’ can be the candidate constitutive models of ice material.
3) The plastic strain based on simulation value, can demonstrate the basic deformation trends and interior mechanic of solid beam, it is possible to predict the beam potential failure position, albeit lack of some plastic measured values from experiments. at least, the procedures pointed out a clear route to deploy the further experiments.
4) Due to the cantilever beam failure tests based on solid mechanical model, the failure pattern, positions, and failure stress values are strongly affected by the stress concentration as well. the true failure stress on the top and bottom of beam section which are shown singularity phenomenon, are obviously larger than normal values.
References
-
A. D. Kerr, “The bearing capacity of floating ice plates subjected to static or quasi-static loads,” Journal of Glaciology, Vol. 17, No. 76, pp. 229–268, 1976, https://doi.org/10.3189/s0022143000013575
-
R. M. W. Frederking and L. W. Gold, “The bearing capacity of ice covers under static loads,” Canadian Journal of Civil Engineering, Vol. 3, No. 2, pp. 288–293, Jun. 1976, https://doi.org/10.1139/l76-028
-
D. S. Sodhi and Morris C. E., “Ice forces on rigid, vertical, cylindrical structures,” Hanover, US Army Corps of Engineers, Cold Regions Research and Engineering Laboratory, 1984.
-
T. Sanderson, Ice Mechanics: Risks to Offshore Structures. London, UK: Boston: Graham & Trotman, 1988.
-
Spyros Beltaos, “Bearing Capacity of Floating Ice Covers: Theory versus Fact,” Jan. 2001.
-
D. Masterson and Løset S., “ISO 19906: Bearing capacity of ice and ice roads,” in Proceedings of the International Conference on Port and Ocean Engineering under Arctic Conditions, 2011.
-
L. Liang and K. N. Shkhinek, “The ultimate bearing capacity of ice beams,” (in Russian), Magazine of Civil Engineering, Vol. 36, No. 1, pp. 65–74, 2013, https://doi.org/10.5862/mce.36.8
-
“Ice Engineering – Engineering and Design,” EM 1110-2-1612, Army Corps of Engineers, 2006.
-
“S471-04-General requirements, design criteria, the environment, and loads,” Canadian Standards Association, 2004.
-
“Mechanical APDL,” in ANSYS – Material Property Support for the mechanical application, ANSYS, 2020.
-
H. M. Westergaard, “New formulas for stresses in concrete pavements of airfields,” Transactions of the American Society of Civil Engineers, Vol. 113, No. 1, pp. 425–439, Jan. 1948, https://doi.org/10.1061/taceat.0006179
-
G. W. Timco and S. O. ’Brien, “Flexural strength equation for sea ice,” Cold Regions Science and Technology, Vol. 22, No. 3, pp. 285–298, Mar. 1994, https://doi.org/10.1016/0165-232x(94)90006-x
-
A. T. Bekker, Probabilistic Characteristics of Ice Loads on Continental Shelf Structures Vladivostok ‘Far-Science’. (in Russian), 2005.
-
K. J. Bathe, Finite Element Procedures. Prentice Hall, 2006.
-
D. M. Masterson, K. G. Anderson, and A. G. Strandberg, “Strain measurements in floating ice platforms and their application to platform design,” Canadian Journal of Civil Engineering, Vol. 6, No. 3, pp. 394–405, Sep. 1979, https://doi.org/10.1139/l79-052
About this article

Thanks for Professor Bekker A.T and Professor Uvarova T.E and their professional consultations. All the experiments data were extracted from ‘Ice Mechanic in Winter Course’ annually in Far East Federal University.
