Abstract
Ice plate is general construction component in the cold region and the flexural stress governs its failure pattern. As per the stress equations which were proposed by Westgaard and Masterson, they explained the generic empirical methods to evaluate the extreme and effective flexural stress of ice plate. Based on these equations, most of consequent experiments and simulations referred them directly. Despite of this, there are not any demonstrations about the limitations of these equations by numerical modeling, therefore, it is possible to find the differences between the simulation values and theoretical calculation values by the deployment of numerical simulations from ‘Finite Element Analysis’ perspective, and based on these comparisons, author proposed some assumptions about the limitations of these equations. In the meantime, the simulation process can enhance the understanding of the applications of these equations.
1. Introduction
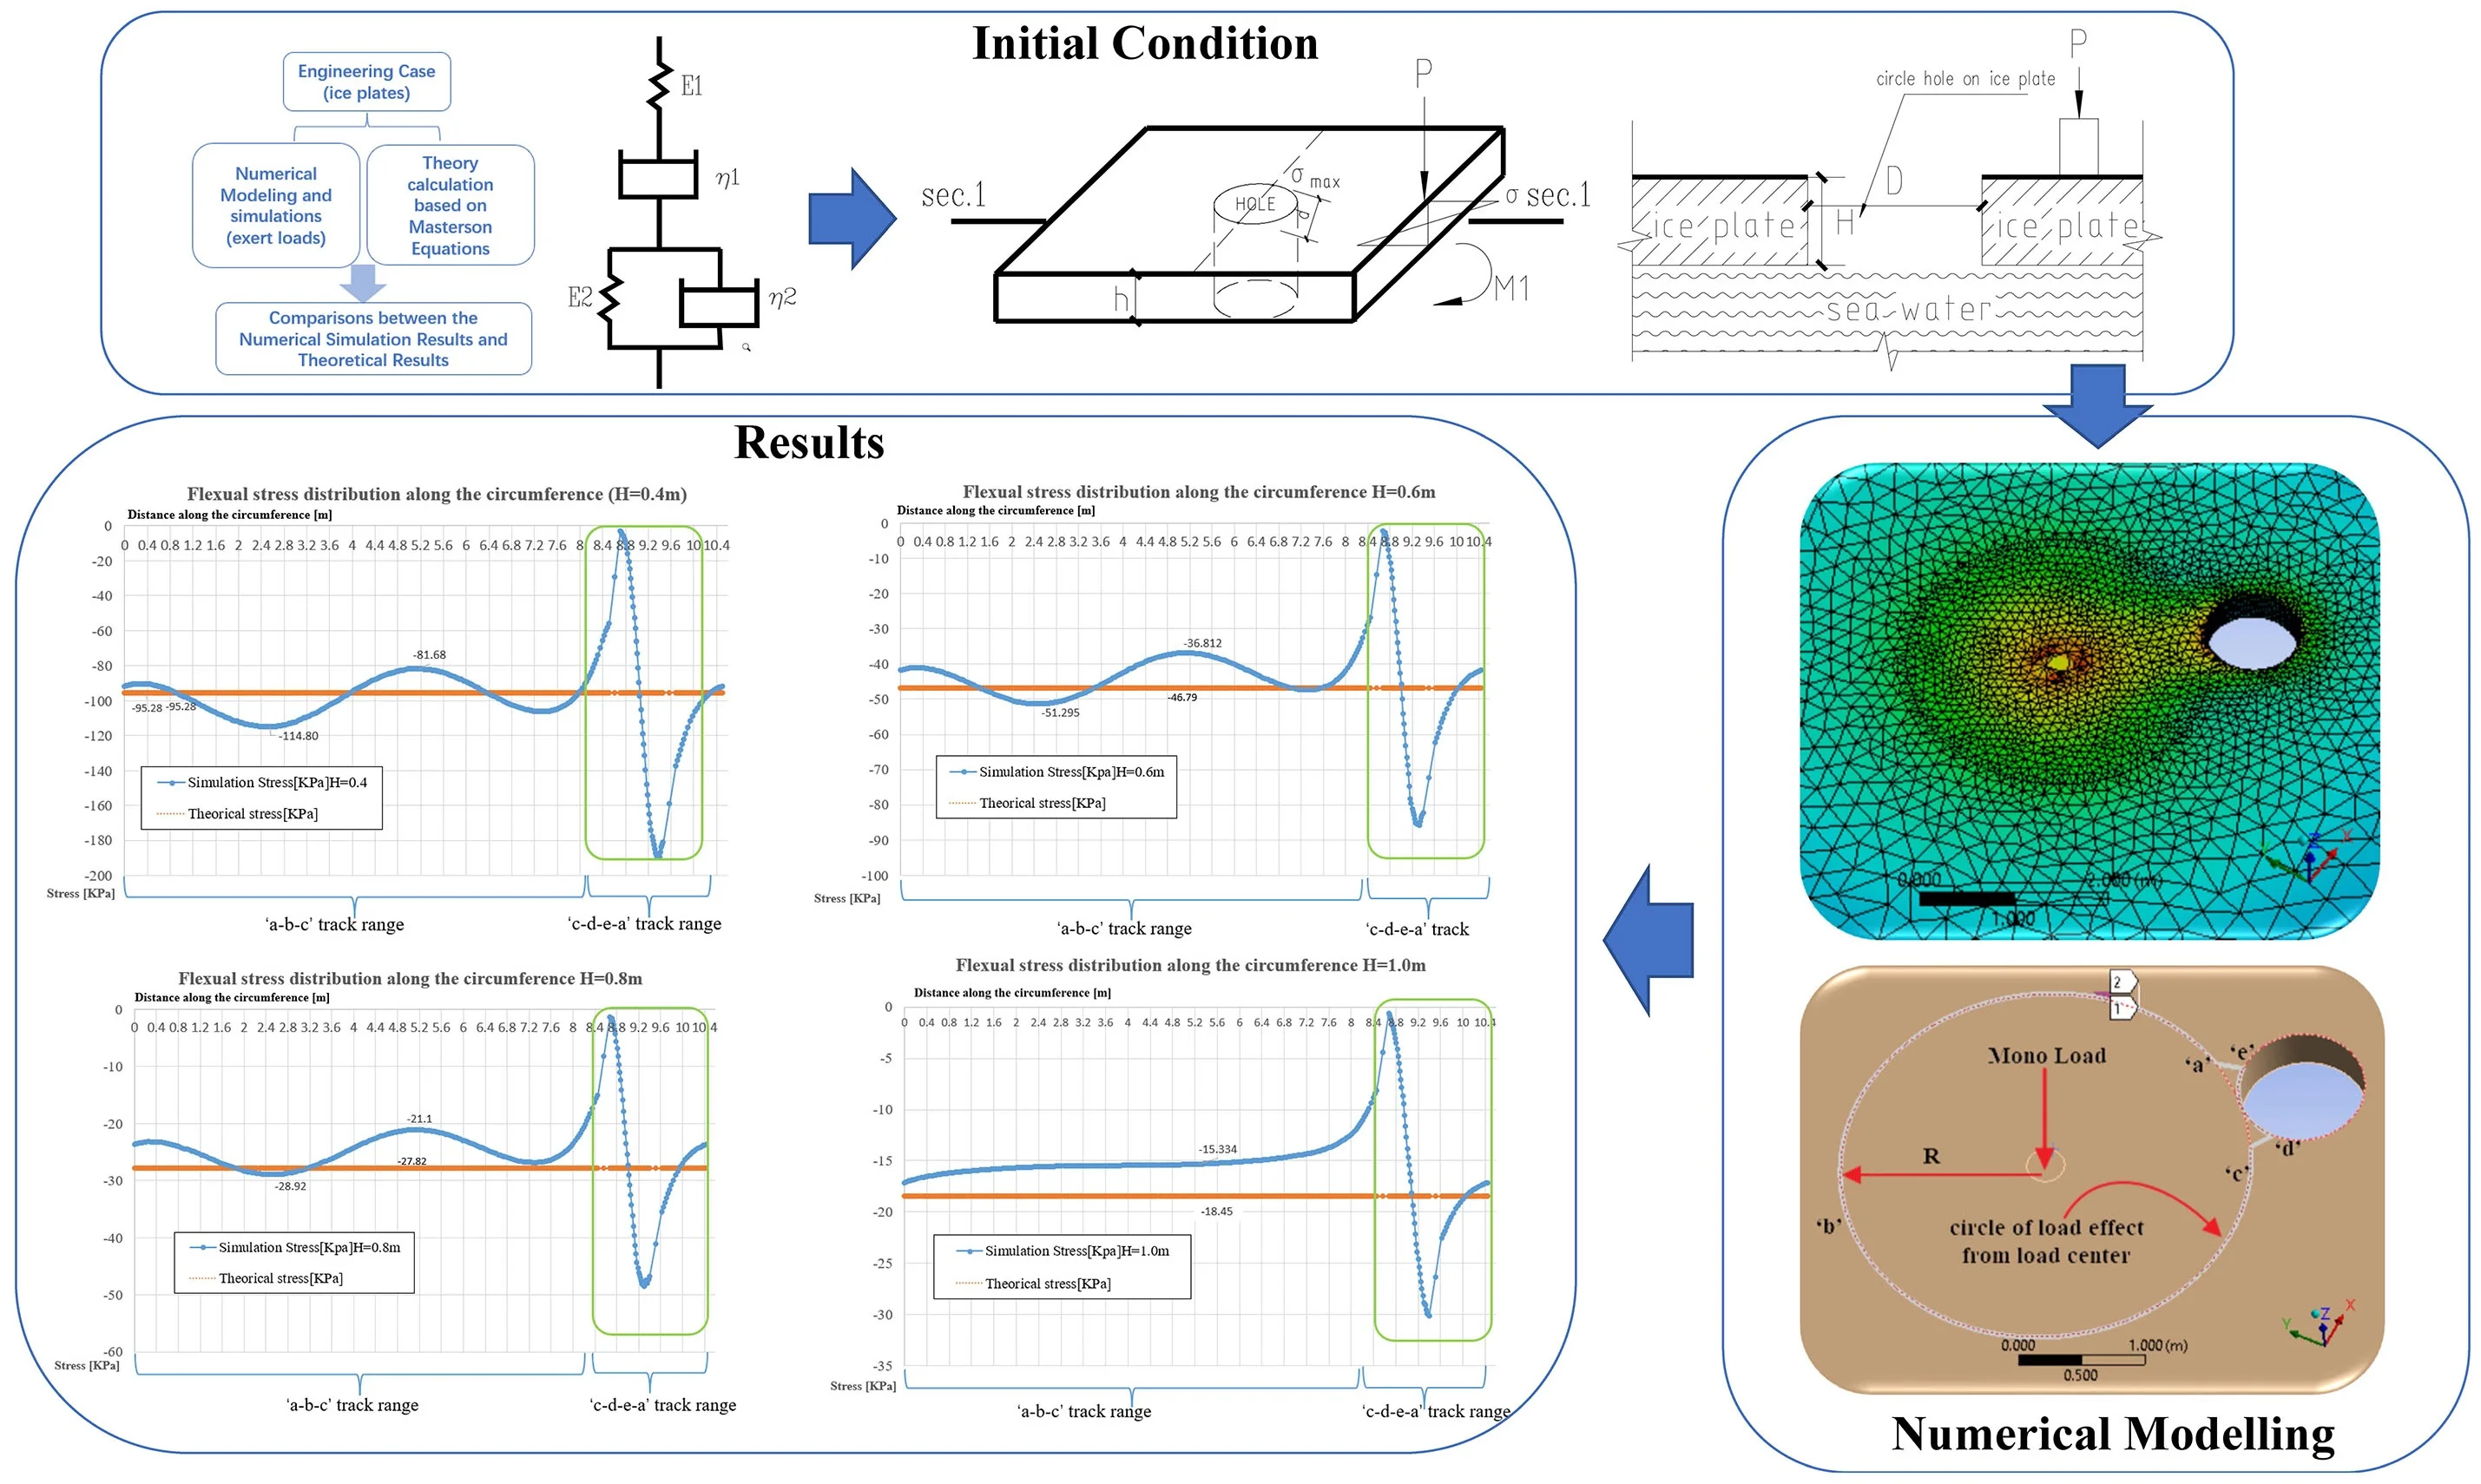
Ice plate which can be considered as generic construction element, which are usually applied on transportation road, support equipment and vehicles in cold area. As its special characteristics and working conditions, the flexural strength is the key parameters to judge the ice plates whether failure or not. From the historical research archives, it is possible to assess extreme flexural stress on the surface of the complete and continuous ice plate from the generic standard codes in the worldwide, such as ISO19906, [1], S471-04, [2], Hamburg Germanischer Lloyd [3], EM 1110-2-1612 [4], etc. Chewing these codes and demonstrations, most of them express that flexural strength is very little rate dependency, but wide scatter in the measured flexural strength. Timco, [5] compiled a database of about 2500 reported measurements on the flexural strength of freshwater ice and proposed the dependency of ice flexural strength with brine volume, but not mentioned the values on the surface of ice plate. Masterson, [6] cited the empirical equations of extreme and maximum flexural stress on surface of ice plate from former researchers directly. From these empirical equations, it is easy to get the max or extreme flexural stress with a few empirical parameters assist, these parameters are also referred by consequent researchers without any explanations, moreover, it has not been seen any numerical simulations on these equations by far. With the rapid development of the ‘Finite element analysis methods’, it is available to simulate these mechanics and empirical equations by numerical modeling, based on these simulation values, it is easy for researchers to find the stresses disparities between simulation and theorical values on ice plates, especially for the ice plate with through holes. Here author use the ‘static mono-point loads on ice plates with specified hole’ as the typical application scenario, the novelty of this article is using the numerical simulations to find the limitations of empirical equations, whose prerequisites were not mentioned in former applications. To address this issue more clearly, the basic research procedures shown in Fig. 1.
2. Theoretical demonstrations
The survey of extreme flexural stress prediction conducted by Westergaard and Masterson, who consider the ice plate acts an elastic, homogeneous, isotropic construction component on an elastic foundation, also combined with Nevel research report [7] showing the basic ice mechanic model in Fig. 2, and concluded series equations about maximum flexural stress in Eq. (1):
where maximum flexural stress in the ice sheet, Poisson’s ration, magnitude of load, elastic modulus, ice thickness, subgrade reaction (9.81 kg/m2), radius of loaded area (in this case 0.3 m) and:
Fig. 1Basic research procedures
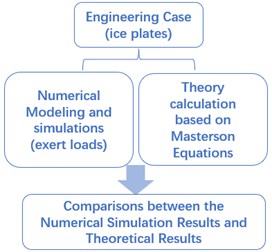
Fig. 2Basic ice mechanic model
Masterson et al. [8] submit the flexural stress which are calculated in ice plate with a distance away from the loaded area in Eq. (2):
where: distance from the center of the load, extreme flexural stress at distance from the center of the load, characteristic length
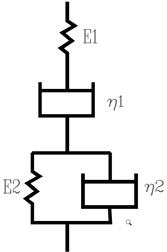
The depiction of mono load on the ice plate scenario showing below in Fig. 3(a) and Fig. 3(b), where: – quasit-static loads (KN), – thickness of ice plate (m) (in this case, 0.4, 0.6, 0.8, 1.0 m), – diameter of circle hole (m) (in this case, 0.6 m).
Fig. 3Mono point load (P) on the ice plate scenario
a) Mechanical model of ice plate
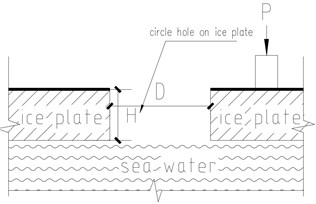
b) 1-1 Section
Generally speaking, the Column-Mohr constitutive model can be applied on ice plate under quasi-static circumstance, The full set of numerical model parameters listed in Table 1.
Table 1Physical and mechanical parameters of ice plate
Items | Value | Unit | Items | Value | Unit |
Elastic modulus | 1.5 | GPa | Apparent cohesion | 350 | KPa |
Density | 917 | Kg/m3 | Angle of internal friction | 32.2 | Degree |
Poisson’s ratio | 0.3 | Tensile Yield Strength | 300 | KPa | |
Bulk modulus | 1.47 | GPa | Compressive Yield Strength | 1000 | KPa |
Shear modulus | 0.56 | GPa | Exert load (Mono) P | 15 | KN |
Column-Mohr Constitutive parameters from former lab tests records from Bekker, A.T. [9] | |||||
3. Simulation and relevant results
Following the basic FEA procedure [10], to verify the Eq. (1) and Eq. (2), it is necessary to build the model with mono point load on ice plate and meshed model in Fig. 4(a), the stress distributions tracks followed the circumference track (‘a’-‘b’-‘c’-‘d’-‘e’-‘a’) in Fig. 4(b).
Fig. 4Numerical model of ice plate with point load
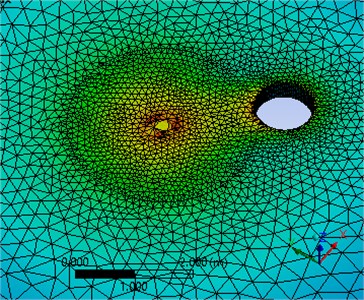
a) Ice plate mesh scheme
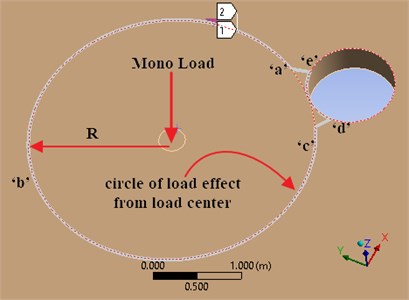
b) Stress distribution track
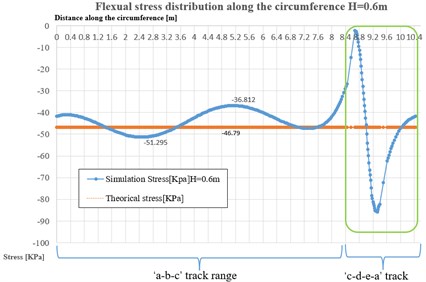
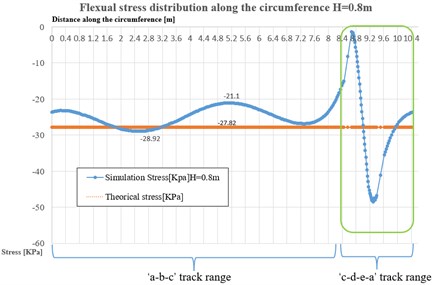
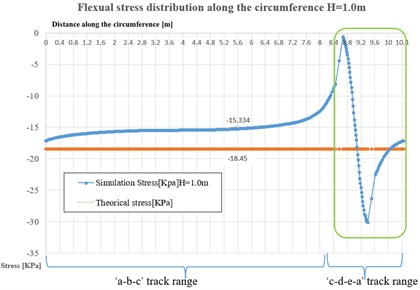
When mono concentrate loads (1.7 m, 15 KN, 0.3 m) functioned on the numerical ice plate model, we can establish series charts of dependency of max flexural stress distributions on the circumference track with various thickness of ice plate, the corresponding results listed in Fig. 5, the stress distribution results tracks(‘a-b-c’ and ‘c-d-e-a’) can be referred from Fig. 4(b).
In this numerical case, the simulation only based on the statics or quasi-statics state, the setting of loads on ice plate nearly reached the failure loads, but not break through the ice plate as a prerequisite. From Fig. 4(b) and Fig. 5, it is clear that ‘a-b-c’ track ranges on the surface of ice plate are the main part of the load effect range, the simulation values of flexural stress distribution (blue curves) have small fluctuations in these areas, the average stress values can be considered as stable and approach to the theoretical stress values (orange straight line). As for the ‘c-d-e-a’ range, they are obvious part range of through hole circle edge, the stress distribution changed in fluctuated dramatically, meanwhile, expressed the stress concentration started along the hole edge, furthermore, the simulated average values deviated further from the theoretical average values when the ice plate thickness increased, despite, the absolute deviations quantities from simulation to theoretical values seemed decreased.
As per the statistics of results from Fig. 5, the simulation and theoretical flexural stress on the circumference (1.7 m) from the loads center, valued in Table 2.
Fig. 5Stress distribution along the circumference with various thickness (H) of ice plate
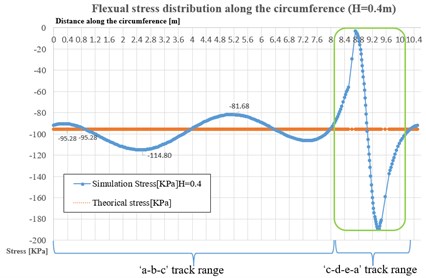
a)0.4 m
b)0.6 m
c) 0.8 m
d)1.0 m
The theory and simulation flexural stress values all smaller than the Max allowable stress in each group, followed the Equation (1) and (2) theorical assumptions, however, the error range between theory and simulation stress swelled with the increased thickness of ice plate.
Table 2Flexural stress values based on the theoretical calculation (Equation 1 and Equation 2)
Ice plate thickness (m) | Calculation flexural stress (KPa) | Simulation average flexural stress (KPa) | Calculation Max Flexural stress (KPa) | Error range ()/ % |
0.4 | 95.12 | 98.49 | 230.68 | 3.37 |
0.6 | 46.79 | 44.67 | 89.13 | 4.63 |
0.8 | 27.82 | 25.37 | 43.65 | 8.9 |
1.0 | 18.45 | 15.42 | 24.91 | 16.4 |
4. Conclusions
The findings from this numerical study enhanced our understanding the mechanic behaviors of ice plate under mono point loads, meanwhile verified the reliability of flexural stress empirical equations by the finite element analysis on ‘ANSYS work bench’, however, based on the simulation results, there are some new assumptions about the limitation of these equations, author listed below:
1) When quasi-static loads on ice plate, the numerical model of ice plate can reflect most results of empirical equations which referred by Masterson, however, if the long-term loading and creep occurs in ice plate, and complied with plastic strain and deformation, these equations are not suitable.
2) When the thickness of ice plate reaches from 0.4 m to 0.8 m, the numerical simulation flexural stress which adopt the Column-Mohr material constitutive model, performed regular fluctuation around the theory calculation values. there are about 5 %-10 % errors range between them in each group after statistic. When plate thickness is larger than 0.8 m, the data error between simulation and theory values reached more than 16 %, that means, there are some limitations for using these equations, which are not mention before. From the numerical modeling perspective, if the ice plate thickness were larger than 0.8 m, the simulation flexural stress could not be acceptable and cannot represent the theoretical values.
3) Due to the irregular shape mutation on the ice plate with through hole, the flexural stress values on circumference radius of ice plate surface, fluctuated sharply when approaching the hole. This kind of phenomenon can be considered as ‘Stress Concentration Effect’. Knowing the limitations of empirical equations, it can be more precisely to build concentration factor ‘K’ charts [11] to assess the flexural stress around the through hole on the ice plate with different radius.
References
-
“ISO 19906:2019: Petroleum and natural gas industries – arctic offshore structures,” German Standardization Institute, 2020.
-
“S471-04-General requirements, design criteria, the environment, and loads,” Mississauga, Ont.: Canadian Standards Association, 2004.
-
G. Lloyd, “Rules for classification and construction 6,” Offshore installations: Hamburg Germanischer Lloyd, 2005.
-
“Ice Engineering – Engineering and Design (EM 1110-2-1612),” USA: U.S. Army Corps of Engineers, 2006.
-
G. W. Timco and W. F. Weeks, “A review of the engineering properties of sea ice,” Cold Regions Science and Technology, Vol. 60, No. 2, pp. 107–129, Feb. 2010, https://doi.org/10.1016/j.coldregions.2009.10.003
-
D. M. Masterson, “State of the art of ice bearing capacity and ice construction,” Cold Regions Science and Technology, Vol. 58, No. 3, pp. 99–112, Sep. 2009, https://doi.org/10.1016/j.coldregions.2009.04.002
-
D. E. Nevel, “Time dependent deflection of a floating ice sheet,” US Army Cold Regions, Research and Engineering Laboratory, Jul. 1966.
-
D. M. Masterson, K. G. Anderson, and A. G. Strandberg, “Strain measurements in floating ice platforms and their application to platform design,” Canadian Journal of Civil Engineering, Vol. 6, No. 3, pp. 394–405, Sep. 1979, https://doi.org/10.1139/l79-052
-
A. T. Bekker, Probabilistic Characteristics of Ice Loads on Continental Shelf Structures. (in Russian), Vladivostok: Far-Science, 2005.
-
E. Madenci and Guven and I., The Finite Element Method and Applications in Engineering Using Ansys®. Boston, MA: Springer US, 2006, https://doi.org/10.1007/978-0-387-28290-9
-
W. D. Pilkey and Pilkey D. F., Peterson’s Stress Concentration Factors, 3rd Edition. John Wiley and Sons, 2008.
About this article

