Abstract
Hilti re-100 structural adhesive is used to plant reinforcement in concrete, and the factors affecting the anchorage performance of planted reinforcement are analyzed. The Planting reinforcement of the concrete specimen and the specimen with reinforcement anchored in concrete in advance are compared. A total of 36 groups of tests were carried out, including 27 groups of embedded reinforcement tests and 9 groups of embedded reinforcement tests. The test mainly analyzes the influence of concrete strength, reinforcement diameter and planting depth on the anchorage performance of planting reinforcement. There are three failure modes in the test, which are the separation failure of reinforcement and structural adhesive, the tensile failure of reinforcement and the separation failure of reinforcement and concrete. Through the analysis of the test data, the bond slip data curve is obtained.
Highlights
- In this paper, it is found that there are great similarities in the stress situation and anchorage mechanism between reinforcement embedding technology and reinforcement anchorage technology. In the future, the research direction of the subject can be studied from these two aspects.
- Through the high-precision test under laboratory conditions, this paper obtains the relevant data of strengthening concrete by planting reinforcement technology, which provides a data reference for practical engineering.
- The bond slip relationship curve under the measured data is established. According to the curve, it is concluded that the strength grade of concrete is a very important factor for the anchorage performance of planted reinforcement. The higher the strength grade of concrete, the better the anchoring effect of reinforcement.
1. Introduction
The aging problem of existing buildings in China is becoming increasingly prominent, and the reinforcement of concrete structure has become an important part of construction projects. According to incomplete statistics, China’s existing building area is about 60 billion square meters. After years of use, nearly 10 billion square meters of buildings cannot meet the needs of today’s life in structure, and even some structures still have certain potential safety hazards. It has brought many inconveniences to social development and people’s life. Many reinforcement technologies have been listed in [1] of relevant codes in China. As a kind of reinforcement technology, reinforcement planting technology is widely used in practical engineering because of its convenient construction and good reinforcement effect. The concept of embedded technology is positing the reinforcement in the form work before pouring concrete, and then pour the concrete. The concept of bar planting technology is to inject structural adhesive into the reserved holes of existing buildings, and use the chemical bonding performance of colloid to connect reinforcement and concrete, so make them to be a good unit. Both the steel bar planting technology and the Reinforcement embedding technology belong to the anchoring technology. However, due to the essential differences between the two technologies in concept, the former cannot be used in place of the latter, but they have similarity in many aspects. The purpose of this paper is to find the similarity between them and provide research direction for the next topic. As a Reinforcement planting technology, reinforcement planting technology is widely used in engineering. However, due to the poor construction quality in the actual application process, the problem of drilling eccentricity often occurs, resulting in the reinforcement quality lower than the expected effect. In view of this phenomenon, the purpose of this paper is to carry out high-precision experiments under laboratory conditions and measure the corresponding data, so as to provide effective data reference for practical engineering. In China, due to the relatively late start of the research on reinforcement planting technology, there is a lack of theoretical support in many aspects. In this paper, the domestic and foreign authors’ researches are analyzed and sorted out, and the experimental demonstration of other research results is carried out.
In 1993, American scholar Ronald A. cook [1-3] conducted a large number of tests on the reinforcement planting technology, summarized four failure forms, and obtained the bearing capacity formula under different failure forms.
In 1996, Michael Mc Vay [4] used PLASFEM software to conduct finite element analysis on the pull-out test of embedded bars, and obtained that the bonding stress of embedded bars can be regarded as uniform distribution in the re bonding section.
In 2006, Jianrong Zhang [6] conducted an indoor pull-out experiment on the specimens implanted with structural adhesive, and obtained a four-segment broken line bond slip curve.
In 2008, Hejun Huang [5] carried out pull-out tests on two different structural adhesives, and the bond slip curve obtained is shown as a three-segment broken line bond slip model.
In 2009, Zijiang Peng [9] studied the influence of reinforcement diameter of 12, 14 and 16 mm on the bond performance of Reinforcement planting technology. The test results show that the bond strength of Reinforcement planting technology specimen increases with the increase of reinforcement diameter, and the relationship is approximately linear,
In 2019, Jun Zhao [10] found that the ultimate tensile force of the specimen with embedded reinforcement is less than that of the specimen with Reinforcement planting, but their failure forms are similar. Through experiments, it is found that the failure forms between them are different.
To sum up, this paper arranges the research purpose:
1. The data of Hilti re-100 structural adhesive are accurately measured through indoor pull-out test under laboratory conditions, so as to provide effective data reference for practical engineering application.
2. Carry out the pull-out test under the same conditions for the Reinforcement planting specimen and the embedded steel bar specimen, explore the similarity between them, and provide the research direction for the next stage. The existing research results of planting reinforcement are demonstrated.
3. Use Hilti re-100 structural adhesive to plant reinforcement on the specimen, and analyze the effects of concrete strength, reinforcement diameter and planting depth on the anchorage performance of planted reinforcement.
Fig. 1Schematic diagram and actual diagram of the device: 1 – force sensor; 2 – hydraulic jack; 3 – Displacement meter; 4 – reaction support; 5 – displacement meter; 6 – pad; 7 – concrete substrate; 8 – steel bar
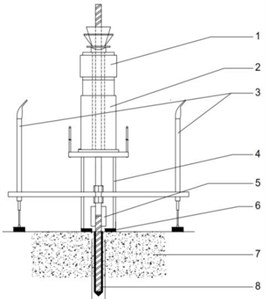
a) Theoretical experimental device
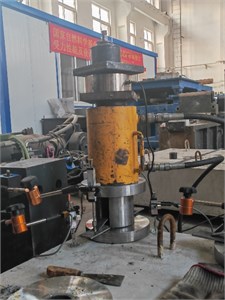
b) Actual experimental device
2. Experimental design
According to the scheme design, this test carries out the pull-out test on the Planting reinforcement specimen from three point of views: concrete strength, steel bar diameter and steel bar planting depth. The Planting reinforcement specimen is compared with the embedded steel bar specimen. The experimental parameters are shown in the below table. This test adopts the restraint pull-out test method, and the experimental device is shown in Fig. 1(a), (b). A is the schematic diagram and B is the actual test device diagram. In the test, in order to ensure the accuracy of displacement data, four displacement meters are set up respectively. In Fig. 1, 3 is a displacement meter placed symmetrically to measure the displacement of the root of the reinforcement, and 5 in Fig. 1 is to measure the small deformation of the surface of the concrete substrate during the test. The final reinforcement slip value is obtained from the difference between them.
2.1. Mechanical properties of concrete
There are four grades of concrete in this test. The average cube compressive strength of the measured concrete is shown in below Table 1. The pouring size of base material is 1100 mm × 800 mm × 400 mm. Planting and embedding reinforcement on the concrete substrate.
Table 1Mechanical properties of concrete
Concrete strength grade | Average compressive strength (MPa) of Concrete reserved test block |
C15 | 27.5 |
C25 | 35.0 |
C30 | 45.3 |
C50 | 61.0 |
2.2. Steel parameters
In order to ensure the measurement of final pull, hrb600 hot-rolled high-strength ribbed bars with diameters of 16 mm, 20 mm and 25 mm are selected for all reinforcement in the test. The mechanical properties of the reinforcement used in the experiment are shown in Table 2.
Table 2Mechanical properties of reinforcement
Diameter mm | Yield strength fy/N.mm-2 | Ultimate strength fu/N.mm-2 | Yield bearing capacity, kN | Extreme bearing capacity, kN |
16 | 671.28 | 843.70 | 134.97 | 169.63 |
20 | 678.15 | 861.25 | 213.04 | 270.57 |
25 | 641.24 | 833.65 | 318.42 | 405.17 |
3. Structural adhesive
The structural adhesive adopts Hilti re-100 type, and its mechanical properties are shown in Table 3.
Table 3Mechanical properties of structural adhesive
Project | Theoretical value | Remark |
Colloidal bending strength/MP | 94.6 | No |
Colloidal compressive strength/MP | 106.6 | No |
Colloidal splitting tensile strength /MP | 20.1 | No |
Tensile shear strength/MP (23±2 ℃) | 20.9 | Steel sheet tensile shear test |
Binding strength of rib and concrete bonding strength/MP | 14.1 | C30, Φ25, 150 mm |
20.5 | C60, Φ25, 125 mm |
4. Factors affecting binding anchorage performance
4.1. Concrete strength
The concrete with three strength grades of C15, C30 and C50 is used as the test variable. Three steel bars are planted on each concrete substrate, a total of 9 steel bars. The steel bars are not broken during the test, so there are 9 effective samples. The diameter of the selected reinforcement is 16 mm, the anchorage depth of the reinforcement is 5D = 80 mm, and the drilling diameter is 20mm. The test results are shown in Fig. 2 and Fig. 3.
Fig. 2Ultimate pulling force
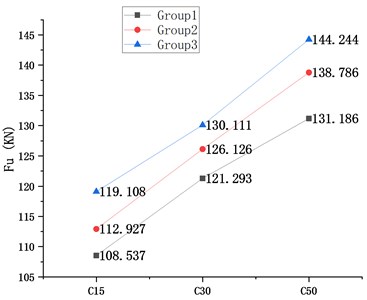
Fig. 3Bond strength
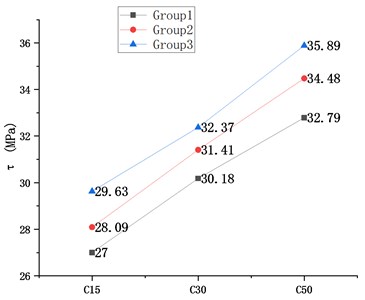
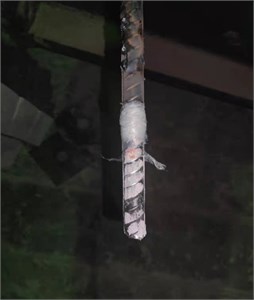
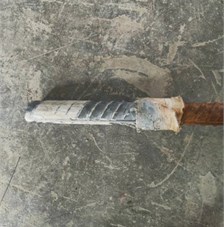
It can be seen from Fig. 2, 3 that when the reinforcement diameter is 16mm and the anchorage depth is 5D, the ultimate tensile force and ultimate bond strength of the embedded reinforcement specimen increase linearly with the increase of concrete strength. The failure mode is structural adhesive and reinforcement peeling failure, as shown in Fig. 4.
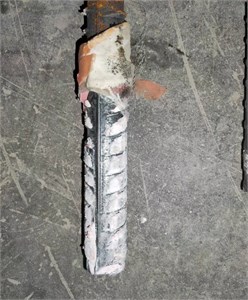
Fig. 4Peeling failure of structural adhesive and reinforcement
4.2. Steel diameter
The diameter of reinforcement shall be 16 mm, 20 mm and 25 mm respectively, and the anchor depth shall be 80 mm, 100 mm and 125 mm respectively. The concrete grade is C25. The drilling diameter is 20 mm, 25 mm and 32 mm. There are 3 bars of each diameter and 9 effective specimens. The test results are shown in Figs. 5 and 6. Because the ultimate pulling force of the test piece is relatively close, it cannot be effectively marked in the figure. The detailed data are shown in Table 4.
Table 4Ultimate pulling force
Steel diameter / mm | Ultimate pulling force / KN | ||
16 | 103.911 | 108.865 | 113.164 |
20 | 236.210 | 228.739 | 222.770 |
25 | 291.400 | 295.865 | 301.310 |
As can be seen from Fig. 5, when the embedded depth of reinforcement and the concrete strength are same, the ultimate tension of embedded reinforcement specimen increases approximately linearly with the increase of reinforcement diameter. When the diameter of reinforcement is less than or equal to 20 mm, the bond strength increases with the increase of reinforcement diameter and shows an approximate linear relationship. However, when the diameter of reinforcement reaches 25 mm, the bond strength decreases significantly compared with that when the diameter of reinforcement is 20 mm. This paper believes that this phenomenon is due to the diameter of the reinforcement is too large. When the reinforcement is stressed, the bonding force produced by the structural adhesive is unevenly distributed along the reinforcement. As a result, the bonding stress at the interface between structural binder and reinforcement decreases, so the bonding strength decreases with the increase of reinforcement diameter. When the diameter of reinforcement is what, the bond strength is the largest, which still needs to be proved by test. All failure modes are structural adhesive and reinforcement peeling failure. Fig. 7 shows the failure form of reinforcement with a diameter of 25 mm.
Fig. 5Ultimate pulling force
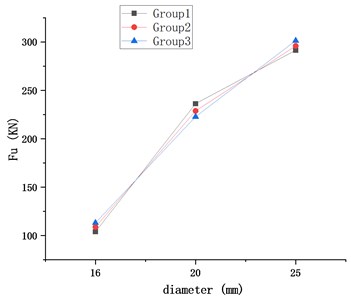
Fig. 6Bond strength
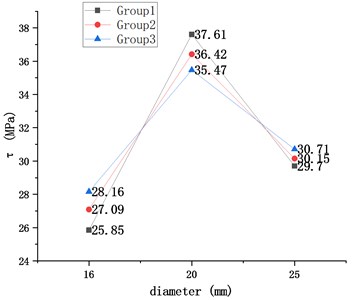
Fig. 7Peeling failure of structural adhesive and reinforcement
4.3. Planting depth of reinforcement
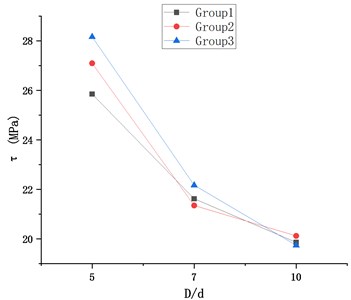
The reinforcement diameter is 16 mm, the concrete strength is C25, and the planting depth is 5D, 7d and 10d respectively. The corresponding lengths are 80 mm, 112 mm and 160 mm. There are three specimens with the borehole diameter of 20 mm and the depth of embedded reinforcement of 5D and 7d respectively, and four specimens with 10d. One of the four specimens with a depth of 10d was broken during the test. So, the valid data are 9 groups. The test results are shown in the figure. Figs. 8 and 9 shows since the ultimate pulling force is close, it cannot be effectively marked in the figure. The detailed data are shown in Table 5. The failure mode is spalling failure of structural adhesive and reinforcement.
Table 5Ultimate pulling force
Plant / mm | Extreme drawing force/KN | ||
5d | 103.911 | 108.865 | 113.164 |
7d | 121.645 | 120.178 | 124.763 |
10d | 159.651 | 161.724 | 158.700 |
It can be seen from Figs. 8 and 9 that the ultimate pulling force increases significantly with the increase of planting depth, but the bond strength decreases with the increase of planting depth. The author believes that the reason is that the bond stress is unevenly distributed along the planting depth with the increase of planting depth, resulting in the decrease of bond strength with the increase of planting depth.
Fig. 8Ultimate pulling force
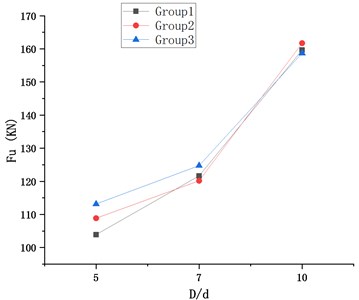
Fig. 9Bond strength
4.4. Anchorage method
Two different anchoring forms are adopted: embedding the reinforcement in the concrete in advance and planting the reinforcement on the concrete specimen. The concrete grade is C25, and the reinforcement diameters are 16 mm, 20 mm and 25 mm respectively. The hole diameters are 20 mm, 25 mm and 32 mm respectively. There are 3 rebars of each diameter, a total of 18 rebars. All specimens were damaged during the experiment, so the effective specimens were 18. The failure form of the embedded specimen is the peeling failure of concrete and reinforcement, and the Planting reinforcement specimen is the peeling failure of structural adhesive and reinforcement.
Fig. 10Ultimate pulling force
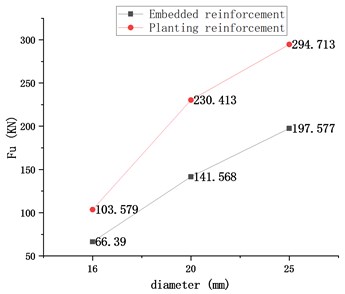
Fig. 11Bond strength
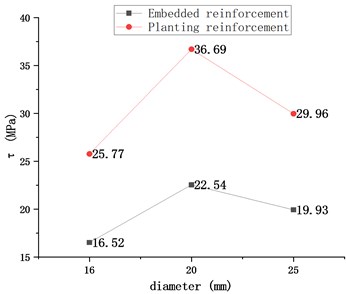
According to Fig. 10, the ultimate pulling force of Planting reinforcement specimen and embedded specimen increases gradually with the increase of reinforcement diameter. The ultimate pulling force of Planting reinforcement specimen is greater than that of embedded specimen. With the increase of steel diameter, the gap between them becomes more and more obvious. According to Fig. 11, when the reinforcement diameter is less than or equal to 20 mm, the influence of reinforcement diameter on bond strength is also approximately linear, but when the diameter of Planting reinforcement reaches 25 mm, the bond strength decreases significantly. The test results of the Planting reinforcement group are more significant than those of the embedded group. Figure 12 shows the damage picture of 25 mm reinforcement of embedded group.
Fig. 12Peeling failure of reinforcement and concrete
5. Bonding – slip maintenance curve
At present, there are three main methods to obtain the bond slip curve. The first is obtained from the measured data, in which the bond strength can be obtained according to the following formula:
The bond strength is obtained by using the measured load value, and the bond slip curve is obtained. The second method is to combine theoretical analysis with experiment, infer the bond slip formula by using theoretical knowledge, and then obtain the uncertain constant by mathematical analysis, so as to obtain the bond slip curve. Thirdly, the strain of reinforcement is measured in the test, and the average stress of concrete interface is deduced by using the equation. The average compressive strain of reinforcement is obtained, and the concrete strain is obtained by multiplying the concrete strain non-uniformity coefficient and the average compressive strain of reinforcement. The second and third methods are cumbersome. The first method is often used in engineering. This paper will also use the first method to obtain the bond slip curve. In 2006, Jianrong Zhang [1] proposed a four-segment broken line bond slip curve, as shown in Fig. 13.
Fig. 13Four segment broken line bond slip curve
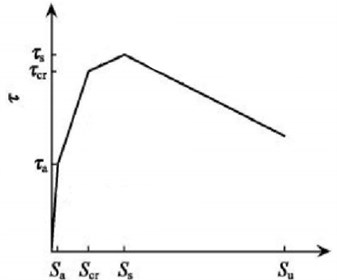
In this figure, the first stage is the bonding stage, the second stage is the viscous stage, the third stage is the splitting stage, and the fourth stage is the sliding stage.
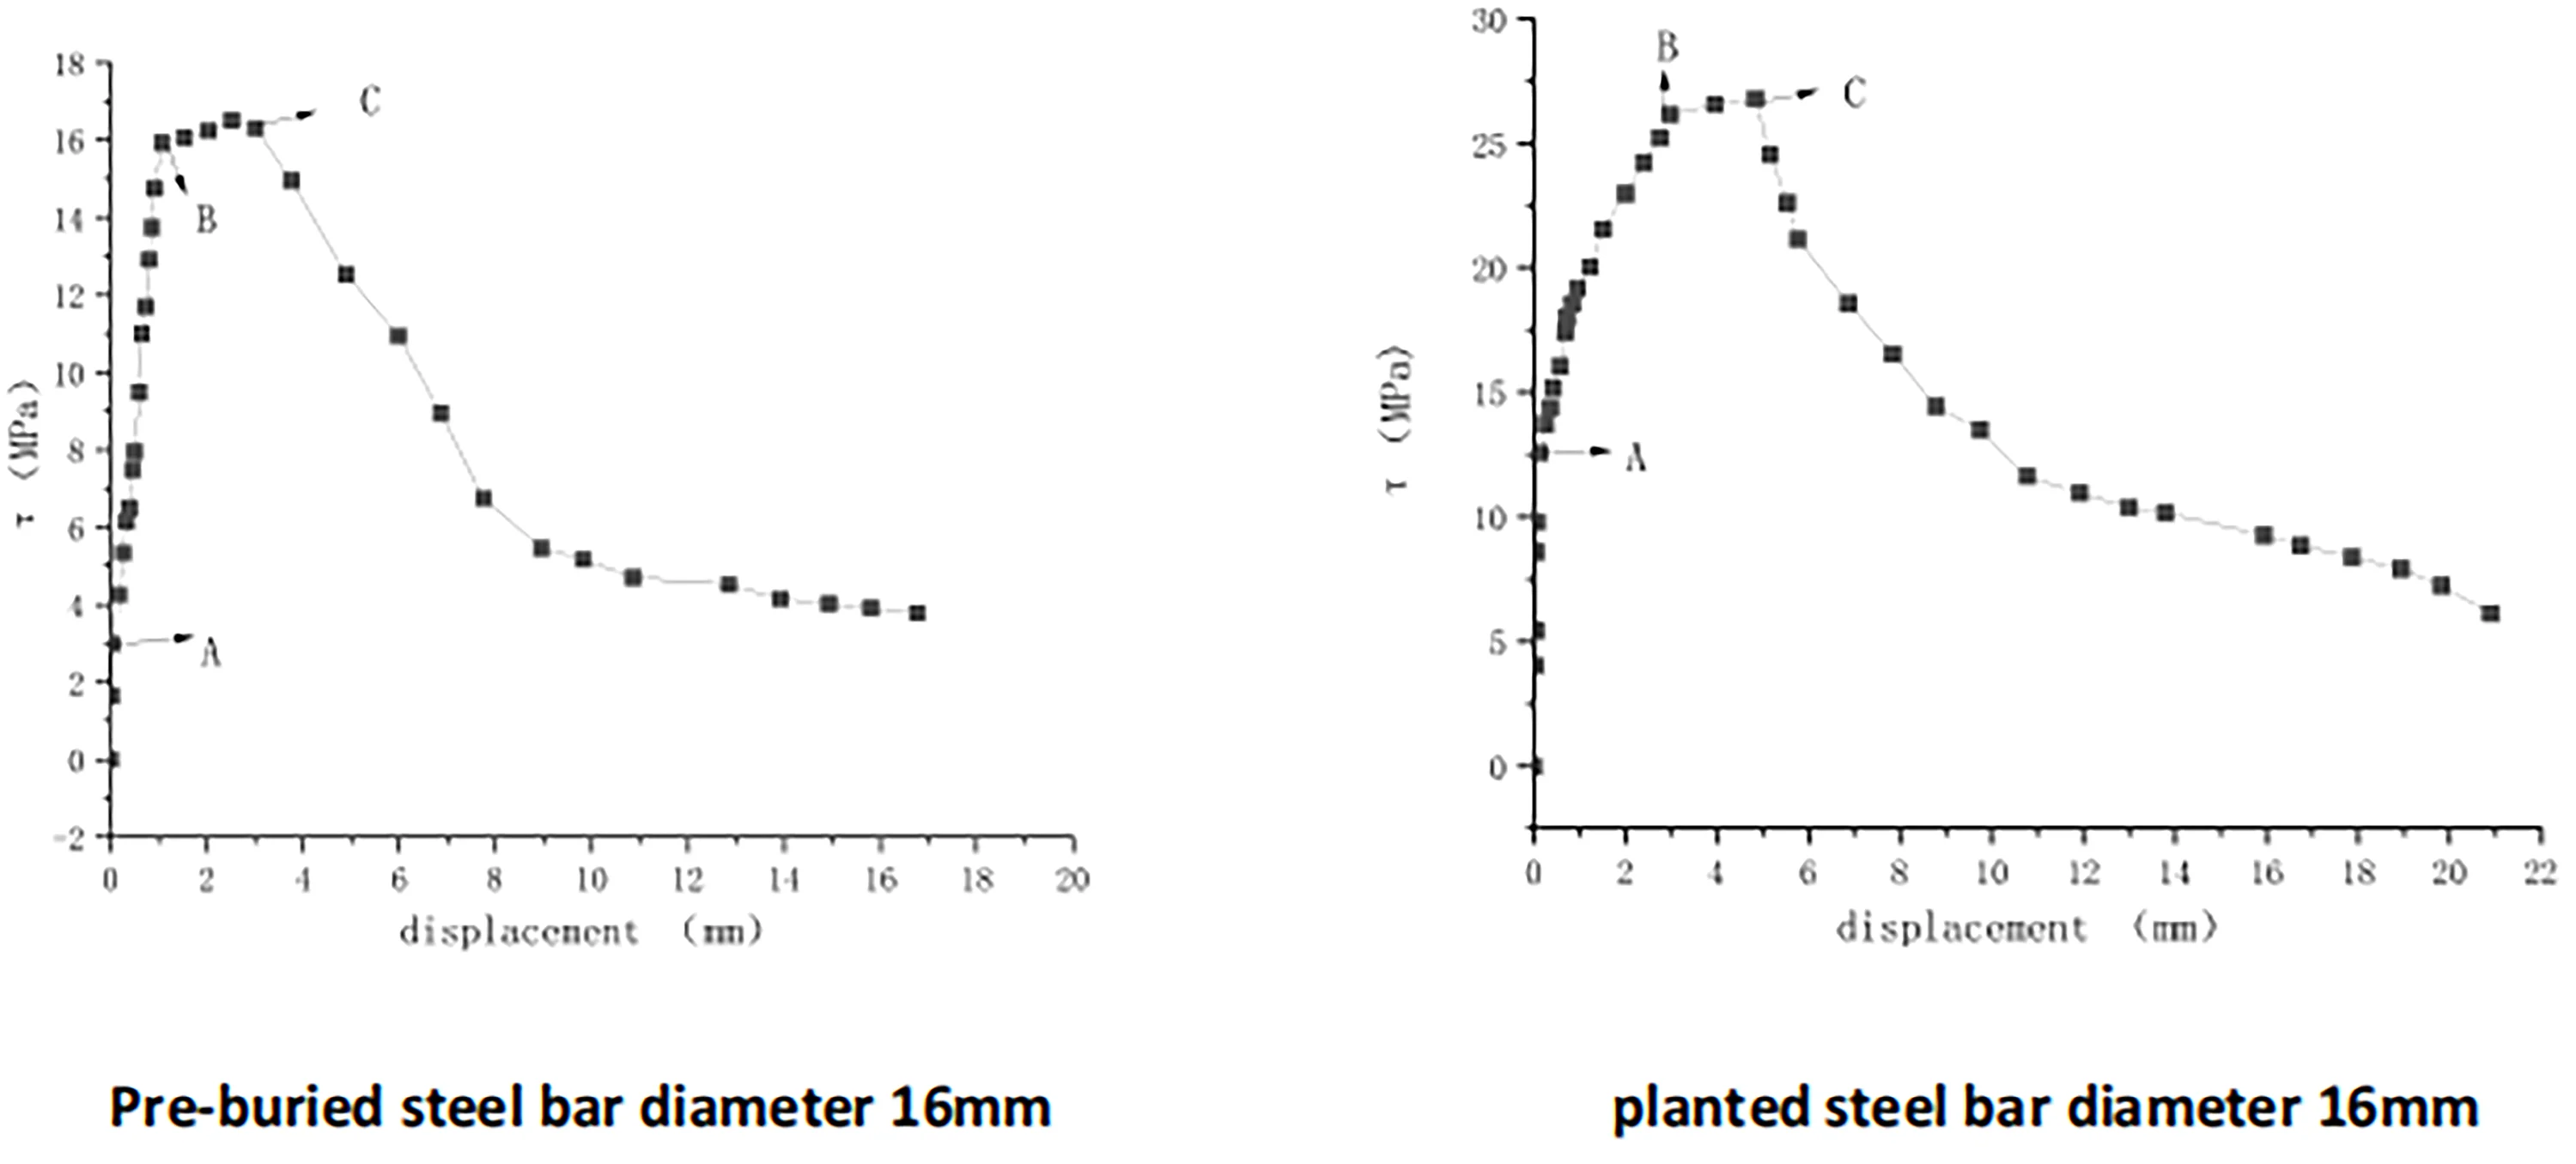
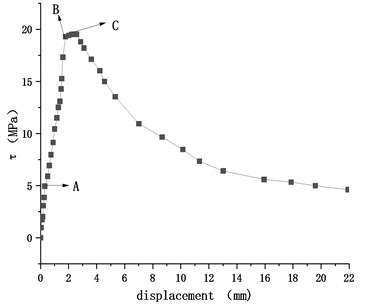
In this paper, the bond slip relationship between concrete group, reinforcement diameter group and reinforcement diameter of 16 mm and 25 mm in embedded group is established, as shown in Figs. 14-22. The established curve basically conforms to the four-segment broken line bond slip curve proposed by Jianrong Zhang. The end points of each stage in the figure are marked with A, B and C.
Fig. 14Concrete group C15 bond slip curve
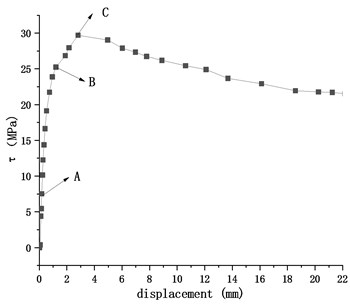
Fig. 15Concrete group C30 bond slip curve
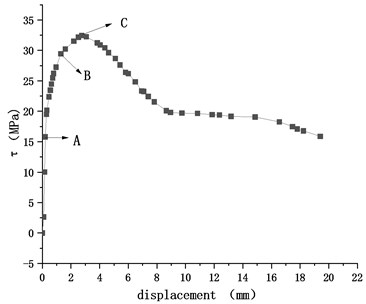
Fig. 16Concrete group C50 bond slip curve
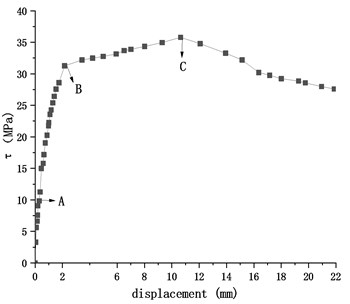
Fig. 17Steel group diameter 16 mm bond slip curve
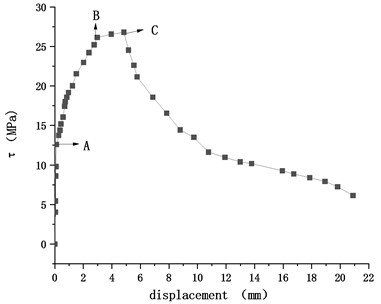
Fig. 18Steel group diameter 20 mm bond slip curve
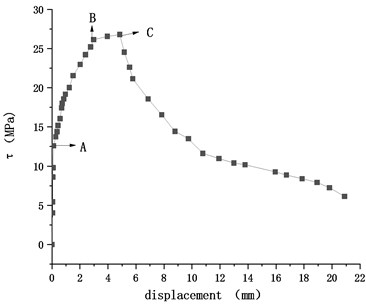
Fig. 19Steel group diameter 25 mm bond slip curve
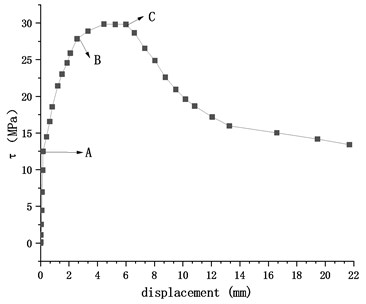
Fig. 20Pre-buried steel bar diameter 16 mm
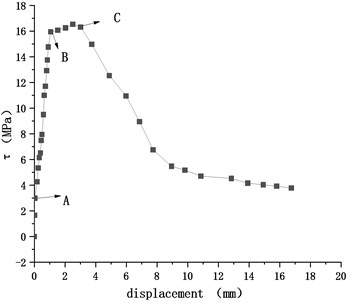
Fig. 21Pre-buried steel bar diameter 25 mm
6. Conclusions
1) The pull-out test results of Planting reinforcement in concrete group show that the ultimate tensile force and ultimate bond anchorage strength of embedded bars increase with the increase of concrete and show a linear relationship. The failure mode is the peeling failure of structural adhesive and reinforcement.
2) The pull-out test results of Planting reinforcement in the reinforcement diameter group show that the ultimate pulling force of Planting reinforcement increases approximately linearly with the increase of reinforcement diameter. However, the bond strength does not increase with the increase of reinforcement diameter. This paper believes that the reason is that the increase of reinforcement diameter leads to the uneven distribution of bond stress around the reinforcement after stress, resulting in the decrease of bond stress, so the bond strength decreases with the increase of reinforcement diameter. When the diameter of reinforcement is large, the bond strength is the largest, which needs to be proved by experiments.
3) The results of the reinforcement depth group show that the ultimate tensile strength increases significantly with the increase of the reinforcement depth, but the bond strength decreases with the increase of the holding depth. In this paper, the author thinks that as the planting depth increases, the bond stress appears uneven distribution along the planting depth, which leads to the phenomenon that the bond strength decreases with the increasing of planting depth.
4) The test results of anchorage group show that the ultimate tension increases gradually with the increase of reinforcement diameter, and the ultimate pulling force of Planting reinforcement specimen is greater than that of embedded specimen. With the increase of the diameter, the difference between the two is obvious. The results of bond strength test are the same as those of reinforcement diameter group.
5) The bond slip relationship curve under the measured data is established, which is basically consistent with the four-segment broken line bond slip curve related to Jianrong Zhang. It can be seen from the image of the concrete group that with the improvement of the concrete grade, the longer the displacement involved in the third stage (splitting stage) in the test stage. The concrete strength is C50, which is the third stage displacement of nearly 10 mm. According to this phenomenon, it can be concluded that the strength grade of concrete is a very important factor for the anchorage performance of embedded reinforcement. The higher the strength grade of concrete, the better the anchoring effect of reinforcement. The images presented in the reinforcement diameter group show that changing the reinforcement diameter has little effect on the bond slip curve. It means that not the larger diameter of the reinforcement is, the anchorage performance of the embedded reinforcement specimen is more favorable.
6) By comparing the bond slip curves of embedded steel bar specimens and Reinforcement planting bar specimens, it can be seen that the trend of the two curves is basically the same. In this paper, it is considered that there are great similarities between the stress and anchorage mechanism of them, and the research direction of the future subject can be studied from these two aspects.
7) Through the high-precision test under laboratory conditions, this paper obtains the relevant data about the reinforcement of concrete by planting reinforcement technology, which provides a data reference for practical engineering.
References
-
R. Cook, G. Doerr, and R. Klingner, “Bond stress model for design of adhesive anchors,” ACI Structural Journal, Vol. 90, No. 5, pp. 514–524, 1993.
-
Ronald A. Cook, Jacob Kunz, Werner Fuchs, and Robert C. Konz, “Behavior and design of single adhesive anchors under tensile load in uncracked concrete,” ACI Structural Journal, Vol. 95, No. 1, pp. 9–26, 1998, https://doi.org/10.14359/522
-
R. A. Cook, “Behavior of chemically bonded anchors,” Journal of Structural Engineering, Vol. 119, No. 9, pp. 2744–2762, Sep. 1993, https://doi.org/10.1061/(asce)0733-9445(1993)119:9(2744)
-
M. Mcvay, R. A. Cook, and K. Krishnamurthy, “Pullout simulation of postinstalled chemically bonded anchors,” Journal of Structural Engineering, Vol. 122, No. 9, 1996.
-
Hejun Huang, “Experimental study on interface bonding mechanism of concrete planting reinforcement,” Journal of Building Structure, Vol. 7, pp. 39–42, 2008.
-
Jianrong Zhang, “Experimental study on the anchorage performance of Jianrong Chemical Planting Bolus,” Journal of Building Structure, Vol. 6, pp. 45–47, 1994.
-
“Concrete Structure Reinforcement Design Specification: GB50367-2013,” China Construction Industry Press, Beijing, 2013.
-
“Concrete structure after anchorage technical regulations: JGJ145-2013,” China Construction Industry Press, Beijing, 2013.
-
Shengjiang Peng, “Experimental experiment of bonding anchorage performance of concrete planting,” Jilin Traffic Technology, Vol. 4, pp. 38–43, 2009.
-
Jun Zhao, “Experimental study on bonding anchoring performance of concrete planting structure,” Suzhou University of Science and Technology, Suzhou, 2019.
-
Tingting Wang, “Study on bonding and anchoring properties of inorganic anchoring materials for concrete structures,” University of Jinan, 2012.
About this article

