Abstract
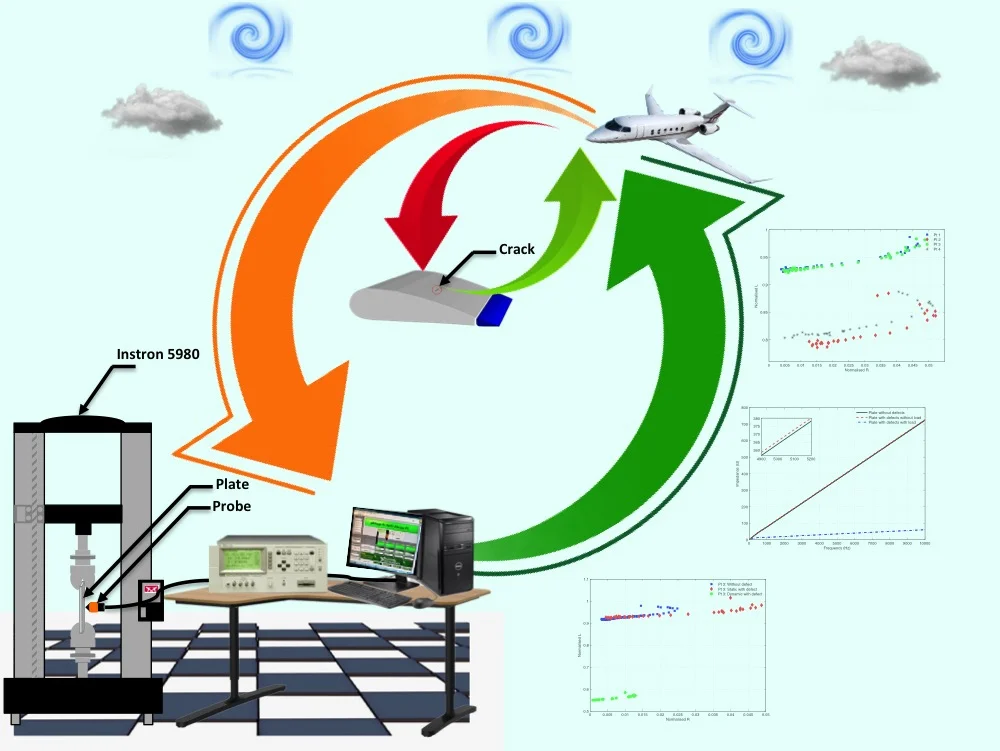
Eddy current testing is widely used for non-destructive evaluation of conductive materials where an induced current created by a variable magnetic field propagate on the material surface and sensed by a special sensor. The main purpose of this paper is to study the influence of the stress field near the crack tip especially in the singular and elaborated zones of aeronautical material aluminium 7075-T6 to eddy current non-destructive testing enhanced with a very particular type of probe to have better stresses sensitivity. This experimental part understands impedance variations due to the stress with high measurement reliability and shows that eddy current control is very sensitive to the stress and produces significant changes in magnetic parameters that mean stress should be considered in mechanical parts inspection.
Highlights
- Eddy current control is very sensitive to the stress and produces significant changes in parameters.
- Unidirectional elastic load applied on the cracked plate decreases the impedance due to the thermal agitation and the change of magnetic parameters as the magnetic permeability from the same frequency.
- In practice, stress should be considered in mechanical parts inspection.
1. Introduction
Fracture mechanics is the mechanical analysis of materials containing one or more macroscopic cracks to predict failure apparition. This analysis is generally non-destructive and done by the strain and stress fields’ determination near the crack tip where singularity problems must be taken into consideration [1]. Non-destructive testing detects surface or internal defect without damaging the material in order to guaranty the systems safety. In practice, many different non-destructive methods are used; their choice depends on several parameters among them: the nature of the material, the shape of the part to be controlled, the environment and the economics constraints.
Eddy current testing is widely used for non-destructive evaluation of metallic structures in characterizing numerous types of defects occurring in various locations [2]. Eddy current testing is applied to conductive materials where an induced current created by a variable magnetic field propagate on the material surface and sensed by a special sensor [3]. The current distribution depends on geometry, electrical conductivity, and magnetic permeability of the material. When discontinuity presence, the current distribution is no longer the same because discontinuity disturbs the current circulation, which creates a variation in the material impedance [4]. Consequently, the eddy current testing can be analysed by the resistance, the reactance, and the impedance diagram.
Reference [5] developed a pulsed eddy current technique as well as specific eddy current probes to overcome limitations in eddy current inspection. The designed probes significantly increase the scope of inspection using standard commercially available instruments. Pulsed eddy current signals are proposed also in [6], where the obtained results show the effectiveness of this method in quantifying defects in multi-layer structures. The microstructure characterization of materials especially at the heat-affected zones near welds using eddy current techniques was analysed in [7] where a significant improvement in the accuracy and reliably of these measurements was confirmed. As it is challenging to detect defects in riveted structures of old aircraft, [8] proposed the averaging method and wavelet analysis method to deal with this situation. A three different probes, including a differential hall probe, a differential coil probe, and a two-stage differential coil probe were also proposed. Furthermore, [9] presented an experimental characterization of a linear array probe dedicated to the eddy current imaging of sub-millimetre surface breaking defects appearing in bore holes of metallic parts. The experimental results demonstrate a good sensing ability of the designed probe. In the same context, [10] presented a new integrated eddy current sensor for proximity sensing and for the detection of micro cracks on the surface of metals. Another study, [11] analysed eddy currents generated by high-speed movement and their characterisation in high-speed magnetic flux leakage (MFL) inspection using numerical simulations. In addition, [12] proposed a finite element modelling to investigate the effectiveness of pulsed eddy current in detecting deep-lying cracks of different sizes and orientations. Eddy current testing and a machine-learning algorithm named support vector machine are used in [13] to determine accurately the thickness of metallic plates. Advantages of pulsed excitation current over conventional harmonic excitation for measuring the ferromagnetic plate thickness are studied in [14]. Reference [15] proposed a numerical tool used to predict the eddy current signal obtained from a material subjected to stress. The tool was based on the combination of a 3D finite element approach with a magneto-mechanical constitutive law describing the effect of stress on the magnetic permeability. Moreover, [16] reviewed the basic principles, measurement procedures, advantages, and limitations of eddy current residual stress profiling.
All these cited research papers aimed to understand deeply the eddy current testing properties. However, none of these references provide a detailed experimental or analytical analysis of the stress characterization into the crack singular zone.
The aim of this paper is the stress characterization into the crack singular and elaborated zones using an experimental approach based on the eddy current control with a special type of probe conceived in our laboratory [7]. This probe offers high impedance measurement reliability mainly at the chosen singular point.
The remainder of this paper is organized as follows. Section 2 presents the experimental methodology followed in Section 3 by results discussions and analysis where the impedance diagram was measured and interpreted. Section 4 is the last section where conclusions are presented. The main contribution of this study is the experimental design of a particular probe used to stress characterization, particularly into the crack singular zone.
2. Experimental methodology
Eddy current testing is widely used to detect surface cracks in case of electrically conductive materials. In this technique, eddy currents are produced in the material by putting it close to an alternating current generated from a special probe. The alternating magnetic field of the probe is altered by the magnetic fields of the eddy currents. This alteration can be measured by impedance variation. The fundamental laws of electromagnetism describe the magnetic field and the induced currents distribution in conductive materials. When using eddy current the material impedance could be evaluated by considering:
Furthermore, the evaluation of the dissipated energy in the material through a Joule effect is given as follows:
and the stored energy can be expressed as follows:
Eddy current testing, in this experimental part, is used to control cracked samples made with 7075 aluminium alloys, which is widely used in the aviation and aerospace industries. It is necessary to proceed to tensile test before the eddy current control. Tensile testing is a destructive test process that provides information about the tensile strength; yield strength, and ductility of the metallic material [17]. The tensile test is performed by means of the Instron 5980 machine, shown by Fig. 1, in order to determine the elastic zone.
When eddy current test is started, the high precision impedance is measured by using Agilent 4284A-LCR precision impedance analyser with a frequency range from 20 Hz to 1 MHz, this instrument is shown by Fig. 2.
Fig. 1Instron 5980

Fig. 2Agilent 4284A impedance analyser
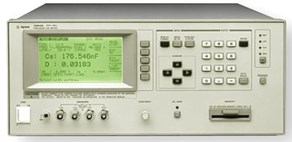
Fig. 3The developed probe
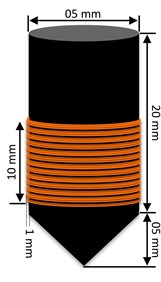
Fig. 4Cracked plate dimensions
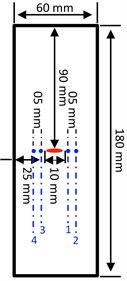
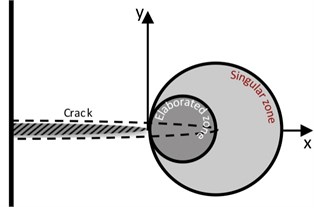
Eddy currents are produced in plate made with 7075-T6 aluminium alloys through a special developed probe [7] made with ferrite and shown by Fig. 3. The form of this probe is conical with a circuit electromagnetic diameter of 6.5 mm and 20 mm high, wrapped by 450 turns wire with a diameter 0.013 mm. This proposed probe facilitates the test at precise point where the crack tips likely appears. The aluminium plate with 0.3 and 73 GPa is a 60 mm width, 180 mm height, and 3 mm depth as shown by Fig. 4, where an elliptical crack with 10 mm width and 0.5 mm depth at the plate centre is also presented. The probe scanning is performed near to this elliptical crack precisely at four selected points numbered from 1 to 4. Points 2 and 4 are located in the elaboration zone and points 1 and 3 are located in the singular zone. The couple of points (1, 2) and (3, 4) are both separated with 5 mm. The elaborated and the singular zones are presented in Fig. 5.
Fig. 5Stress zone near the crack tip
Eddy current testing is performed in two steps. First, in static case that is without load. Second, in dynamic case that is with 5 KN load applied to the plate at an ambient temperature. The electrical circuit is powered by 220V voltage exciting the plate by an alternating current of 1 mA and a frequency range from 20 Hz to 1 MHz.
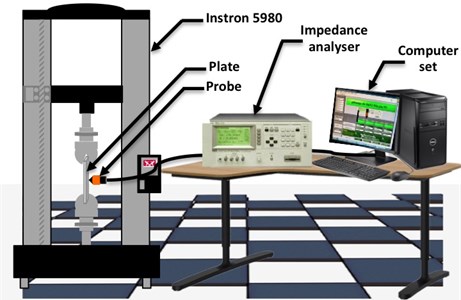
The experimental set-up is shown in Fig. 6, and the associated results are provided in the following.
Fig. 6Experimental set-up
3. Experimental results and discussion
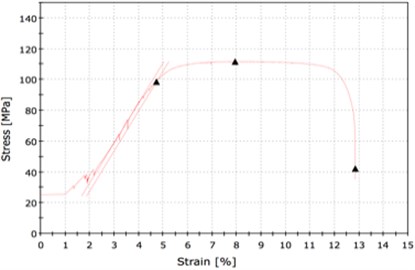
First, Stress strain curve is presented in Fig. 7, where the curve exhibit typical linear response up to 5 % strain then reach the maximum stress value which is 110 MPa were it becomes nearly constant from 5 % to 11.5 %. Behind this last strain value, the stress values decrease brutally. The results of the tensile test are summarised in the Table 1 performed by means of the Instron 5980 machine, shown by Fig. 1.
Table 1Tensile test results for plate without defect
Elasticity limit (MPa) | Maximum load (KN) | Tensile strength (MPa) | Displacement max (mm) |
98.58 | 20.11 | 111.72 | 23.49 |
Fig. 7Stress strain curve
Second, in the static case, where the plate is considered without defect, impedance is computed from the obtained resistance () and reactance () values. Note that impedance is evaluated at different frequencies, which are 0.5 KHz, 1 KHz, and 10 KHz. The obtained results are summarised in Table 2.
Table 2Experimental values of R, L and Z and for the plate without defect
(KHz) | (H) | (Ω) | (Ω) | |
Plate without defect | 0.5 | 0.011808 | 19.0058 | 41.6645 |
1 | 0.011703 | 19.6532 | 76.0771 | |
10 | 0.011512 | 27.3179 | 723.4695 |
The normalised and are calculated as follows:
where 0.012454 (H); and 18.26930 (Ω).
Fig. 8Impedance diagram for the plate without defect
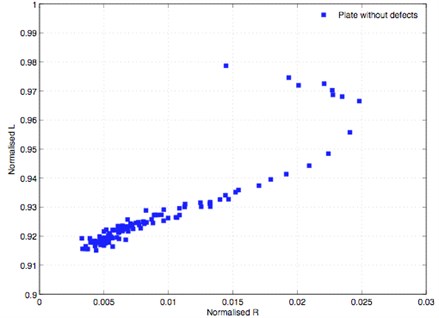
The impedance diagram obtained by drawing normalised vs. normalised is presented by Fig. 8. This curve is considered as a reference for comparative purposes.
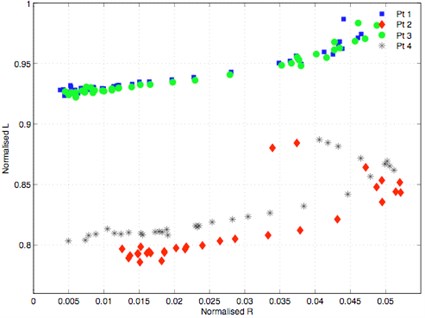
Then, the static case with defect is considered. Similarly, the impedance is computed for 0.5 KHz, 1 KHz, and 10 KHz frequencies. The obtained results are summarised in Table 3 for the four points 1, 2, 3 and 4 presented in Fig. 4. In this situation the impedance diagram is shown by the Fig. 9.
Table 3Experimental values of R, L and Z for the plate with centred crack at point 1, 2, 3 and 4 in static case
Point | (KHz) | (H) | (Ω) | (Ω) |
1 | 0.5 | 0.01214 | 19.616 | 42.8706 |
1 | 0.011749 | 20.5419 | 77.7313 | |
10 | 0.011674 | 22.4058 | 733.4695 | |
2 | 0.5 | 0.012155 | 19.269 | 42.7550 |
1 | 0.011954 | 20.1616 | 76.5898 | |
10 | 0.011584 | 30.336 | 728.1074 | |
3 | 0.5 | 0.012062 | 19.3336 | 42.8631 |
1 | 0.011799 | 20.3672 | 77.7191 | |
10 | 0.011569 | 22.054 | 727.999 | |
4 | 0.5 | 0.01215 | 19.5384 | 42.5238 |
1 | 0.011958 | 20.0204 | 76.8459 | |
10 | 0.011587 | 22.1268 | 726.8678 |
Fig. 9Impedance diagram of plate with centred crack in static case
Finally, the case of the loaded plate with defect is studied. The obtained results for the impedance are summarised in Table 4, also for the four points 1, 2, 3 and 4. In this condition, the impedance diagram is given by the Fig. 10.
Fig. 10Impedance diagram for plate with centred crack with unidirectional load F= 5 KN
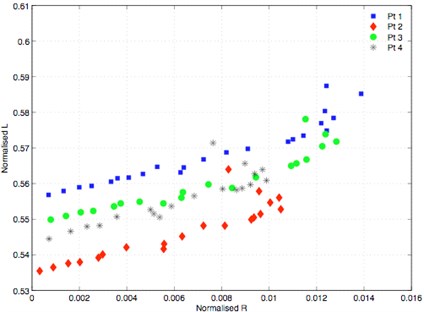
The experimental impedance diagrams presented by Figs. 8, 9, and 10 are almost similar to the well-known eddy current characteristic impedance curve [18], which confirms the quality of the obtained results. In case of the plate with elliptical defect at the centre and without load from the same frequency, Fig. 9 shows an impedance diagrams resemblance at points 1 and 3, the same applies to points 2 and 4. This can be attributed to the impedance increasing when approaching to the tip due to the increase in the energy dissipated by Joule effect and the decrease of stored energy at the singular zone. The same curves behaviour was observed at these points when applying a load however the values are dropped, which is consequently reflected by the decrease in impedance. These results are mentioned in Tables 2, 3, and 4.
Furthermore, when comparing between plate with and without defect for the same frequency, it is observed from Fig. 9 and 10 that the defect presence increases the impedance owing to the fact that energy is dissipated by Joule effect. However, the presence of elastic uniaxial load decreases the impedance due to the increase in the energy dissipated by Joule effect and the decrease of stored energy at the singular zone.
Table 4Experimental values of R, L and Z for plate with centred crack at points 1, 2, 3 and 4 with F= 5 KN
Point | (KHz) | (H) | (Ω) | (Ω) |
1 | 0.5 | 0.000996 | 12.1985 | 12.5930 |
1 | 0.00095 | 12.3225 | 13.6990 | |
10 | 0.000902 | 13.4418 | 58.2186 | |
2 | 0.5 | 0.000978 | 12.1925 | 12.5732 |
1 | 0.000962 | 12.3209 | 13.7223 | |
10 | 0.000915 | 13.3775 | 58.1986 | |
3 | 0.5 | 0.001021 | 12.2559 | 12.6682 |
1 | 0.000951 | 12.3873 | 13.7518 | |
10 | 0.000927 | 13.6154 | 59.7865 | |
4 | 0.5 | 0.001009 | 12.2384 | 12.6418 |
1 | 0.000981 | 12.3814 | 13.8294 | |
10 | 0.000938 | 13.602 | 60.4564 |
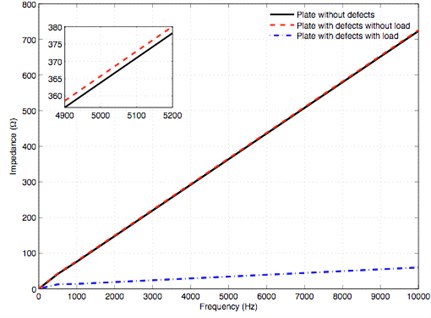
When considering the crack tip, such as at the point 3, obtained results are presented in Table 5. Fig. 11 presents the impedance diagram at point 3 for the situations: Plate without defect, plate with defect and without load and plate with defect and with load. Fig. 12 shows the impedance versus frequency at the point 3 for these last cited situations.
Table 5Comparison of experimental value of R, L and Z at the crack tip without defect, in static case and with unidirectional load F= 5 KN
(KHz) | Plate | (H) | (Ω) | (Ω) |
0.5 | Without defect | 0.011808 | 19.0058 | 41.6645 |
Defect and static | 0.01214 | 19.616 | 42.8706 | |
Defect and load | 0.000996 | 12.1985 | 12.5930 | |
1 | Without defect | 0.011703 | 19.6532 | 76.0771 |
Defect and static | 0.011799 | 20.3672 | 77.7191 | |
Defect and load | 0.000951 | 12.3873 | 13.7518 | |
10 | Without defect | 0.011512 | 27.3179 | 723.4695 |
Defect and static | 0.011551 | 22.3873 | 725.747 | |
Defect and load | 0.000927 | 13.6154 | 59.7865 |
Fig. 11 shows a change in the characteristic curve values due to the impedance increase with defect and the impedance decrease with stress despite the defect presence. This behaviour is explained by means of the thermal agitation and the magnetic parameters variation, as the magnetic permeability, due to the stress. Fig. 12 shows a small impedance growth linked to the defect presence without load contrary to the situation of defect presence with load where a significant reduction can be observed.
Fig. 11Impedance diagram at the crack tip
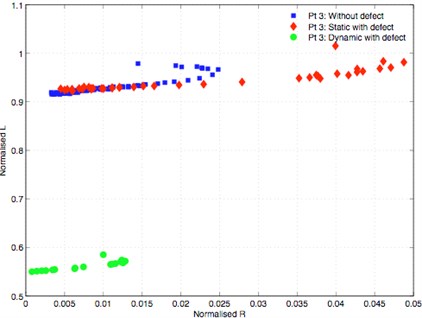
Fig. 12Impedance vs. frequency at the crack tip
4. Conclusions
This work presents experimental approaches to characterize the stress field at the singular zone of a centred crack in plate. The plate is made with aeronautical material Al 7075-T6, which is commonly used in aeronautics and aerospace. The influence of a mechanical stress on the magnetic parameters was performed by means of eddy current testing, wherein an elaborated conical probe was used. From the summary of all the results obtained, we can draw the following conclusions:
1) At the plate without load, the impedance increases with frequency.
2) Presence of defect increases the impedance due to the increase of the dissipated energy by Joule effect and the decrease of stored energy from the same frequency.
3) Unidirectional elastic load applied on the cracked plate decreases the impedance due to the thermal agitation and the change of magnetic parameters as the magnetic permeability from the same frequency.
4) Eddy current control is very sensitive to the stress and produces significant changes in parameters.
5) In practice, stress should be considered in mechanical parts inspection.
In this work, only uniaxial stress is considered. However, in practice, the stresses are often multi-axial. Therefore, in our future work, we intend to investigate a multi-axially stress case and residual stresses.
References
-
H. Tada, P. C. Paris, and G. R. Irwin, The Stress Analysis of Cracks Handbook, Third Edition. ASME Press, 2000, https://doi.org/10.1115/1.801535
-
R. Ghoni, M. Dollah, A. Sulaiman, and F. M. Ibrahim, “Defect characterization based on eddy current technique: technical review,” Advances in Mechanical Engineering, Vol. 6, p. 182496, Jan. 2014, https://doi.org/10.1155/2014/182496
-
Industrie-Techno, Calcul De Champ Électromagnétique: Exemples D’applications. Paris: Collection EDF & D, 2007.
-
X. Ma and A. J. Peyton, “Eddy current measurement of the electrical conductivity and porosity of metal foams,” IEEE Transactions on Instrumentation and Measurement, Vol. 55, No. 2, pp. 570–576, Apr. 2006, https://doi.org/10.1109/tim.2006.873549
-
I. Z. Abidin, C. Mandache, G. Y. Tian, and M. Morozov, “Pulsed eddy current testing with variable duty cycle on rivet joints,” NDT and E International, Vol. 42, No. 7, pp. 599–605, Oct. 2009, https://doi.org/10.1016/j.ndteint.2009.04.001
-
S. Hosseini and A. A. Lakis, “Application of time-frequency analysis for automatic hidden corrosion detection in a multilayer aluminum structure using pulsed eddy current,” NDT and E International, Vol. 47, pp. 70–79, Apr. 2012, https://doi.org/10.1016/j.ndteint.2011.12.001
-
M. Zergoug, S. Lebaili, H. Boudjellal, and A. Benchaala, “Relation between mechanical microhardness and impedance variations in eddy current testing,” NDT and E International, Vol. 37, No. 1, pp. 65–72, Jan. 2004, https://doi.org/10.1016/j.ndteint.2003.09.002
-
Y. He et al., “Pulsed eddy current technique for defect detection in aircraft riveted structures,” NDT and E International, Vol. 43, No. 2, pp. 176–181, Mar. 2010, https://doi.org/10.1016/j.ndteint.2009.10.010
-
P.-Y. Joubert, E. Vourc’H., and V. Thomas, “Experimental validation of an eddy current probe dedicated to the multi-frequency imaging of bore holes,” Sensors and Actuators A: Physical, Vol. 185, pp. 132–138, Oct. 2012, https://doi.org/10.1016/j.sna.2012.07.009
-
D. J. Sadler and C. H. Ahn, “On-chip eddy current sensor for proximity sensing and crack detection,” Sensors and Actuators A: Physical, Vol. 91, No. 3, pp. 340–345, Jul. 2001, https://doi.org/10.1016/s0924-4247(01)00605-7
-
Y. Li, G. Y. Tian, and S. Ward, “Numerical simulations on electromagnetic NDT at high speed,” Insight – Non-Destructive Testing and Condition Monitoring, Vol. 48, No. 2, pp. 103–108, Feb. 2006, https://doi.org/10.1784/insi.2006.48.2.103
-
V. K. Babbar, P. R. Underhill, C. Stott, and T. W. Krause, “Finite element modeling of second layer crack detection in aircraft bolt holes with ferrous fasteners present,” NDT and E International, Vol. 65, pp. 64–71, Jul. 2014, https://doi.org/10.1016/j.ndteint.2014.03.005
-
H. G. Ramos, T. Rocha, J. Král, D. Pasadas, and A. L. Ribeiro, “An SVM approach with electromagnetic methods to assess metal plate thickness,” Measurement, Vol. 54, pp. 201–206, Aug. 2014, https://doi.org/10.1016/j.measurement.2014.01.035
-
X. Chen and Y. Lei, “Excitation current waveform for eddy current testing on the thickness of ferromagnetic plates,” NDT and E International, Vol. 66, pp. 28–33, Sep. 2014, https://doi.org/10.1016/j.ndteint.2014.04.006
-
A. Dahia, E. Berthelot, Y. L. Bihan And, and L. Daniel, “A model-based method for the characterisation of stress in magnetic materials using eddy current non-destructive evaluation,” Journal of Physics D: Applied Physics, Vol. 48, No. 19, p. 195002, Mar. 2015, https://doi.org/10.1088/0022-3727/48/19/195002
-
B. A. Abu-Nabah, F. Yu, W. T. Hassan, M. P. Blodgett, and P. B. Nagy, “Eddy current residual stress profiling in surface-treated engine alloys,” Nondestructive Testing and Evaluation, Vol. 24, No. 1-2, pp. 209–232, Mar. 2009, https://doi.org/10.1080/10589750802245280
-
N. Saba, M. Jawaid, and M. T. H. Sultan, “An overview of mechanical and physical testing of composite materials,” Mechanical and Physical Testing of Biocomposites, Fibre-Reinforced Composites and Hybrid Composites, pp. 1–12, 2019, https://doi.org/10.1016/b978-0-08-102292-4.00001-1
-
P. J. Shull, Non-Destructive Evaluation Theory, Techniques and Applications. New York, 2002.
Cited by
About this article

I would sincerely thank Dr. T. Benkherouf, Dr. O. Mimouni and Pr. A. Allali for constructive comments, inducement and advice which led to serious improvement of the article.
