Abstract
In order to study the influence of defect geometric parameters (width, thickness) on the electromagnetic characteristics of the space around the defect in the process of eddy current testing of metal spheres, based on the principle of eddy current testing, a metal sphere detection model with different defect parameters was established by COMSOL software for simulation. The distribution of the magnetic field around the defect under different parameters is analyzed with the help of the butterfly diagram composed of the radial magnetic induction intensity and the axial magnetic induction intensity. The results show that: When the width of the corrosion defect is different, the butterfly diagram will change differently. When the width is small, the butterfly diagram basically does not change. When the width reaches a certain value, the butterfly diagram begins to change significantly. The intersection of the graph and the initial butterfly graph is defined as the influence node, and the width of the defect can be quantitatively analyzed according to the sequence of the influence nodes. The influence of the thickness of the corrosion defect on the magnetic field on the surface of the sphere is different under different defect widths. The larger the thickness of the corrosion defect, the greater the influence on the magnetic field near the center of the defect, and the deeper the depression of the butterfly diagram.
Highlights
- Focus on the magnetic field to analyze the influence of different widths and depths of defects.
- The distribution of the magnetic field around the defect under different parameters is analyzed with the help of the butterfly diagram composed of the radial magnetic induction intensity and the axial magnetic induction intensity.
- Qualitative and quantitative analysis of the electromagnetic properties of metal spheres with variable parameters.
1. Introduction
Mechanical equipment such as reciprocating compressor systems often carry various loads in engineering applications, and have been working in many harsh environments, such as high pressure, high temperature and humidity. After a certain period of work, the equipment may appear corrosion and crack defects, resulting in the decline of its mechanical properties and even failure. Non-destructive testing technology is very important to ensure the quality of mechanical equipment products [1-3]. At present, eddy current testing, ultrasonic testing, penetrant testing, magnetic particle testing and radiographic testing are commonly used nondestructive testing methods in engineering. Among them, eddy current testing is one of the most widely used non-destructive testing techniques, because it has many advantages, such as simple operation, non-contact, fast testing speed, no couplant, low requirements on testing surface and no radiation hazard to human body, etc. It plays an important role in the detection and evaluation of the quality and structural integrity of metal materials, parts and equipment [4-6].
Eddy current testing technology is a non-destructive testing method based on the principle of electromagnetic induction. It detects the measured object through the coupling of magnetic field energy between the probe and the test piece, especially the integrity of the test piece [7]. Guo Xiaopeng et al. used finite element simulation software to simulate and analyze the change law of the magnetic field with different defects and different scanning directions. The results show that with the increase of the defect span, the peak-to-peak distance of the signal also increases, and the change is basically the same as the length of the defect. Consistent [8]. However, traditional eddy current testing has gradually exposed some problems due to the continuous improvement of testing quality requirements and the continuous progress of modern testing technology. For example, the development trend of non-destructive testing technology is gradually changing from non-destructive testing to non-destructive evaluation. It is impossible to adapt to the presence or absence of the defect [9]; it is impossible to accurately locate the defect; it is easy to miss the inspection, and it is impossible to discriminate the smaller defects. It can be seen that it is very important to study and analyze the spatial electromagnetic field distribution around the tiny defect to determine whether the geometric parameters of the defect have a quantitative relationship with the surrounding spatial magnetic field. For this reason, this paper selects metal spheres widely used in daily production and life as the research object. Metal spheres are mainly steel balls. Because steel balls and their products are widely used in many equipment such as reciprocating compressor systems, the defects of steel balls It is extremely important to identify and quantitatively evaluate the equipment. Timely detection of defects can screen out substandard products and ensure the safe operation of equipment in service. In this paper, a defect detection model with different geometric parameters is constructed by the COMSOL finite element simulation software, and the relationship between the defect and the magnetic field is analyzed by observing the horizontal and vertical magnetic induction intensity of the space magnetic field around the defect.
2. Eddy current testing theory
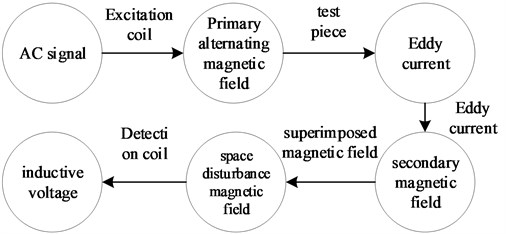
An important application of the eddy current effect is the eddy current effect. According to the principle of electromagnetic induction, when a probe coil is connected to alternating current, when it is close to or placed on the test piece, the test piece will have an electromagnetic induction effect with the primary alternating magnetic field generated by the probe coil, and the current will flow in the test piece. Induced, this current is called eddy current. According to Lenz’s law, there will be a secondary magnetic field generated by the eddy current of the test piece, and this magnetic field will generate electromagnetic induction with the probe coil, further inducing a voltage on the coil. The vector sum of the original excitation voltage and the eddy current induced voltage is the total voltage in the coil. When a defect occurs in the test piece or its shape, size, electrical conductivity, magnetic permeability, and others change, the distribution and intensity of the eddy current will be affected, and this change will lead to the change of the coil induced voltage. Therefore, whether there is a defect in the conductor test piece can be judged by detecting the change of the probe coil voltage. The principle is shown in Fig. 1.
Fig. 1Eddy current testing schematic
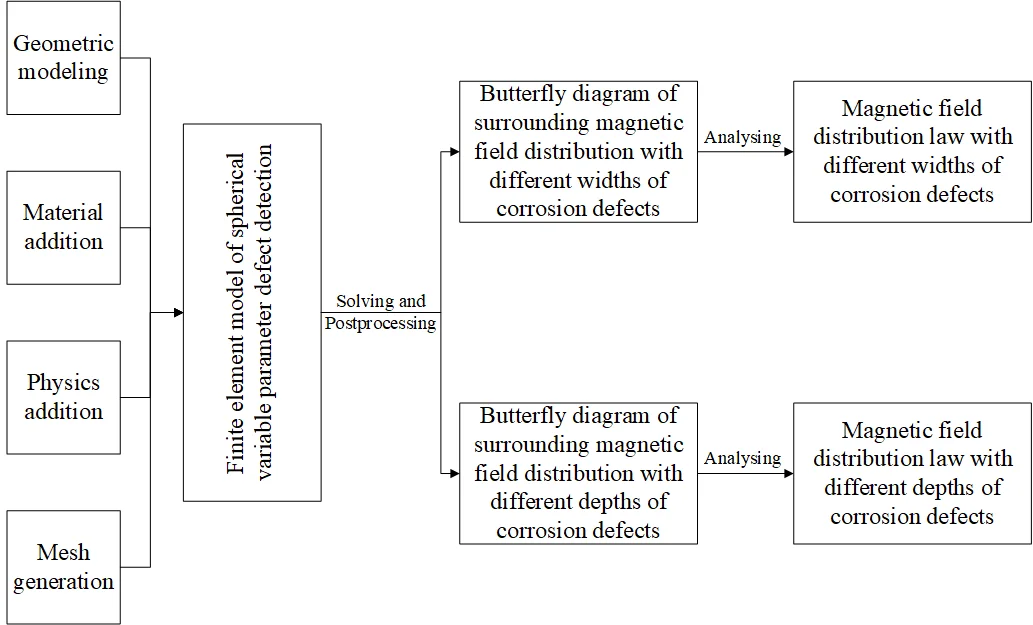
3. Eddy current testing variable parameter defect detection finite element model
3.1. Geometric modeling
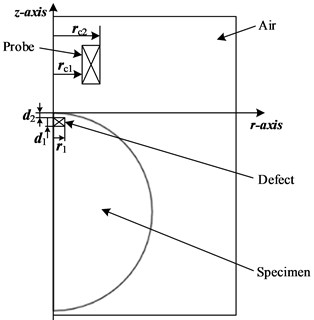
Conductors and other lossy materials that generate large, induced currents in time-varying magnetic fields can be modeled with the AC/DC Module in COMSOL. According to the symmetry characteristics of the metal sphere, an equivalent model of the variable-parameter defect detection system as shown in Fig. 2 is established.
Fig. 2Equivalent model of variable parameter defect detection system
3.2. Material selection
The air field material is selected as air, the coil material is selected as copper, and the material to be tested is selected as stainless steel. The relative permeability , electrical conductivity and relative permittivity of the selected materials are shown in Table 1.
Table 1Basic size and style requirements
Material | / (S·m-1) | ||
Air | 1 | 0 | 1 |
Copper | 1 | 5.998×10⁷ | 1 |
Stainless steel | 100 | 1.137×10⁶ | 1 |
3.3. Addition of physics
The physics in the model is chosen to be the magnetic field in the COMSOL Low Frequency Electromagnetic Fields Module. In order to apply the current and determine the number of turns in the coil, select the Set “Uniform Multi-Turn Coil physics” in Magnetic Fields. The number of coil turns is set to 1000 turns, the excitation current signal is selected as 0.05 A.
3.4. Mesh generation
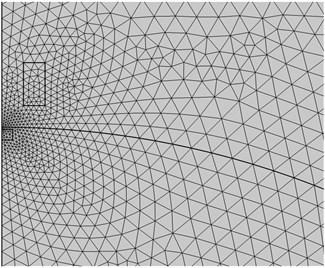
Under the premise of ensuring the solution accuracy, free triangular meshes are used for the probe coil and air domain, and the mesh element size is set to be extremely fine. The meshing diagram of the model is shown in Fig. 3.
3.5. Solving and postprocessing of finite element model
Enter the excitation frequency, set the solution to the model, add a parametric sweep to the study, and solve by setting different values for the geometric parameters of the defect, the magnetic field distribution of the induced magnetic field can be obtained, and then the relationship between the geometric parameters of the defect (width, thickness) and the magnetic field can be analyzed, then we can obtain the electromagnetic properties around the defect.
Fig. 3Meshing diagram of the model
4. Simulation results and analysis
4.1. Magnetic field distribution law with different widths of corrosion defects
Without changing the thickness of the corrosion hole 0.5 mm and the hidden depth 0.1 mm, the influence of the surface magnetic field is only studied by changing the corrosion hole width . The corrosion hole width parameters are set as 0.01 mm, 0.25 mm, 0.5 mm, 1 mm, 1.5 mm and 2 mm.
Fig. 4Variation curve of butterfly diagram with corroded hole width r1
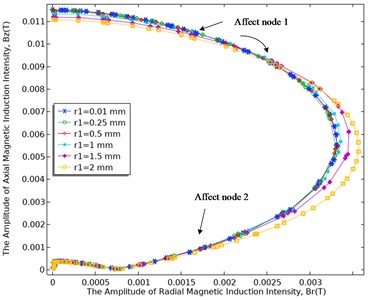
The distribution law of the magnetic field with different widths of the corrosion hole is shown in Fig. 4, where the and axes represent the radial and axial magnetic induction intensity respectively. Since the curve of this kind of graph is more like the wings of a butterfly, it is called a butterfly graph [10]. The influence of the corrosion hole defect on the spatial magnetic field response can be analyzed by the butterfly diagram. When takes different values, the shape of the butterfly diagram will change differently. The specific change law is analyzed as follows:
(1) When 0.01 mm, 0.25 mm and 0.5 mm, the butterfly diagram is almost the same, and the shape of a segment of the curve at the starting position is basically horizontal. It can be speculated that when the width of the corrosion hole is 0.5 mm = 1/2, it has little effect on the magnetic field on the surface of the sphere.
(2) When 1 mm, the butterfly diagram begins to show obvious changes, but it can be found that the surface magnetic field changes mainly occur near the corrosion holes.
(3) When 1.5 mm and 2 mm, the butterfly diagram begins to show very obvious changes. It is speculated that when 1.5 mm = 1/2(), the corrosion hole width is located below the excitation coil. At the center position, the butterfly graph starts to be affected very clearly, and as the width increases, the influence spreads gradually.
4.2. Magnetic field distribution law with different thickness of corrosion defect
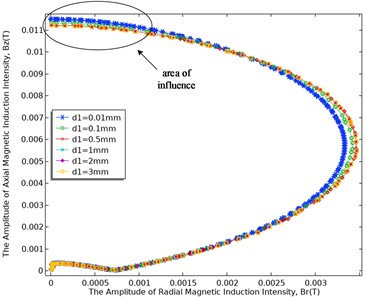
Without changing the hidden depth of the corrosion hole 0.1 mm and other parameters, Fig. 5 and Fig. 6 show the relationship between the butterfly diagram and the thickness of the corrosion hole in the two cases of 0.5 mm and 1.5 mm, respectively.
As shown in Fig. 5 and Fig. 6, the thickness of the corrosion hole does not change the basic shape of the butterfly diagram, but the following rules exist between the thickness of the corrosion hole and the change of the butterfly diagram:
(1) When the width of the corrosion hole is different, the influence of the thickness of the corrosion hole on the butterfly diagram curve is different: when the width of the corrosion hole is 0.5 mm, the surface magnetic field is hardly affected by the thickness of the corrosion hole; when the width of the corrosion hole is 1.5 mm, it can be observed from the butterfly diagram that the thickness of the corrosion hole has a certain influence on the magnetic field on the surface of the sphere. With the increase of the thickness of the corrosion hole, its influence is getting bigger and bigger, the depression at the initial position of the butterfly diagram is getting deeper and deeper, and when the corrosion thickness reaches a certain value, such as 0.5 mm, the degree of influence is not so obvious and constant.
(2) Under the condition that the width of the corrosion hole remains unchanged, the thickness of the corrosion hole will affect the initial position near the center of the corrosion hole. The deeper the corrosion hole, the greater the concave degree of the curve. Therefore, the thickness of the corrosion holes can be quantitatively analyzed according to the size of the affected area, although they have only a nonlinear relationship.
Fig. 5The change curve of butterfly diagram with different corrosion hole thickness d1 (r1= 0.5 mm)
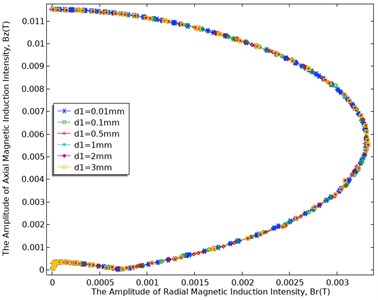
Fig. 6The change curve of butterfly diagram with different corrosion hole thickness d1 (r1= 1.5 mm)
5. Conclusions
In this paper, the influence of the width and thickness of the corrosion hole defect on the magnetic field on the surface of the sphere is analyzed by simulation and the butterfly diagram, and the following conclusions are obtained:
1) The lateral influence range of the magnetic field on the surface of the sphere has a certain relationship with the width of the corrosion hole. The corrosion width can be quantitatively analyzed through the characteristic quantity of the node, which is laterally influenced by the surface magnetic field.
2) When the width of the corrosion defect is different, the influence of the corrosion thickness on the surface magnetic field is not the same. At the same time, the corrosion thickness will affect the longitudinal distribution of the surface magnetic field. According to the size of the affected area, the quantitative analysis of the thickness can be realized.
References
-
Gongtian Shen, “Progress of nondestructive testing and evaluation in China,” in 17th World Conference on Nondestructive Testing, 2008.
-
J. Li and J. Chen, “NDT brochure,” 2002.
-
S. Ding and F. Liu, “New technology and application of nondestructive testing,” 2012.
-
Z. Yu, Y. Fu, L. Jiang, and F. Yang, “Detection of circumferential cracks in heat exchanger tubes using pulsed eddy current testing,” NDT and E International, Vol. 121, p. 102444, Jul. 2021, https://doi.org/10.1016/j.ndteint.2021.102444
-
L. Xie, B. Gao, G. Y. Tian, J. Tan, B. Feng, and Y. Yin, “Coupling pulse eddy current sensor for deeper defects NDT,” Sensors and Actuators A: Physical, Vol. 293, pp. 189–199, Jul. 2019, https://doi.org/10.1016/j.sna.2019.03.029
-
S. She, Y. Chen, Y. He, Z. Zhou, and X. Zou, “Optimal design of remote field Eddy current testing probe for ferromagnetic pipeline inspection,” Measurement, Vol. 168, p. 108306, Jan. 2021, https://doi.org/10.1016/j.measurement.2020.108306
-
H. Yin, X. Wen, S. Yang, Y. Wang, C. Li, and Y. Liang, “Research on Eddy current imaging detection technology of conductive material defects,” Instrumentation Technology and Sensors, Vol. 2, pp. 83–88, 2021.
-
X. Guo, “Simulation analysis of Eddy current testing based on GMR,” Master Thesis, Tianjin University, 2013.
-
G. Rubinacci, A. Tamburrino, and S. Ventre, “Fast numerical techniques for electromagnetic nondestructive evaluation,” Nondestructive Testing and Evaluation, Vol. 24, No. 1-2, pp. 165–194, Mar. 2009, https://doi.org/10.1080/10589750802195568
-
F. Jiang, “Analytical model of Eddy current magnetic field and study on electromagnetic properties of defects,” Ph.D. Thesis, Shanghai University, 2019.
About this article

This paper was supported by the following research projects: the Natural Science Foundation of Fujian Province (Grant No. 2022J011223), the Key Technology Innovation Project of Fujian Province (Grant No. 2022G02030), the Major training project of Ningde Normal University (Grant No. 2020ZDK01), the Innovation Team of Ningde Normal University (Grant No. 2020T02), and Engineering Research Center of Mindong Aquatic Product Deep-Processing, Fujian Province University. These supports are gratefully acknowledged.
