Abstract
The gas collecting line of a gas collecting station failed and had obvious corrosion pits. The failure reasons of the pipeline in this section are studied by means of macroscopic morphology analysis, mechanical property analysis, hardness analysis and microstructure analysis. The results show that the main reason is the mechanical damage caused in the construction process for the damage of the anticorrosive coating on the outer surface of the pipe section. The main reason for the failure of “corrosion pit” inside the pipe section is that the wet gas transported contains CO2, which dissolves in water to generate H2CO3, and the pipe section is corroded in H2CO3 solution by electrochemical corrosion, which gradually develops into a more serious corrosion pit. In order to prevent the occurrence of such failure, 13Cr (martensite) material can be used to meet the corrosion resistance requirements, but also can appropriately increase the gas temperature in the tube to reduce the solubility of CO2 in water to prevent corrosion.
1. Introduction
Pipeline is the most economical and safe way to transport oil and gas resources, but it is also extremely vulnerable to the influence of external pressure, corrosion, third-party damage and natural disasters [1-3]. In oil and gas storage and transportation engineering, the chemical properties and metallographic structure of the gas collecting pipeline itself determine that this iron-based alloy is a kind of corrosion-prone alloy [4-5]. According to a large number of data analysis at home and abroad and field investigation and analysis of oil and gas fields, the main failure of gas gathering pipeline is corrosion failure [6-8]. Generally speaking, the failure of the gas gathering pipeline is mainly due to three reasons: 1. The natural gas contains CO2, which reduces the pH value of the water, which is weakly acidic and forms the corrosion product FeCO3 [9]. 2. Natural gas contains H2S and CO2, which form an electrochemical reaction similar to a galvanic cell and chemical reaction that destroys the metal lattice, and corrodes the gas gathering pipeline [10]. 3. The natural gas contains CO2 and CL, forming a “sweet gas” environment and corroding the gas gathering pipeline [11].
The external shale gas transmission pipeline in A area is the first shale gas transmission pipeline in China [12], one of the gas collection station gas collection pipeline failure. According to the
information provided, the pipeline is put into operation in May 2019, and the design specification of the pipeline is Φ323.9×8 mm seamless steel pipe, and the steel grade is L360N. The design pressure of the gas gathering pipeline is 8.5 MPa, the design gathering and transportation capacity is 260×104 m3/d, and the length is 6.65 km. The transmission medium is raw material gas (moisture), uncontained sulfur, and the anti-corrosion material is 3PE. There are nine obvious corrosion pits on the inner wall of the failed pipe sample, and the outer surface anticorrosion layer is partially damaged.
In order to clarify the reasons of the failure of the gas gathering pipeline, this paper analyzes the composition and mechanical properties of the failed pipeline samples, determines the composition and distribution of the corrosion products, and combines the failure theory to analyze the failure reasons of the pipeline.
2. Physical and chemical testing and analysis
2.1. Macroscopic morphology analysis
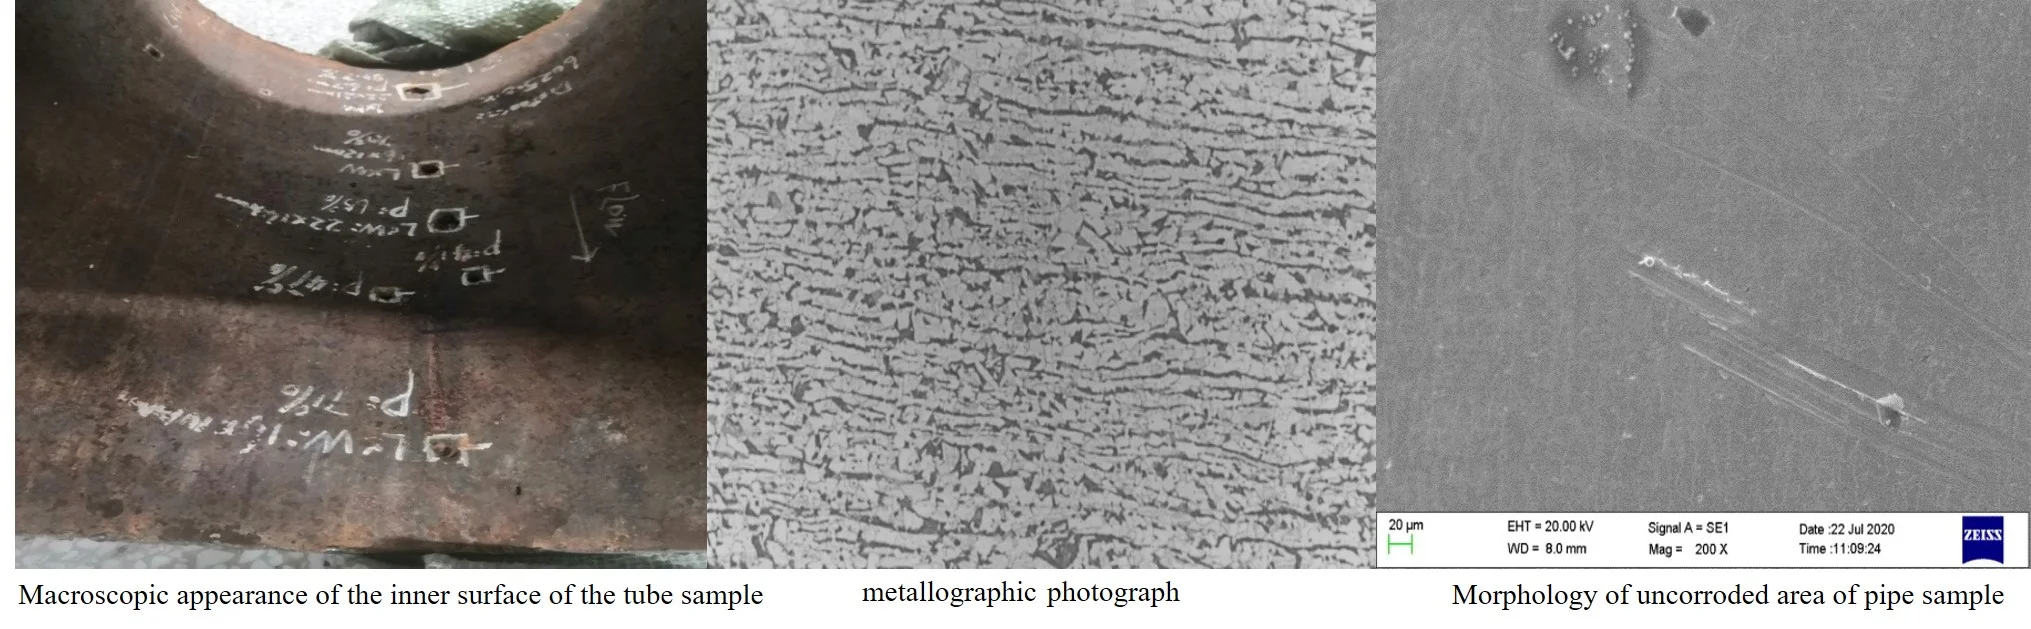
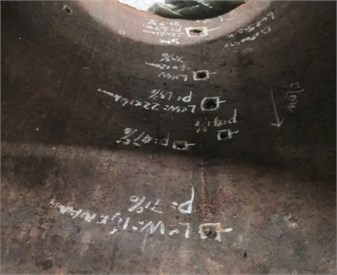
The macro morphology of the failed pipeline is shown in Fig. 1 and Fig. 2. It can be seen from Fig. 2 that there are 9 obvious corrosion pits on the inner wall of the tube sample. After cutting the relatively serious corrosion pits, the minimum remaining wall thickness of all the corrosion pits are measured to be 2.72 mm, 2.66 mm, and 2.36 mm, respectively.
Fig. 1Macroscopic appearance of sampling tube
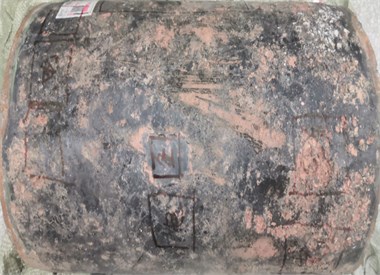
Fig. 2Macroscopic appearance of the inner surface of the tube sample
The anti-corrosion layer on the outer surface of the pipe sample is partially damaged, and part of the surface is stuck with a “soil layer with small gravel”. “Soil layer with small gravel” is stuck on the surface, as shown in Fig. 3. After clearing the “soil layer with small gravel”, it was found that the anti-corrosion layer on the outer surface of the pipe sample was not completely damaged. After the anti-corrosion layer was wore away, the metal outer surface of the pipe sample did not appear damaged or corroded (The surface rust appears after the anti-corrosion layer is worn away), as shown in Fig. 4. The anti-corrosion layer on the outer surface of the pipe section is damaged, and the local damage is serious and there is a “soil layer with small gravel”, but not completely penetrated the anti-corrosion layer, and there is no corrosion or rust on the outer surface of the pipe section. It is inferred that the main reason for the damage of the anti-corrosion layer on the outer surface of the pipe section may be the mechanical damage during the construction process.
Fig. 3The serious pipe section with “soil layer with small stone slag” is adhered to the surface
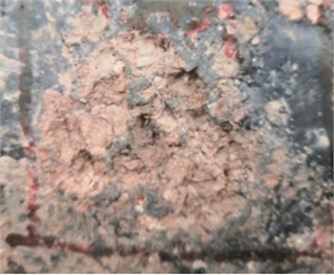
Fig. 4The outer surface of the tube sample after the anticorrosion coating is worn off

2.2. Test analysis of mechanical properties
Take four tensile test specimens from the tube body, the total length of the processed sample is 70 mm, the width of the parallel length of the specimen 15, and the transition arc radius 6 mm, according to GB/228.1-2010 “Metal Material Stretching Test Part 1: Room temperature test method” to carry out the test. The test results are shown in Table 1; the hardness test specimens are taken from the pipe body, the sampling direction is a transverse circular ring, and the test is carried out in accordance with the requirements of the GB/T230.1-2004 Rockwell hardness test standard for metal materials. The test results are shown in Table 2; Take the impact performance test sample from the sample, the sampling direction is transverse (circumferential), and the size of the test piece is 5×10×55 mm. The test was carried out according to GB/T229-2007 “Charpy Pendulum Impact Test Method for Metallic Materials”, and the test results are shown in Table 3.
It can be seen from Table 1 that the tensile strength, flexural strength ratio and elongation of the four tensile samples all meet the requirements, but the yield strength of sample 1 and sample 2 are all lower than the standard value, which should be determined to be caused by corrosion. As can be seen from Table 2, Rockwell hardness values of the five test points are all in line with GB/ T230.1-2004 metal materials Rockwell hardness test standard. As can be seen from Table 3, the impact energy of the five samples conforms to GB/T229-2007 “Charpy Pillar Impact Test Method for Metal Materials” standard.
Table 1Tensile property test results
Item | The sample size (Width × Marking Distance) | Tensile strength (MPa) | The yield strength (MPa) | Showed | Elongation (%) | The fracture location |
Sample 1 | 15×70 mm | 513 | 341 | 0.66 | 18.11 | / |
Sample 2 | 15×70 mm | 520 | 345 | 0.66 | 18.11 | / |
Sample 3 | 15×70 mm | 533 | 361 | 0.68 | 18.11 | / |
Average | 522 | 349 | 0.67 | 18.11 | / | |
GB/T 9711-2017 | ≥ 460 | 360-530 | ≤ 0.93 | ≥ 14.18 | / |
Table 2Rockwell hardness test results
Test point hardness value | |||||
(See Fig. 9) | 50.1 | 47.1 | 48.2 | 45.07 | 46.8 |
GB/T 9711-2017 | ≤ 61.5HRA | ||||
Table 3Impact performance test results
Sample number | 1 | 2 | 3 | 4 | 5 |
Impact energy | 15 | 17 | 15 | 15 | 15 |
GB/T 9711-2017 | ≥ 13.5J | ||||
2.3. Chemical composition analysis
A sample was taken from the failed pipe sample, and the chemical composition of the sample was analyzed by a direct-reading spectrometer. The analysis result showed that the chemical composition of the failed pipe sample complied with the relevant regulations of GB/T 9711-2017 for steel pipes for pipeline transportation systems in the petroleum and natural gas industry. See the results Table 4.
Table 4Chemical composition of tube matrix material (Wt%)
Element | C | Si | Mn | P | S | Cr | Mo | Ni |
Detection value | 0.1 | 0.31 | 1.13 | 0.008 | 0.001 | 0.049 | 0.017 | 0.029 |
GB/T 9711-2017 | ≤ 0.24 | ≤ 0.45 | ≤ 1.4 | ≤ 0.025 | ≤ 0.015 | ≤ 0.3 | ≤ 0.15 | ≤ 0.3 |
2.4. Metallographic analysis
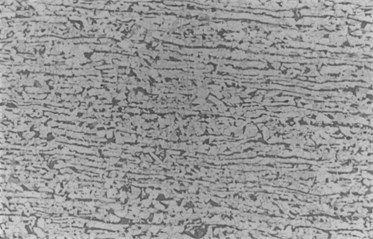
In order to improve the judgment of the microstructure condition, sample 1 and sample 2 are taken from the corrosion pits of the pipe section samples for structural analysis, as shown in Fig. 5. According to GB/T13298-1991 “Metal Microstructure Inspection Method”, the microstructures of the two samples are evaluated as ferrite plus pearlite, as shown in Fig. 6 and Fig. 7. According to GB/T 10561-2005 “Determination method of non-metallic inclusions in steel”, the non-metallic inclusions in the two samples are evaluated as D-type inclusions (spherical oxides), and the grade is 1.5; according to GB/T 6394-2002 “Method for the determination of the content of non-metallic inclusions in steel” to evaluate the grain size of the two samples, the measured grain size is 7 grades.
Fig. 5Metallographic analysis of sample sampling location at low power
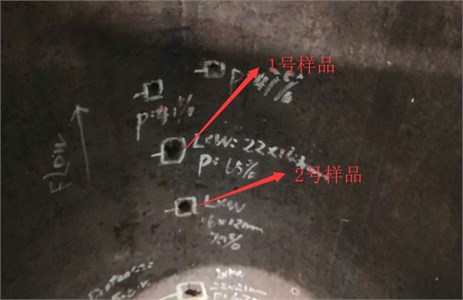
Fig. 6Sample 1 metallographic photograph
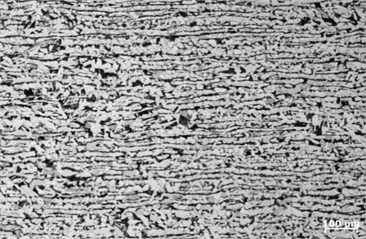
Fig. 7Sample 2 metallographic photograph
2.5. Scanning electron microscope and energy spectrum analysis
In order to understand the reason for the corrosion of the tube sample, sample 1 was intercepted in the non-corrosive area of the tube sample, and the results of scanning electron microscope and energy spectrum analysis were shown in Fig. 8 and Table 5. The results show that the surface of sample 2 is flat without any layered or massive corrosion products. Sample 1 is mainly Fe, C, O and a small amount of Si and Mn. Sample 2 was intercepted at the corrosion pit of the pipe sample, and the results of scanning electron microscopy and energy spectrum analysis were shown in Fig. 9 and Table 5. The results show that there are gray layered and massively distributed corrosion products in the pits on the inner surface of sample 1. The gray corrosion products at the bottom of the pits are mainly Fe, O, C and a small amount of Al, Si, P, S, and Mn. It shows that the corrosion type of the gas gathering pipeline is pitting corrosion. A block sample is taken from the pipe corrosion pit, and the corrosion product is analyzed for phase. The results show that the corrosion products are mainly FeCO3, Fe3O4, FeO, FeO(OH).
Fig. 8Morphology of uncorroded area of pipe sample
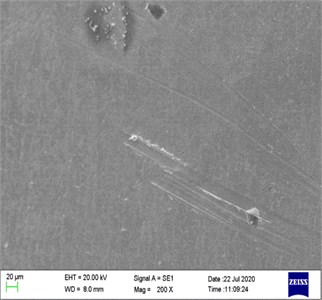
Fig. 9The high-magnification morphology of corrosion pit
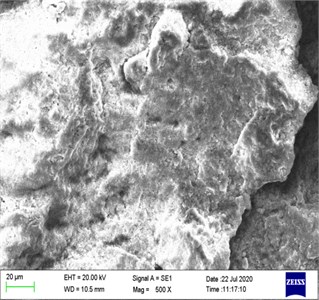
Table 5The results of elemental content energy spectrum analysis of sample 1 and sample 2
Sample | Element | ||||||||
C | O | Al | Si | P | S | Ca | Mn | Fe | |
Sample 1 | 7.38 | 23.90 | 0.32 | 0.49 | 0.82 | 0.99 | / | 1.26 | 64.84 |
Sample 2 | 4.00 | 1.49 | / | 0.32 | / | / | / | 1.57 | 92.62 |
3. Corrosion mechanism analysis
Based on the above analysis, the corrosion products of the corrosion pits in the gas collector are mainly Fe, O, and C, and also contain a small amount of Al, Si, P, S, and Mn. The corrosion products are mainly FeCO3, Fe3O4, FeO, FeO(OH). Although the corrosion products contain a small amount of S, according to the data, the natural gas in the pipeline uncontained S, which excludes the possibility of the sulfide corrosion. Excluding the possibility of sulfide corrosion, the detected S is likely to come from SO42- in the working environment, which has no direct relationship with the corrosion failure of the pipe sample. Since the natural gas composition does not contain O2, it is judged that the iron oxides in the corrosion products are produced by secondary atmospheric corrosion and surface corrosion products conversion.
Excluding the possibility of sulfide and O2 corrosion, combined with the XRD analysis results, it can be judged that the drill pipe corrosion is mainly caused by CO2 corrosion. The gas collecting pipeline of this gas collecting station conveys wet gas. The CO2 in the gas gathering pipeline is dissolved in water, which reduces the pH value of the water and becomes weakly acidic, forming the corrosion product FeCO3. CO2 itself does not It does not corrode the pipeline, but it is extremely corrosive to metal materials after being dissolved in water, and the corrosion of low-carbon alloy steel by CO2 is mainly pitting corrosion [13-15].
CO2 corrosion is also called Sweet Corrosion in the oil and gas industry [16-18]. Its essence is that CO2 dissolves in water to generate H2CO3, and metal electrochemical corrosion occurs in H2CO3 solution. Regarding the anodic reaction in the CO2 corrosion process, there is currently no consensus [19-21]. It is generally believed that in a solution containing CO2, the anode reaction is:
Total anode reaction: .
At the same time, during the CO2 corrosion process, the corrosion rate of steel is controlled by the cathodic reaction, which is as follows: .
Both H+ and H2CO3 can be reduced on the electrode. For the reduction of H+, it can be expressed as: .
The cathode process is the reduction of H2O and HCO3-, namely:
Among them, HCO3- has a great influence on the cathode reaction, and the cathode reduction reaction is controlled by the diffusion of HCO3-. At the beginning of corrosion, Fe(HCO3)2 with strong bonding force has already formed on the metal surface, and the film can change: , The formed FeCO3 film has poor bonding force with the metal matrix. Since the volume of FeCO3 is smaller than that of Fe(HCO3)2, the volume shrinks during the conversion process, forming a poorly protective FeCO3 film with micropores, which leads to the corrosion of the gas gathering pipeline [22-25].
4. Conclusions
1) The chemical composition, metallographic structure, Rockwell hardness and impact performance of the gas gathering pipeline meet the requirements of relevant standards, and the yield strength in the tensile performance is lower than GB/228.1-2010 “Metallic Material Tensile Test Part 1: Room Temperature” The standard value of the test method should be judged to be caused by CO2 corrosion.
2) The gas collecting pipeline of this gas collecting station is mainly corroded by CO2. The FeCO3 film formed by the gas gathering pipeline has a poor bonding force with the metal matrix, because the volume of FeCO3 is larger than that of Fe(HCO3)2. The volume is small, and the volume shrinks during the conversion process, forming the poorly protective FeCO3 with micropores. FeCO3 can have a “DC battery effect” with iron, leading to electrolytic corrosion.
3) Through the experimental analysis of the gas collecting pipeline of the gas collecting station, corresponding tests can be made to analyze the corrosion causes of other gas gathering pipelines.
5. Suggested improvement measures
1) In order to prevent the CO2 corrosive environment from damaging the gas gathering pipeline, corrosion-resistant alloys are used as pipeline materials. According to related literature, nickel-based alloys and 22Cr have the best corrosion resistance, but they are not economical. 13Cr (Martensite) can be used. It can fully meet its corrosion resistance requirements.
2) Corrosion inhibitors can be injected into natural gas to alleviate metal corrosion, but corrosion inhibitors are not widely used. They may be effective in one area but not in another area. It is necessary to simulate the actual situation of the oil field before use. Various corrosion inhibitors are evaluated and screened under working conditions.
References
-
Wang Xiang and Zhao Dongfeng, “Comparative study on residual strength assessment methods of different grades of corroded pipelines,” Corrosion Science and Protection Technology, Vol. 25, No. 1, pp. 85–88, 2013.
-
S. Nešić, “Effects of multiphase flow on internal CO2 corrosion of mild steel pipelines,” Energy and Fuels, Vol. 26, No. 4, pp. 4098–4111, 2012.
-
Hao Hai and Hu Tao, “Discussion on the removal of surface gas gathering pipeline,” Petrochemical Technology, Vol. 24, No. 6, 2017.
-
Pu Wenlian, “Comparative study on evaluation methods of remaining strength of corroded pipelines,” China Chemical Industry Trade, Vol. 11, No. 25, pp. 250–251, 2019.
-
Zhu Lijuan et al., “Causes of corrosion failure of G105 steel drill pipe,” Corrosion and Protection, Vol. 37, No. 9, 2016.
-
Ikeda A., Veda M., and Mukai S., “CO2 corrosion behavior and mechanism of carbon steel and alloy steel,” in 38th NACE Annual Conference, Houston, Texas, March 12-16, 1983.
-
C. Chen, M. Lu, D. Sun, Z. Zhang, and W. Chang, “Effect of chromium on the pittingresistance of oil tube steel in a carbon dioxide corrosion system,” Corrosion, Vol. 61, No. 6, pp. 594–601, 2005.
-
K. Denpo and H. Ogawa, “Effects of nickel and chromium on corrosion rate of linepipe steel,” Corrosion Science, Vol. 35, No. 1-4, pp. 285–288, Jan. 1993, https://doi.org/10.1016/0010-938x(93)90159-e
-
Han Xue, “Discussion on corrosion factors of gas gathering pipeline in Daqing Shengshen 2-1 block,” China Petroleum and Chemical Standards and Quality, Vol. 33, No. 12, 2013.
-
Wang Zhenjia, Luo Changbin, Zhang Qiang, Pei Tinggang, and Sun Liming, “Corrosion detection and safety analysis of gathering pipelines: Taking Jingbian gas field in Ordos Basin as an example,” Natural Gas Industry, Vol. 2, pp. 121–127, 2013.
-
Song Yuehai and Yan Lingling, “Corrosion analysis and pipe selection of surface gas gathering pipelines in Yaha Condensate Gas Field,” Heilongjiang Science and Technology Information, Vol. 32, 2009.
-
Lan Jie, “The first shale gas pipeline in my country is put into operation,” Natural Gas and Petroleum, Vol. 3, p. 59, 2014.
-
Kou Jurong, “Research on the corrosion mechanism and corrosion rate prediction method of gathering pipelines in a gas gathering station,” Xi’an Shiyou University, 2016.
-
“Carbon dioxide corrosion and control,” Chemical Industry Press, Industrial Equipment and Information Engineering Publishing Center, 2000.
-
R. Barker, D. Burkle, T. Charpentier, H. Thompson, and A. Neville, “A review of iron carbonate (FeCO3) formation in the oil and gas industry,” Corrosion Science, Vol. 142, pp. 312–334, 2018.
-
T. Tran, B. Brown, and S. Nesic, “Corrosion of mild steel in an aqueous CO2 environment – basic electrochemical mechanisms revisited,” in Corrosion, 2015.
-
A. Kahyarian, B. Brown, and S. Nesic, “Electrochemistry of CO2 corrosion of mild steel: Effect of CO2 on iron dissolution reaction,” Corrosion Science, Vol. 129, pp. 146–151, Dec. 2017, https://doi.org/10.1016/j.corsci.2017.10.005
-
Y. Yang, “Removal Mechanisms of Protective Iron Carbonate Layer in Flowing Solutions,” Ph.D. Thesis, Ohio University, 2012.
-
Y. Hua, R. Barker, and A. Neville, “Comparison of corrosion behaviour for X-65 carbon steel in supercritical CO2-saturated water and water-saturated/unsaturated supercritical CO2,” The Journal of Supercritical Fluids, Vol. 97, pp. 224–237, 2015.
-
T. Muraki, T. Hara, and H. Asahi, “Effects of chromium content up to 5 % and dissolved oxygen on CO2 corrosion,” in Corrosion, 2002.
-
K. Nose, H. Asahi, P. I. Nice, and J. W. Martin, “Corrosion properties of 3 % Cr steels in oil and gas environments,” in Corrosion, 2001.
-
M. Ueda, H. Takabe, and P. Nice, “The Development and Implementation of a New Alloyed Steel for Oil and Gas Production Wells,” in Corrosion, 2000.
-
L. D. Paolinelli, T. Pérez, and S. N. Simison, “The effect of pre-corrosion and steel microstructure on inhibitor performance in CO2 corrosion,” Corrosion Science, Vol. 50, No. 9, pp. 2456–2464, Sep. 2008, https://doi.org/10.1016/j.corsci.2008.06.031
-
F. Pessu, R. Barker, and A. Neville, “Understanding pitting corrosion behavior of X65 carbon steel in CO2-saturated environments: the temperature effect,” Corrosion, Vol. 72, No. 1, pp. 78–94, Jan. 2016.
-
C. de Waard, U. Lotz, and D. E. Milliams, “Predictive Model for CO2 Corrosion Engineering in Wet Natural Gas Pipelines,” Corrosion, Vol. 47, No. 12, pp. 976–985, Dec. 1991, https://doi.org/10.5006/1.3585212
About this article

