Abstract
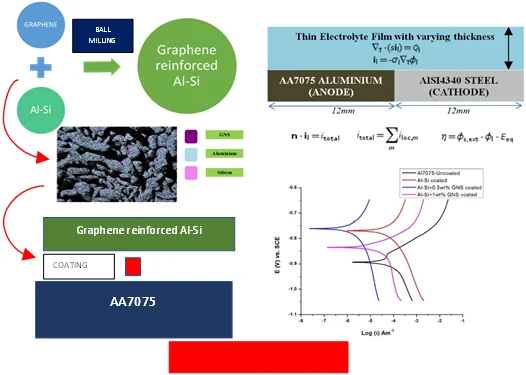
This paper aims at investigating the effect of graphene reinforced Al-Si coatings on the corrosion behavior of AA7075 aluminium alloy. Al - 12Si alloy powder reinforced with 0.5 and 1 wt.% graphene was plasma sprayed on AA7075 substrate. Potentiodynamic polarization measurements were performed using CHI660E-CH electrochemical workstation. It was observed that 0.5 wt.% graphene reinforced Al-Si coating enhanced the corrosion potential from –0.893 to –0.761 V and reduced the corrosion current density from 1.3×10⁻⁴ to 9.78×10⁻⁶ A/m2. The atmospheric galvanic corrosion was simulated using COMSOL Multiphysics finite element package. It was observed that AA7075 aluminium electrode potential with respect to AISI 4340 steel increased from –0.76 to –0.59 V. The least average current density of 0.95 A/m2 was observed at 95 % relative humidity and 0.0035 kg/m2 salt load density indicating the minimum corrosion rate for 0.5 wt.% graphene reinforced Al-Si coated AA7075 substrate. The simulation also confirmed that 0.5 wt.% graphene reinforcement in Al-Si coatings enhanced the corrosion behavior of AA7075 when compared with 1 wt.% graphene reinforcement.
Highlights
- Novel surface coating graphene reinforced Al-Si coatings on AA7075.
- 0.5wt% of graphene reinforced coating results in a substantial increase in corrosion resistance.
- Simulation studies on atmospheric galvanic corrosion of coated AA7075 specimen coupled with AISI4340 steel prove improved corrosion behavior.
1. Introduction
AA7075 is one of the most common aluminium alloys adopted for structural applications such as engine castings, shafts, military rifles, inline skating frames, glider airframes, turbine castings and bicycle components [1-4]. While in contact with copper alloys, stainless steel, nickel alloys and titanium, AA7075 aluminium suffers from severe galvanic corrosion and subsequent degradation. This can be prevented by suitably coating AA7075 surface for improving the corrosion resistance [5]. Atmospheric galvanic corrosion occurs when thin electrolyte film ranging from 1 µm to 10 mm develops on the metal surface [6-7]. The electrolyte film thickness [8] is greatly affected by the relative humidity of the environment, salt load density and roughness of the material surface. Many researchers have adopted finite element based modeling to understand the interaction between various bimetallic galvanic couples and electrolyte to predict their corrosion behavior. These galavanic couples include Iron – Zinc [9]; AA7050 Aluminium – 316 L Steel [10]; AA5083 aluminium – H116 steel [11]; AA2024 Aluminium-CFRP [12-13] and Zinc – Steel [7].
Several researchers have focused on improving the corrosion behavior of AA7075 alloy with various surface modification techniques such as plasma spray, anodizing and cladding. Dhanish et al. [2] developed corrosion resistive layer for 7075 aluminium alloy by simultaneously optimizing sealing parameters of MnVO and anodization. The MnVO sealed AA7075 exhibited lower corrosion current density of 259 nA/cm2 as against 4.5nA/cm2 obtained for unsealed AA7075. Li et al. [16] performed laser cladding of Ti/TiBCN coatings on 7075 aluminium alloy and found the improvement of corrosion potential of 7075 aluminium alloy from –1.406 V to –1.271 V. The corrosion current density was reduced by one order magnitude from 10-4 to 10-5 A/cm2. Rao et al. [17] investigated the electrochemical behaviour of alumina coated 7075 aluminium alloy surface using Plasma Electrolytic Oxidation method. Significant reduction in corrosion current density from10-4 to 10-7 A/cm2 and corrosion potential from –0.781 V to –0.699 V were observed. Al-Si alloy with near eutectic composition prove to be a promising option as coating material due to high fluidity, high corrosion and wear resistance, high strength and low thermal expansion coefficient [19]. Al-Si alloy is also used as a filler material for repairing corroded parts in structural air frames. Some of the researchers have focused on improving the corrosion resistance using Al-Si coating on aluminium and steel substrates.
Durandet et al. [14] performed cladding of Al-Si powder on Al-7075 substrate using Nd:YAG laser. Cho et al [20] reported the microstructural and mechanical characteristics of Al-10Si coated 22MnB5 press hardened steel. Couto et al. [21] evaluated the effect of hot stamping process on corrosion behaviour of 22MnB5 steel coated with Al-Si powder. Yunying [18] coated 22MnB5 steel with Al-10Si-Zn composite coating for improved corrosion resistance. Riquelme et al., [22-23] investigated the laser cladding of Al -12 Si coating on AA6082 alloy to improve its corrosion resistance. Fu et al. [24] deposited Al-Si-ND composite coating on aluminium alloy using thermal spray process. Higher corrosion potential and lower corrosion current density were mainly reported. Labban et al. [18] coated Al6028 alloy with Al-12Si reinforced with TiB2 and Al3Ti particles using gas tungsten arc welding process.
Graphene is a new promising reinforcement material adopted as a corrosion inhibitor due to its impermeability and hydrophobicity that creates a barrier against gases and liquids in a corrosive environment. However, the uniform dispersion of graphene into the Al - Si powder is highly challenging and not yet been reported so far. The powder mixing techniques such as ball milling and wet mixing can be adopted to ensure the uniform dispersion without forming agglomerates [25-35]. The effect of such graphene reinforced Al-Si coatings on AA7075 aluminium alloy also needs to be explored. Hence, this paper focuses on investigating the effect of graphene reinforced Al-Si coatings on corrosion behavior of AA7075 aluminum alloy. The graphene in the form of nano sheets (0.5 wt.% and 1 wt.%) were reinforced into the Al-Si powder using ball milling technique. Then the 70 µm thick coatings were deposited on AA7075 substrate (10 mm×25 mm) using plasma spray method. The potentiodynamic polarization study was performed at electrochemical workstation (CHI660E-CH) to measure corrosion potential and corrosion current density of coated AA7075 substrates. A numerical model was developed to simulate the atmospheric galvanic corrosion behavior of graphene reinforced Al-Si coated AA7075 using COMSOL Multiphysics 5.3 finite element analysis package. The homogeneous dispersion of graphene into Al-Si powder was confirmed using scanning electron microscope (SEM) equipped with energy dispersive spectrometer (EDAX).
2. Materials
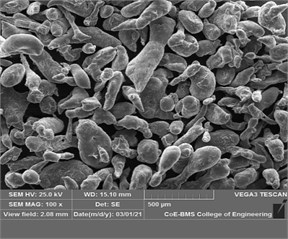
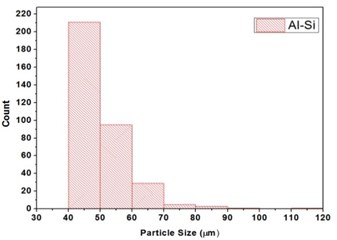
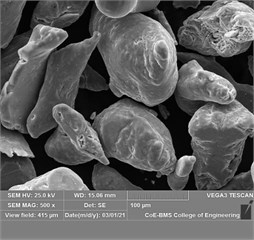
The Al-Si powder (Al ~ 85.20 %, Si ~ 11.25 %, Fe ~ 0.27 %) with 45 µm powder particle size was procured from Parshwani Metals, Mumbai. The graphene nano sheets (GNS) having 5 ~ 10 nm thickness and ~10 µm lateral size was procured from Adanano technologies, Shimoga. The morphology of Al-Si powder and particle size distribution is as shown in Fig. 1(a) and Fig. 1(b) respectively. The morphology of GNS at three different magnifications are as shown in Fig. 2(a-c). The aluminium 7075 alloy was procured from Bharath Aerospace Metals, Mumbai. The substrates were machined to a length of 25 mm and diameter 10 mm. The elemental composition of the AA7075 is as shown in Table 1.
Table 1Elemental composition of AA7075 specimen
Element | Si | Fe | Cu | Mn | Mg | Cr | Ti | Zn | Al |
Mass % | 0.32 | 0.42 | 1.36 | 0.18 | 2.25 | 0.193 | 0.12 | 5.43 | Balance |
Fig. 1a) The morphology of Al-Si powder, b) Particle Size distribution of Al-Si
a)
b)
Fig. 2a) The morpohology of GNS at a) 2000X, b) 5000X, and c) 15000X
a)
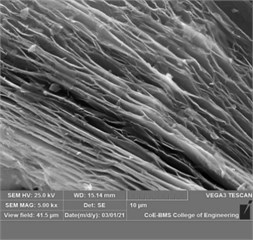
b)
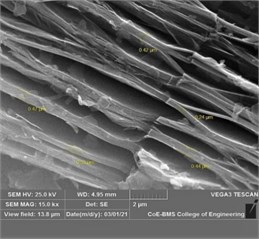
c)
3. Experimental methods
3.1. Ball milling
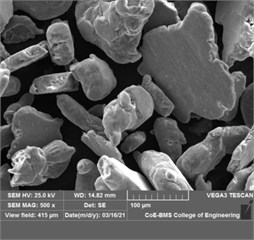
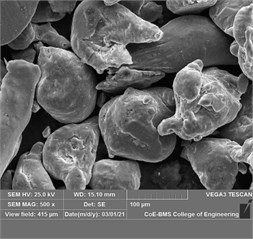
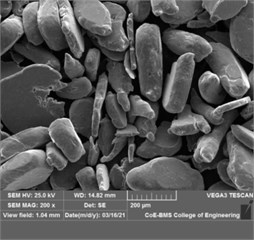
The Al-Si powder mixed with 0.5 wt.% GNS and 1 wt.% GNS separately were ball milled using Planetary Mono mill Pulverisette 6 (Classic line). The powder mixture of Al-Si powder with GNS was first poured in a steel jar of 500 ml capacity and steel balls of 5 mm diameter weighing 300 g were adopted. The Ball-to-Powder ratio (BPR) was set at 5:1 and ball milling was carried out in dry media without any process agent. To obtain the homogeneous mixture, powder was first milled at 180 rpm for 0.5 hour and then subsequently till 5 hours. In order to avoid overheating and sticking of powders to ball, every milling cycle consisted of 5 minutes of milling and 10 minutes of halt. The microstructure was obtained for the samples collected at 0.5 hour, 1 hour and 5 hours of milling for both 0.5 wt.% GNS and 1 wt.% GNS. Also, the elemental composition was mapped to visualize the Al-Si and GNS mixing.
3.2. Plasma spray coating
The Al-Si powder reinforced with 0.5 wt.% and 1wt.% GNS was deposited on AA7075 substrate. Initially, the specimens were cleaned using acetone solution to decontaminate the same. Then, the grit sand blasting was followed with air pressure of 3 -5 kg/sq.cm to deoxidize and make the surface rough for better adhesion of the coating. Argon (Flow rate- 100-150 standard cubic feet per hour (scfh); pressure-100-120 psi) and hydrogen (Flow rate- 10-13 scfh; pressure < 50 psi) were the secondary gases used for spraying. The powder was fed at a rate of 100-120 g/min and at a spray distance of 150 mm.
3.3. Potentiodynamic polarization study
The potentiodynamic polarization studies were conducted using CHI660E-CH-instrument and with thoroughly cleaned AA7075 alloy specimen. The uncoated Al 7075 (1), Al-Si coated (without reinforcement) Al 7075 (2), 0.5 wt.% GNS (3) and 1 wt.% GNS (4) reinforced Al-Si coated 7075 aluminium alloy substrates acted as the working terminal with uncovered area of 1 cm2 in natural sea water electrolyte having conductivity of 5.6 S/m (siemens per meter). The electrode set-up comprised of 7075 aluminium alloy as anode, platinum electrode as counter terminal and standard Calomel electrode as reference cathode. The polarization estimations were carried out and polarization bends were testified by changing the potential of cathode naturally with a scan rate of 0.01 V/s from –1.045 V to –0.645 V potential range. The corrosion potential, (V) against Current density, (A/m2) was plotted (Tafel-plot) using Origin Pro software. In order to obtain the corrosion potential () and current density () for each of the working terminal specimen, the anodic and cathodic branches were extrapolated in the Tafel Plots. The corrosion potential, current density and anodic-cathodic slope obtained from polarization measurements and Tafel plots were further adopted in atmospheric galvanic corrosion simulation.
3.4. Corrosion model
A one-dimensional numerical model was developed for bimetallic galvanic couple of AA7075 aluminium with AISI4340 steel with cathode to anode area ratio 1:1 using COMSOL Multiphysics 5.3 finite element package. The model geometry is as shown in Fig. 3.
Fig. 3Numerical model for Al70705-AISI4340 galvanic couple with governing equations and boundary conditions
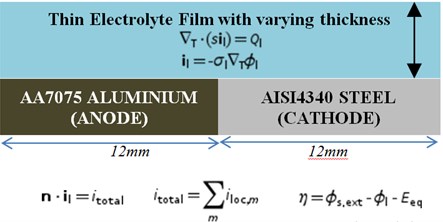
The following assumptions were made with respect to electrolyte:
1) Electrolyte film solution is in equilibrium with salt particles
2) Electrolyte film at a given load is spread uniformly over the surface
In the current model, a one-dimensional Bezier curve was adopted to make the galvanic couple of AA7075-AISI4340. The thickness of the electrolyte film changes with respect to relative humidity and salt load density. The maximum film thickness was found at 100 % relative humidity [12].
The governing Nernst-Planck equation for transport of species , is as shown in Eq. (1):
where, is the flux of species, is the diffusion coefficient, is the concentration, is the charge, is the mobility of species , is the Faraday constant, is the electric potential and is the solvent velocity. As seen in the above Eq (1), species flux is function of diffusion, migration and convection.
For specifying the current distribution in electrolyte, two boundaries (1 and 2) were selected and electrolyte thickness and conductivity were defined. Electrolyte conductivity defines the dependence of current on potential gradient. The governing equation for electrolyte as per Ohms law was given by Eq. (2) and (3):
Aluminium alloy 7075 with electrode potential of –0.893 V is found to be less noble than AISI 4340 steel with electrode potential of –0.535 V of steel and hence acts as an anode. The oxidizing cell of AA7075 follows Butler-Volmer equation as given by Eq. (4) for electrode reaction kinetics:
where, is instantaneous or local current density (A/m2), exchange current density (A/m2), is the anodic transfer coefficient, is cathodic transfer coefficient, is ideal gas constant (1.986 cal/mole K), is temperature in Kelvin, is Faraday’s constant (96,500 C/mol) and is electrode over potential in volts
In case of AISI4340 steel which acts as cathode, oxygen reduction takes place on the electrode surface. This reaction is restricted by absorption of oxygen through electrolyte film. The limiting current density, (A/m2) is a function of film thickness, diffusivity and solubility of oxygen as per Eq. (5):
The reduction cell of AISI 4340 steel follows Tafel equation. Local current density, is determined as per Eq. (6):
A normal mesh size was adopted with maximum element size of 1.61, minimum element size of 7.2 µm and curvature factor 0.3. The total number of elements was 50 with element ratio of 10. After developing the mesh, the current distribution study was simulated with different parameter levels of load density and relative density. Relative humidity was varied from 80 % to 98 % while the salt load density was varied from 0.0005 to 0.007 kg/m2. In the simulation, the maximum anode current density and average anode current density was analyzed as a function of relative humidity and salt load density.
4. Results and discussion
4.1. Characterization of ball milled Al-Si/GNS powder
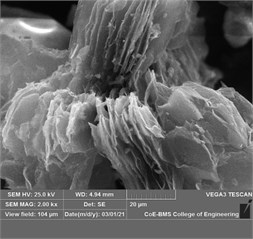
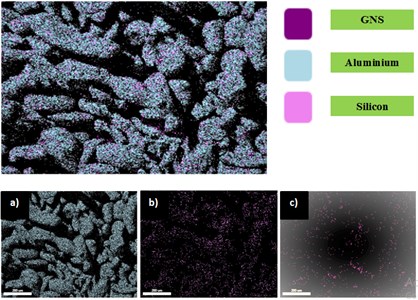
The SEM images of ball milled powders (Al-Si with 0.5 wt.% GNS reinforced; Al-Si with 1 wt.% GNS reinforced) is as shown in Fig. 4 and Fig. 5. It can be observed that Al-Si powder reinforced with grahene has undergone flattening and fracture with increase in milling time. This can be attributed to brittleness developed in silicon and graphene. Also, the shearing effect with the kinetic motion of balls and powder causes the change is shape and size of the powders. The average size of the powders was observed to be 45 µm before ball milling process and it reached to 200 µm by the end of 5 h of milling time. Fig. 6(a) shows EDAX of aluminium, silicon and GNS dispersed in Al-Si after 1 hour of milling time. It is observed that graphene is uniformly dispersed in the matrix.
Fig. 4Microstructure of Al-SI with 0.5wt.% GNS reinforced: a) Premixing for 0.5 h at 180 rpm; b) 1 h of milling; c) 5 h of milling
a)
b)
c)
Fig. 5Microstructure of Al-SI with 1wt.% GNS reinforced after a) 1 h of milling; b) 5h of milling
a)
b)
Fig. 6EDAX mapping of Al-SI with 1 wt.% GNS reinforced: a) Al dispersion; b) Si dispersion; c) GNS dispersion
4.2. Potentiodynamic polarization study
The potentiodynamic polarization study was conducted for coated and uncoated specimen in order to analyze the effect of coating on the corrosion behavior of the specimen in natural sea water medium. The Tafel plot is as shown in Fig. 7. It was observed that both cathodic and anodic branches were influenced by the GNS/Al-Si coating on AA7075 alloy. The presence of coating causes the changes in anodic dissolution of the metal and also the cathodic hydrogen reduction states of the metal. Also, the GNS/Al-Si coated specimen exhibited a significant shift towards positive state (noble state). The for uncoated specimen was obtained as –0.893 V while Al-Si with 0.5 wt.% GNS reinforced specimen exhibited –0.761 V. Also, the current density () of AA7075 uncoated specimen got reduced from 1.3×10⁻⁴ to 9.78×10⁻⁶ with the presence of GNS/Al-Si coating.
The polarization parameters obtained from Tafel curve is as shown in Table 2. It was noted that higher corrosion potential lowered the tendency of the metal corrosion. Thus, GNS reinforced coatings improved the corrosion potential of AA7075. Even though the coating with 1 wt.% GNS did not show a significant improvement, 0.5 wt.% GNS reinforced Al-Si exhibited improved corrosion resistance. Also, with the decrease in corrosion current density, the corrosion dynamicity got decreased. A minimum corrosion current density of 9.78×10⁻⁶ was shown by 0.5 wt.% GNS reinforced Al-Si coatings.
Fig. 7Tafel Plot for coated and uncoated specimens
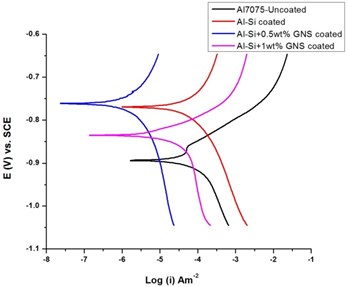
Table 2Polarization study parameters obtained from Tafel curve
Electrode coating | (V) | (A/m2) | (mAdec-1) | (mAdec-1) |
Uncoated | –0.893 | 1.3e-4 | 4.522 | 11.397 |
Al-Si | –0.769 | 2.87e-5 | 5.060 | 4.535 |
Al-Si with 0.5 wt.% GNS reinforced | –0.761 | 9.78e-6 | 4.792 | 5.386 |
Al-Si with 1 wt.% GNS reinforced | –0.834 | 4.255e-5 | 5.060 | 12.028 |
4.3. Atmospheric galvanic corrosion
4.3.1. Electrolyte potential
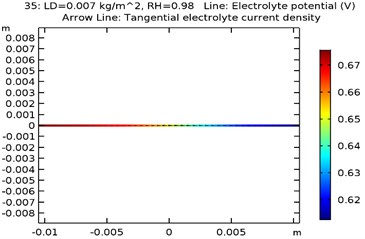
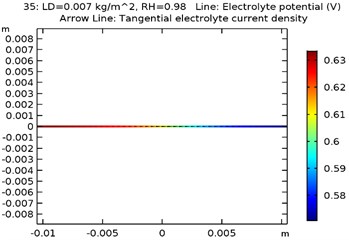
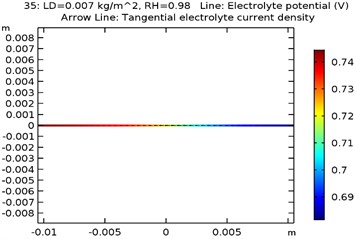
The electrolyte potential is considered as the sum of the galvanic potential variances in an electrochemical cell. The maximum electrolyte potential observed for the specimens were as received AA 7075 alloy was 0.81 V, Al-Si coated AA7075 alloy: 0.67 V, Al-Si with 0.5 wt.% GNS reinforced and coated AA7075 alloy: 0.63 V, Al-Si with 1wt.% GNS reinforced and coated AA7075 alloy: 0.74 V. It was observed that due to presence of coating the electrolyte potential of the specimen got reduced from 0.81 to 0.63 V. The contour plots representing the minimum and maximum electrolyte potential at 0.007 kg/m2 load density and 98 % relative humidity for all four specimens are as shown in Fig. 8(a-d).
4.3.2. Electrode potential vs. reference electrode
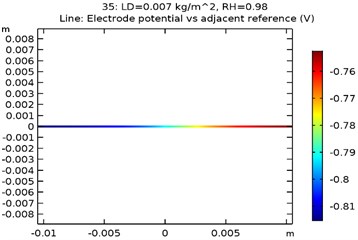
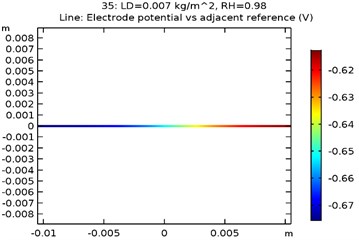
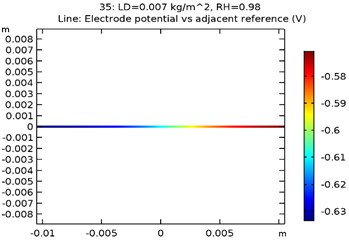
The electrode potential () for uncoated and GNS/Al-Si coated specimens at 0.007 kg/m2 load density and 98 % relative density is depicted in Fig. 9(a-d). The electrode potential obtained as a function of load density and relative humidity is as shown in Table 3. It was observed that the electrode potential increased with increase in load density and relative humidity. While, the highest electrode potential was observed for Al-Si with 0.5 wt.% GNS reinforced specimen at 0.007 kg/m2 load density and 98 % humidity, the least electrode potential was observed for uncoated specimen at 0.0005 kg/m2 load density and 80 % relative humidity.
Fig. 8Electrode potential of a) uncoated specimen, b) Al-Si coated specimen, c) Al-Si with 0.5 wt% GNS reinforced coated specimen, d) Al-Si with 1wt.% GNS reinforced coated specimen

a)
b)
c)
d)
Fig. 9Electrode potential of a) uncoated specimen, b) Al-Si coated specimen, c) Al-Si with 0.5 wt% GNS reinforced coated specimen, d) Al-Si with 1wt.% GNS reinforced coated specimen
a)
b)
c)

d)
Table 3Electrode potential (V) vs reference electrode (coated and uncoated)
Load density (kg/m2) | Relative humidity | Electrode potential vs. Reference Electrode (V) | |||||||
Uncoated | Al-Si | Al-Si with 0.5 wt.% GNS reinforced | Al-Si with 1wt.% GNS reinforced | ||||||
Anode | Cathode | Anode | Cathode | Anode | Cathode | Anode | Cathode | ||
0.0005 | 0.8 | –0.85 | –0.52 | –0.71 | –0.52 | –0.67 | –0.52 | –0.78 | –0.52 |
0.0005 | 0.9 | –0.84 | 0.53 | –0.71 | –0.53 | –0.66 | –0.53 | –0.77 | –0.53 |
0.0005 | 0.98 | –0.84 | –0.53 | –0.7 | –0.53 | –0.66 | –0.53 | –0.77 | –0.53 |
0.001 | 0.8 | –0.84 | –0.53 | –0.7 | –0.53 | –0.66 | –0.53 | –0.77 | –0.53 |
0.001 | 0.9 | –0.84 | –0.53 | –0.7 | –0.53 | –0.66 | –0.53 | –0.77 | –0.53 |
0.001 | 0.98 | –0.83 | –0.54 | –0.69 | –0.53 | –0.65 | –0.53 | –0.76 | –0.53 |
0.002 | 0.8 | –0.83 | –0.53 | –0.69 | –0.53 | –0.65 | –0.53 | –0.76 | –0.53 |
0.002 | 0.9 | –0.83 | –0.53 | –0.69 | –0.53 | –0.65 | –0.53 | –0.76 | –0.53 |
0.002 | 0.98 | –0.82 | –0.54 | –0.68 | –0.54 | –0.64 | –0.54 | –0.75 | –0.54 |
0.0035 | 0.8 | –0.82 | –0.54 | –0.69 | –0.54 | –0.65 | –0.54 | –0.76 | –0.54 |
0.0035 | 0.9 | –0.82 | –0.54 | –0.69 | –0.54 | –0.64 | –0.54 | –0.76 | –0.54 |
0.0035 | 0.98 | –0.82 | –0.61 | –0.68 | –0.55 | –0.64 | –0.54 | –0.75 | –0.56 |
0.007 | 0.8 | –0.82 | –0.63 | –0.68 | –0.55 | –0.64 | –0.54 | –0.75 | –0.56 |
0.007 | 0.9 | –0.82 | –0.6 | –0.68 | –0.55 | –0.64 | –0.54 | –0.75 | –0.55 |
0.007 | 0.98 | –0.81 | –0.75 | –0.68 | –0.61 | –0.63 | –0.57 | –0.74 | –0.68 |
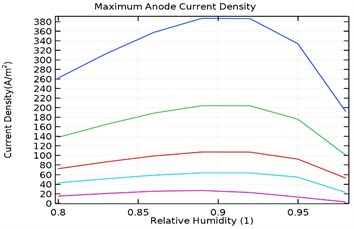
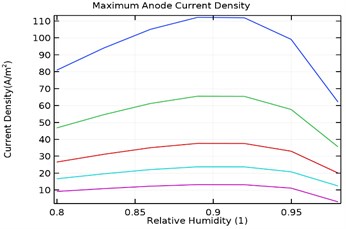
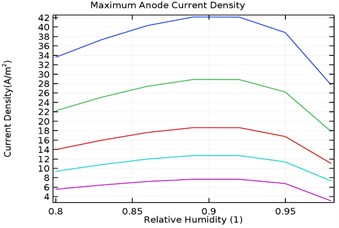
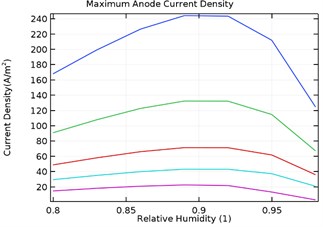
4.3.3. Maximum anode current density
Fig. 10(a-d) depicts the maximum aluminium anode current density as a function of load density and relative humidity for the galvanic couple of Aluminium alloy and AISI4340 steel. It was observed that the maximum anodic current density decreased with increase in load density and increased with increase in relative humidity from 80 % to 90 %.
Fig. 10Maximum anode current density (A/m2) for a) uncoated specimen, b) Al-Si coated specimen, c) Al-Si with 0.5 wt.% GNS reinforced coated specimen, d) Al-Si with 1 wt.% GNS reinforced coated specimen
a)
b)
c)
d)
However, increase in relative humidity beyond 90 % lowered the maximum anode current density at 0.0005 kg/m2 load density. The maximum current density for uncoated specimen was obtained to be 380 A/m2 while for Al-Si coated, Al-Si with 0.5 wt.% GNS reinforced and Al-Si with 1 wt.% GNS coated were obtained as 115, 42, 242 A/m2 respectively. It was also observed that the anode current density was least for Al-Si with 0.5 wt.% GNS. Hence the dynamic rate of corrosion rate will be least with Al-Si with 0.5 wt.% GNS reinforced coated specimen.
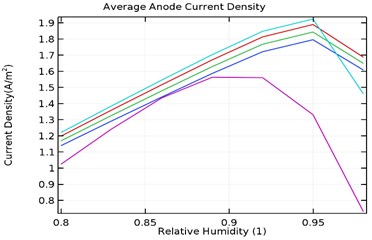
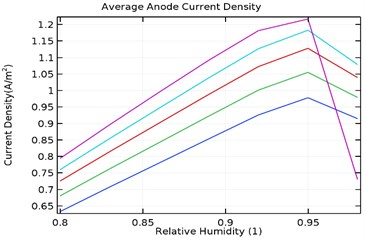
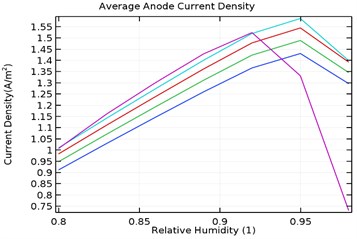
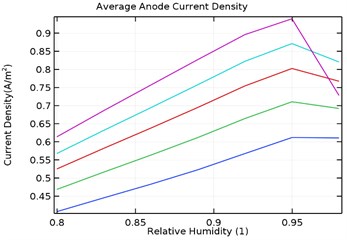
4.3.4. Average anode current density
Fig. 11(a-d) shows the average anode current density in the galvanic couple of aluminium alloy and AISI 4340 steel. The average anode current density is the current density when the anode has stabilized and provides a measure of total corrosion rate of the sample. Lower the average current density, lower is the corrosion rate of the specimen [25]. Table 3 describes the average current density obtained during the parametric study with respect to load densities and relative humidity.
Fig. 11Average anode current density (A/m2) for a) uncoated specimen, b) Al-Si coated specimen, c) Al-Si with 0.5 wt.% GNS reinforced coated specimen, d) Al-Si with 1 wt.% GNS reinforced coated specimen
a)
b)
c)
d)
It was observed that the average current density increases in load densities up to 0.0035 kg/m2 but decreases significantly later towards 0.007 kg/m2 for as received AA7075 specimen. Also, the average current density increased with increase in relative density till 95 % humidity for load density up to 0.0035 kg/m2 and decreases later for uncoated specimen. When the load density is 0.007 kg/m2, the current density increases up to 90 % humidity and then decreases significantly. For coated specimen, the average current density increases with increase in load density. Also, the current density increases with increase in relative humidity from 80 % to 95 % and decreases significantly then.
The maxiumum average current density for uncoated specimen was observed to be 1.95 A/m2 at 0.0035 kg/m2 and 95 % humidity. In comparison, for Al-Si and Al-Si with 0.5 wt.% GNS, the maximum average current density were 1.23 A/m2 and 0.95 A/m2 respectively at 95 % humidity and load density of 0.007 kg/m2. It is observed that for Al-Si with 0.5 wt.% GNS reinforced coated specimen exhibited lower current density. In case of Al-Si with 1 wt.% GNS reinforced coated specimen, the maximum average current density was 1.93 A/m2 at 0.0035 kg/m2 load density and 95 % humidity. It follows similar trend as that of uncoated specimen.
5. Conclusions
The potentiodynamic polarization study indicated that 0.5 wt.% GNS reinforced Al - Si coating the corrosion potential of AA7075 in natural sea water is increased from –0.893 to –0.761 V whereas the corrosion current density decreased from 1.3×10⁻⁴ to 9.78×10⁻⁶ A/m2. Although the Al-Si coated AA7075 showed corrosion potential of –0.769 V the corrosion current density was observed to be 2.78×10⁻⁵ A/m2. 1 wt.% GNS reinforced Al-Si coatings does show significant improvement in corrosion behavior. The simulation results indicated that the electrode potential of AA7075 under high humidity and salt load density can be enhanced with GNS reinforced Al-Si coating. The electrode potential of 0.5 wt.% GNS reinforced Al-Si coated AA7075 was increased from –0.76 to –0.59 V when coupled with AISI4340 steel. Also, for 0.5 wt.% GNS reinforced Al-Si coated AA7075 substrate, the least average current density of 0.95 A/m2 observed at 95 % relative humidity and 0.0035 kg/m2 salt load density indicated the minimum corrosion rate. Hence, it can be deduced that with 0.5 wt.% GNS reinforced Al-Si coatings the tendency to corrode and the dynamic rate of corrosion can be reduced significantly. In future, studies can be performed to analyze the effect of GNS reinforced Al-Si coatings on tribological behavior of AA7075.
References
-
S. Naghdi and V. Mišković-Stanković, “Review-a review of the corrosion behaviour of graphene coatings on metal surfaces obtained by chemical Vapour deposition,” Journal of The Electrochemical Society, Vol. 169, No. 2, p. 021505, Feb. 2022, https://doi.org/10.1149/1945-7111/ac53cb
-
W. Sun et al., “Review on the corrosion-promotion activity of graphene and its inhibition,” Journal of Materials Science and Technology, Vol. 91, pp. 278–306, Nov. 2021, https://doi.org/10.1016/j.jmst.2020.12.084
-
M. K. Srinath and M. S. Ganesha Prasad, “Corrosion analysis of TiCN coated Al-7075 alloy for marine applications: a case study,” Journal of The Institution of Engineers (India): Series C, Vol. 100, No. 2, pp. 371–377, Apr. 2019, https://doi.org/10.1007/s40032-018-0469-z
-
Y. Mei et al., “Deformation treatment and microstructure of graphene-reinforced metal matrix nanocomposites: A review of graphene post-dispersion,” International Journal of Minerals, Metallurgy and Materials, Vol. 27, No. 7, pp. 888–899, Jul. 2020, https://doi.org/10.1007/s12613-020-2048-6
-
G. Koch, J. Varney, N. Thompson, O. Moghissi, M. Gould, and J. Payer, NACE Int. 2016.
-
H. Simillion, O. Dolgikh, H. Terryn, and J. Deconinck, “Atmospheric corrosion modeling,” Corrosion Reviews, Vol. 32, No. 3-4, pp. 73–100, Oct. 2014, https://doi.org/10.1515/corrrev-2014-0023
-
N. V. den Steen, H. Simillion, D. Thierry, H. Terryn, and J. Deconinck, “Comparing modeled and experimental accelerated corrosion tests on steel,” Journal of The Electrochemical Society, Vol. 164, 2017.
-
O. Dolgikh, A. C. Bastos, A. Oliveira, C. Dan, and J. Deconinck, “Geometry influence on corrosion in dynamic thin film electrolytes,” Corrosion Science, Vol. 102, pp. 338–347, 2016.
-
F. Thébault, B. Vuillemin, R. Oltra, C. Allely, and K. Ogle, “Protective mechanisms occurring on zinc coated steel cut-edges in immersion conditions,” Electrochimica Acta, Vol. 56, No. 24, pp. 8347–8357, Oct. 2011, https://doi.org/10.1016/j.electacta.2011.07.016
-
C. Liu, J. Srinivasan, and R. G. Kelly, “Editors’ choice-electrolyte film thickness effects on the cathodic current availability in a galvanic couple,” Journal of The Electrochemical Society, Vol. 164, pp. C845–C855, 2017.
-
D. Mizuno and R. G. Kelly, “Galvanically induced interganular corrosion of AA5083 – H131 under atmospheric exposure conditions – Part II – modeling of the damage distribution,” Corrosion, Vol. 69, No. 6, pp. 580–592, 2013.
-
Z. Y. Chen, F. Cui, and R. G. Kelly, “Calculations of the cathodic current delivery capacity and stability of crevice corrosion under atmospheric environments,” Journal of the Electrochemical Society, Vol. 155, No. 7, pp. C360–368, 2008.
-
S. Palani, T. Hack, J. Deconinck, and H. Lohner, “Validation of predictive model for galvanic corrosion under thin electrolyte layers: an application to aluminium 2024-CFRP material combination,” Corrosion Science, Vol. 78, pp. 89–100, Jan. 2014, https://doi.org/10.1016/j.corsci.2013.09.003
-
Y. Durandet, M. Brandt, and Q. Liu, “Challenges of laser cladding Al 7075 alloy with Al-12Si alloy powder,” Materials Forum, Vol. 29, pp. 136–142, 2005.
-
G. V. Voort and J. Asensio-Lozano, “The Al-Si phase diagram,” Microscopy and Microanalysis, Vol. 15, No. S2, pp. 60–61, Jul. 2009, https://doi.org/10.1017/s1431927609092642
-
L. Jiang, “Galvanic corrosion of brass /steel 907A couple in artificial seawater,” International Journal of Electrochemical Science, pp. 3577–3590, May 2016, https://doi.org/10.20964/110437
-
Y. Rao, Q. Wang, D. Oka, and C. S. Ramachandran, “On the PEO treatment of cold sprayed 7075 aluminum alloy and its effects on mechanical, corrosion and dry sliding wear performances thereof,” Surface and Coatings Technology, Vol. 383, p. 125271, Feb. 2020, https://doi.org/10.1016/j.surfcoat.2019.125271
-
X. Yunying, H. Wenxin, C. Yi, W. Guangxin, and Z. Jieyu, “Effect of heat treatment process on microstructure and corrosion resistance of Al-10%Si-24%Zn coating,” Surface and Coatings Technology, Vol. 401, p. 126305, Nov. 2020, https://doi.org/10.1016/j.surfcoat.2020.126305
-
H. F. El-Labban, M. Abdelaziz, and E. R. I. Mahmoud, “Coating of 6028 aluminum alloy using aluminum piston alloy and Al-Si alloy-based nanocomposites produced by the addition of Al-Ti5-B1 to the matrix melt,” Metallurgical and Materials Transactions B, Vol. 45, No. 5, pp. 1608–1614, Oct. 2014, https://doi.org/10.1007/s11663-014-0081-4
-
L. Cho, L. Golem, E. J. Seo, D. Bhattacharya, J. G. Speer, and K. O. Findley, “Microstructural characteristics and mechanical properties of the Al-Si coating on press hardened 22MnB5 steel,” Journal of Alloys and Compounds, Vol. 846, p. 156349, Dec. 2020, https://doi.org/10.1016/j.jallcom.2020.156349
-
C. P. Couto et al., “Depth profiling approach to evaluate the influence of hot stamping on the local electrochemical behaviour and galvanic series of hot-dip Al-Si coating on 22MnB5 steel,” Corrosion Science, Vol. 185, p. 109435, Jun. 2021, https://doi.org/10.1016/j.corsci.2021.109435
-
A. Riquelme, P. Rodrigo, M. D. Escalera-Rodríguez, and J. Rams, “Analysis and optimization of process parameters in Al-SiCp laser cladding,” Optics and Lasers in Engineering, Vol. 78, pp. 165–173, Mar. 2016, https://doi.org/10.1016/j.optlaseng.2015.10.014
-
A. Riquelme, P. Rodrigo, M. D. Escalera-Rodríguez, and J. Rams, “Corrosion resistance of Al/SiC laser cladding coatings on AA6082,” Coatings, Vol. 10, No. 7, p. 673, Jul. 2020, https://doi.org/10.3390/coatings10070673
-
Y. Fu, X. Chen, B. Zhang, Y. Gong, H. Zhang, and H. Li, “Fabrication of nanodiamond reinforced aluminum composite coatings by flame spraying for marine applications,” Materials Today Communications, Vol. 17, pp. 46–52, Dec. 2018, https://doi.org/10.1016/j.mtcomm.2018.08.010
-
Yong Mei et al., “Deformation treatment and microstructure of graphene reinforced metal matrix nanocomposite: A review of graphene post-dispersion,” International Journal of Minerals, Metallurgy and Materials, Vol. 27, No. 7, p. 888, 2020, https://doi.org/10.1007/s12613-020-
-
A. Mussatto, I. U. Ahad, R. T. Mousavian, Y. Delaure, and D. Brabazon, “Advanced production routes for metal matrix composites,” Wiley, Engineering Reports, May 2021.
-
V. Dhinakaran, M. Lavanya, K. Vigneswari, M. Ravichandran, and M. D. Vijayakumar, “Review on exploration of graphene in diverse applications and its future horizon,” Materials Today: Proceedings, Vol. 27, pp. 824–828, 2020, https://doi.org/10.1016/j.matpr.2019.12.369
-
F. Z. Bouanis, P. Moutoussammy, I. Florea, N. Dominique, T. Chaussadent, and D. Pribat, “Graphene nanoplatelets coating for corrosion protection of aluminum substrates,” Corrosion, Vol. 75, No. 7, pp. 799–808, Jul. 2019, https://doi.org/10.5006/2960
-
J. L. Li et al., “Microstructure and tensile properties of bulk nanostructured aluminum/graphene composites prepared via cryomilling,” Materials Science and Engineering: A, Vol. 626, pp. 400–405, Feb. 2015, https://doi.org/10.1016/j.msea.2014.12.102
-
S. E. Shin, H. J. Choi, J. H. Shin, and D. H. Bae, “Strengthening behavior of few-layered graphene/aluminum composites,” Carbon, Vol. 82, pp. 143–151, Feb. 2015, https://doi.org/10.1016/j.carbon.2014.10.044
-
G. Liu et al., “In-situ synthesis of graphene decorated with nickel nanoparticles for fabricating reinforced 6061Al matrix composites,” Materials Science and Engineering: A, Vol. 699, pp. 185–193, Jun. 2017, https://doi.org/10.1016/j.msea.2017.05.084
-
G. Li and B. Xiong, “Effects of graphene content on microstructures and tensile property of graphene-nanosheets / aluminum composites,” Journal of Alloys and Compounds, Vol. 697, pp. 31–36, Mar. 2017, https://doi.org/10.1016/j.jallcom.2016.12.147
-
W. Zhou, Y. Fan, X. Feng, K. Kikuchi, N. Nomura, and A. Kawasaki, “Creation of individual few-layer graphene incorporated in an aluminum matrix,” Composites Part A: Applied Science and Manufacturing, Vol. 112, pp. 168–177, Sep. 2018, https://doi.org/10.1016/j.compositesa.2018.06.008
-
A. Bisht, M. Srivastava, R. M. Kumar, I. Lahiri, and D. Lahiri, “Strengthening mechanism in graphene nanoplatelets reinforced aluminum composite fabricated through spark plasma sintering,” Materials Science and Engineering: A, Vol. 695, pp. 20–28, May 2017, https://doi.org/10.1016/j.msea.2017.04.009
-
A. Saboori, M. Pavese, C. Badini, and P. Fino, “Microstructure and thermal conductivity of Al-graphene composites fabricated by powder metallurgy and hot rolling techniques,” Acta Metallurgica Sinica (English Letters), Vol. 30, No. 7, pp. 675–687, Jul. 2017, https://doi.org/10.1007/s40195-017-0579-2
Cited by
About this article

