Abstract
Stimulated by market demand and technological progress, the audio industry is booming. Many high-fidelity earphones are no longer satisfactory with simply providing customers with products but tend to provide customers with more opportunities to adjust their own tuning, one of which is to add the earphones with different acoustic silencer foam. This study begins by introducing the different types of earphones and their development history. After that, the specific research content is raised by questioning the prevailing perception of acoustic silencer foam in earphones. By comparing and analyzing the differences reflected by the frequency response curves of headphones equipped with different types of acoustic silencer foam, it is concluded that the smaller the cells of acoustic silencer foam and the presence of membrane will increase its ability to reduce the loudness at high frequency. This study reveals two significant characteristics which affect the performance of acoustic silencer foam and provides a reliable theoretical basis for the tuning technology of foam.
1. Introduction
A headset is a conversion device that receives electric signals from a media player and converts signals into sound waves through a speaker close to the ear. In terms of the sound process, the dynamic driver and balanced armature driver are alike. Both rely on the vibration of the diaphragm in a permanent magnetic field to produce sound [1]. The most significant difference lies in the construction principle and position of the drivers in the earphone. Inside the balanced armature driver, the electronic signal vibrates a miniature reed balanced between two magnets. This reed drives the diaphragm to produce sound due to magnetic force. The dynamic driver directly mobilizes the diaphragm. Instead, the moving iron is conducted to the center point of a miniature diaphragm through a precisely structured connecting rod, thereby generating vibration and sound. The traditional dynamic driver cannot put the entire unit in the ear [2], while the balanced armature can be readily put into the ear canal due to the tiny driver. This property effectively reduces the cross-section area to make the driver inserted into the ear canal’s deeper part. Since the geometric structure of the ear canal, a round shape, is much simpler than that of the auricle. Thus, soft silicone tips have good sound insulation and an anti-leakage effect compared to dynamic driver earphones. Moreover, the sensitivity of the balanced armature driver is higher than that of the dynamic one. Because of its higher sensitivity, the balanced armature has a better transient response and details.
2. Background
Despite the growing popularity of earphones, a few centuries ago, people never imagined a future in which a music listening device would be so small and portable that it would play such an essential role in everyone’s life. Over the past hundred years, there have been significant developments in the shape of headphones, what drives them, and how they are worn. In the late 1990 s, MP3 players began to appear [3-5], allowing users to store multiple albums for portable playback. 2001-2008 was a window period for the digitalization of music [6-9]. In 2001, Apple announced the arrival of digital music with its groundbreaking iPod device and iTunes service. Apple not only revolutionized the way music was listened to with its intuitive user interface, but it also replaced the foam headphones that everyone had used since the Walkman. One of the main features of the iPod is its smaller earbuds, which can be easily carried in a pocket or bag and can be fitted nicely into the ear without the need for a headband [6-9]. The primary function of the acoustic foam is to eliminate harsh sibilance and prevent earwax from entering the earphone cavity. It is used as a consumable on the earphone and will be replaced periodically. Therefore, five kinds of acoustic silencer foam were used with the same material and size but different internal structures to explore the specific influence of different structural characteristics on earphones’ sound through experiments.
3. Problem statement
Analyzing and comparing different sets of sound output from the same earphone equipped with five kinds of acoustic silencer foam, we want to discover the influence of distinct silencer foam on earphones’ sound. Specifically, we will use Room EQ Wizard as the test software and Ear Simulator to collect the sound signal output by the earphone. During the experiment, we will fix the silencer foam on the sound outlet of the earphone and measure the frequency response curves of the earphone equipped with each kind of acoustic silencer foam. Finally, we will use the appropriate mathematical model to process the measured values and sum up the influence law. The study for the influence of acoustic silencer foam on the output of sound was conducted based on the below software of Room EQ Wizard and apparatus: Sony IER- M7; UGREEN Splitter Jack Plug; IEC-711 Ear Simulator; Acoustic Silencer Foam; Room EQ Wizard. The diagrams of the waterfall and SPL will be studied for 5 types of acoustic silencer foam: #1 foam (largest cells with membranes); #2 foam (second-largest cells with membranes); #3 foam (medium-size cells without membranes); #4 foam (second smallest cells without membrane); #5 foam (smallest calls without membrane). The qualitative relationship between the sound effect and two factors (the existence of membranes in foam and the comparative dimension of cells) can be studied based on visual observation with the pictures shot by Canon EOS-1D X Mark III and SPL diagrams. However, the quantitative relationship cannot be discussed in this study with the limitation of our research resources for apparatus and measurement tools such as scanning electron microscope (SEM).
4. Experiment procedure
Initially, insert the #1 acoustic silencer foam into the sound outlet of the earphone like the above figure, and then connect the cavity to the yellow earplug. That’s because although different earplugs don’t affect the space of the foam, they do affect how the earphone connects to the simulator ear. Specifically, the red and orange earplugs on the left are 10 mm and 11 mm in diameter, respectively, followed by the yellow one, green one, and blue one, which are all 12 mm in diameter but different in height. The yellow one has the shortest height at 9 mm, and the green one is 10 mm, the blue one is 11 mm. Moreover, the shadow blue earplug’s diameter reached 13 mm. Given that the input diameter of the simulator ear is 10 mm, the first two types of earplugs are not closely connected to it, and the last type of earplugs cannot be plugged in. At the same time, the longer length of earplugs will also cause sound leakage due to the distance between the sound outlet of the earphones and the microphone. Therefore, yellow earplugs with a diameter of 12 mm and the shortest length become the only choice. Secondly, before measurement, we need to calibrate the microphone. After selecting the output and input devices, we adjusted the external headset and microphone volume to ensure that the levels of the out, in, and ref were around –12 dB. This work guaranteed that the equipment was connected correctly and the loudness of the sound signals during the test was within an ideal range. Click “Measure” in the upper right corner of the interface and select “Check Levels” to calibrate the headset. We started the measurement after checking that the headset was correct and there was no sizeable ambient noise. We stipulated that in the measurement of the same foam, three groups of almost identical data could judge an adoptive measurement, and we would delete awkward values. By thoroughly measuring the earphone’s frequency response curve about the first type of silencer foam, we removed the earbud and used tweezers to replace another foam. Following this procedure, we measured all the remaining types of acoustic silencer foam.
5. Experiment observation and result discussion
Representative sound pressure level, SPL, is also widely known as efficiency and sensitivity. This parameter represents how loud the output of a headphone is, which is measured by ear simulator IEC 711. In SPL diagrams, the -axis is given for the frequency, which ranges from 2 Hz-23.3 kHz, and the -axis is given for the loudness, which ranges from 0-170 dB. The data collection ranges from 2 Hz-20 kHz. We totally have five different types of acoustic silencer foam (#1 foam has the largest cells with membrane, #2 foam has the second-largest cells with membrane, #3 foam has medium-size cells without membrane, #4 foam has the second smallest cells without membrane, #5 foam has the smallest calls without membrane), because we repeated the tests for three times for each type of acoustic silencer foam so that we will be able to get the averaged data trend for each type of acoustic silencer foam to minimize the random errors of the experimental measurements.
Fig. 1Visual inspection for #1 foam
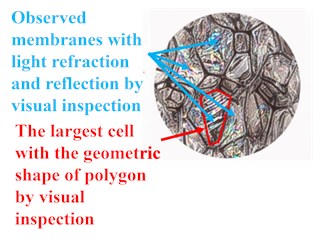
Fig. 2SPL testing result for #1 foam
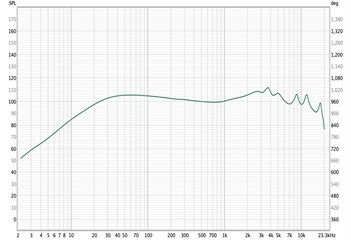
Fig. 3Visual inspection for #2 foam
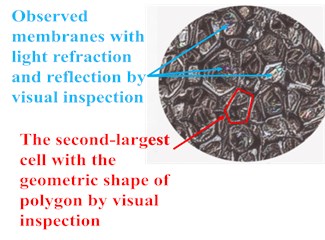
Fig. 4S SPL testing result for #2 foam
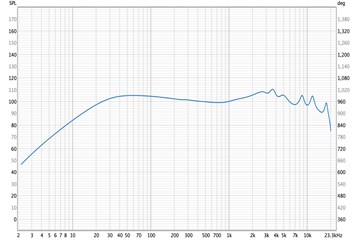
Fig. 1 and Fig. 2 of visual inspection and measurement show that there are several cells with the largest dimensions, which include tetrahedron, pentagon, hexagon and so on. It can also be observed that there are many membranes with light refraction and reflection covering the cell’s surface. When the -axis locates at 3.59 kHz, the -axis locates at 110.4 dB, which is the coordinate point of the maximum point. Along the curve, there are totally seven peaks existing. Figs. 3 and 4 of visual inspection and measurement show that there are several cells with the second-largest dimensions, which include tetrahedron, pentagon, hexagon and so on. It can also be observed that there are some membranes with light refraction and reflection covering the cell’s surface. When -axis locates at 3.59 kHz, the -axis locates at 110.4 dB, which is the coordinate point of the maximum point. Along the curve, there are totally seven peaks existing. Fig. 5 and Fig. 6 of visual inspection and measurement show that there are several cells with comparatively middle dimensions, which include tetrahedron, pentagon, hexagon and so on. It can also be observed that there are no membranes because no light refraction and reflection can be seen. When the -axis locates at 3.69 kHz, the -axis locates at 111.6 dB, which is the coordinate point of the maximum point. Along the curve, there are totally seven peaks existing.
Fig. 5Visual inspection for #3 foam
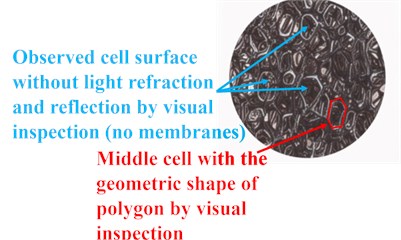
Fig. 6SPL testing result for #3 foam
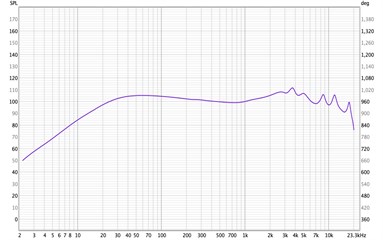
Fig. 7Visual inspection for #4 foam

Fig. 8SPL testing result for #4 foam
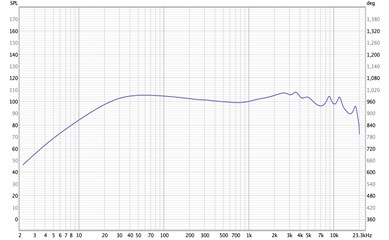
Fig. 9Visual inspection for #5 foam
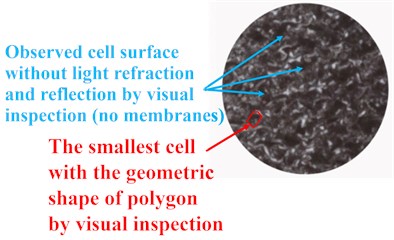
Fig. 10SPL testing result for #5 foam
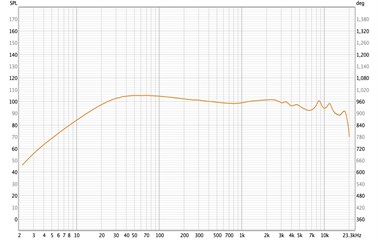
Fig. 7 and Fig. 8 of visual inspection and measurement show that there are several cells with the second-smallest dimensions, which include tetrahedron, pentagon, hexagon and so on. It can also be observed that there are no membranes because no light refraction and reflection can be seen. When -axis locates at 3.55 kHz, the -axis locates at 107.9 dB, which is the coordinate point of the maximum point. Along the curve, there are totally seven peaks existing.
Fig. 9 and Fig. 10 of visual inspection and measurement show that there are several cells with the smallest dimensions, which include tetrahedron, pentagon, hexagon and so on. It can also be observed that there are no membranes because no light refraction and reflection can be seen. When the -axis locates at 60 kHz, the -axis locates at 105.2 dB, which is the coordinate point of the maximum point. Along the curve, there are totally seven peaks existing.
6. Data analysis
The comparison result of foam #3, #4 & #5 shows that the 1st peak point (frequency of 60 Hz) response curve, the loudness of acoustic silencer foam #3, #4, #5 are 105.2 dB, 105.4 dB, 105.2 dB, respectively, which does not show an obvious difference. Nonetheless, at the 2nd peak, about 2.5 kHz, the three kinds of foam have loudness at 108.2 dB, 107.2 dB, and 101.6 dB, meaning that the sound loudness of #4 is 1 dB weaker than the loudness of #3, and the sound of #5 is 5.6 dB weaker than the loudness of #4. At the third peak, around 3.5 kHz, the loudness of the three types of foam are 111.6d B, 107.9 dB, and 99.7 dB, separately, showing the greatest differences that the loudness of #4 is 3.7 dB weaker than the sound loudness of #3 and the sound loudness of #5 is 8.2 dB lower than the sound loudness of #4. At the fourth peak, around 4.8 kHz, the loudness was 106.9 dB, 103.8 dB, and 97.4 dB, meaning that #4 is 3.1 dB weaker than the sound of #3 and the sound of #5 is 5.4dB weaker than the loudness of #4. At the fifth peak, about 8.7 kHz, the loudness is 106 dB, 104.5 dB, 100.8 dB, meaning that the sound loudness of #4 is 1.5 dB weaker than the loudness of #3 and the loudness of #5 is 3.3 dB weaker than the loudness of #4. At the sixth peak, around 11.7 kHz, the loudness is 105.6 dB, 103.9 dB, and 98.3 dB, meaning that #4 is 1.7d B weaker than the sound loudness of #3, and the sound loudness of #5 is 5.6 dB weaker than the sound of #4. At the last peak, around 17.7 kHz, the loudness is 99.8 dB, 96.2 dB, and 92.1dB, meaning that the sound loudness of #4 is 3.6dB weaker than the sound of #3 the sound of #5 is 4.1 dB weaker than the loudness of #4. Overall, the decay of the three types of foam without membrane shows no apparent difference in the low-frequency performance, while the degree of decay in high frequency increases significantly as the density of the foam raise.
The comparison result of foam #1, #2 & #3 shows that the first peak point of the frequency response curve, which is at 60 Hz, the loudness of acoustic silencer foam #1, #2, #3 are 105.3 dB, 105.2 dB, 105.2 dB, respectively. At the second peak, about 2.7 kHz, the three kinds of foam have loudness at 108.5 dB, 108.3 dB, and 108.2 dB, which does not show an obvious difference. Nonetheless, at the third peak, around 3.6 kHz, the loudness of the three types of foam are 111.7 dB, 110.4 dB, and 111.6 dB, separately, meaning that the loudness of #2 is 1.2 dB weaker than the sound loudness of #3 and the sound loudness of #1 and #3 have no significant difference. At the fourth peak, around 4.9 kHz, the loudness was 106.9 dB, 105.5 dB, and 106.9 dB, meaning that #2 is 1.4 dB weaker than the sound loudness of #3 and the sound loudness of #1 and #3 have no significant difference. At the fifth peak, about 8.6 kHz, the loudness is 106 dB, 105.2 dB, 106 dB, meaning that the sound loudness of #2 is 0.8 dB weaker than the loudness of #3 the loudness of #1 and #3 have no significant difference. At the sixth peak, around 11.7 kHz, the loudness is 105.7 dB, 104.8 dB, and 105.6 dB, meaning that #2 is 0.9 dB weaker than the sound loudness of #3, and the sound loudness of #1 and #4 have no significant difference. At the last peak, around 17.6 kHz, the loudness is 98.9 dB, 99 dB, and 99.8 dB, meaning that the sound loudness of #2 is 0.8 dB weaker than the sound loudness of #3 the sound loudness of #1 is 0.9 dB weaker than the loudness of #3. It can be seen that the membrane structure has the ability to subside the high-frequency because in the analysis of 3 kinds of foam without membrane (the smaller the size of cells, the stronger the ability to decrease high-frequency). It also works in the case of foam with membrane structure. Therefore, in this group of experiments, from the perspective of cell size alone, as the cells of #1 and #2 foam are larger than #3 foam, the reduction of the high-frequency of #3 foam should have exceeded these former two kinds of foam, but the results are opposite. Compared with #1 foam, whose size differs greatly from cells. The frequency response curve of #3 foam almost coincides with that of #1 foam, and the decibel number of peaks is also very close. In addition, cells of #3 foam are relatively small compared to #2 foam, but its ability to decrease high-frequencies is even less than that of #2 foam. This seeming paradox result makes us realize that another variable – the presence or absence of membranes – plays a much more critical role in this set of experiments and that the presence of a membrane dramatically attenuates sound high-frequency.
After searching a myriad of resources in terms of how porous material with or without membranes affects the sound output and combining with our experimental data to analysis, we acknowledged that #1 and #2 acoustic silencer foams with membranes influence the high frequency of the sound more significantly. The primary mechanism of sound absorption is the viscous dissipation between fluid and the solid [9]. Although due to limited funds, we failed to have SEM to generate images and obtain the exact non-acoustic properties from the manufacturer but visual observations with the camera show structural differences between the five types of foam. The small size of the membrane and cells reduces high-frequency loudness because they provide greater airflow resistance to the propagation of sound waves. However, as the influence of acoustic silencer foam on sound is not in the full frequency band but concentrated in the middle and high-frequency band, this phenomenon still puzzles us. It may be caused by the characteristics of polyurethane material itself or the limitation of experimental equipment that makes it impossible to show obvious effects. Moreover, the harsh sibilance can be significantly improved by inserting the foam. Simultaneously, the sound field turns to be broader with the foam applied. The structure of porous material with numerous cells and struts facilitates spreading the sound wave and hence reducing the sound pressure, giving us a sense of the wider field. However, the output of sound is related to a wide range of variates, such as the cavity of an earphone, the material of the cavity, the position of dynamic or balanced armature drivers, and the length of the acoustic foam, all of which will influence the output of sound. All of them have not been changed but controlled in our experiments, but they are worth looking into and building up a model to discuss further. Nevertheless, changing these variates entails considerable computational cost, therefore not included in this paper, but they provide direction and possibility for our future research direction.
7. Conclusions
With Room EQ Wizard software, the frequency response curves of Sony IER-M7 earphones equipped with different kinds of silencer foam were measured. The range of different monotonous intervals of curves was summarized, and the specific differences between peak values of frequency response curves were compared under different conditions. It can be concluded that in acoustic silencer foam structure, the size of cells is negatively correlated with its ability to reduce high-frequency loudness, and the existence of film can also reduce high-frequency loudness. Through experiments, the cement evidence was used to answer the previous questions, and had a more comprehensive and scientific cognition of acoustic silencer foam’s actual function and parameters were achieved. In addition, eventually, a bold trial was made to attempt to explain the phenomenon of experimental results after a deeper understanding of porous materials during the scientific research. In a nutshell, it was a successful attempt, an unforgettable and rewarding experience, and a bridge between personal interests and academic research.
References
-
Y.-W. Jiang, D.-P. Xu, Z.-X. Jiang, J.-H. Kim, and S.-M. Hwang, “Analysis and development of hybrid earphone combining balanced-armature and dynamic receivers,” Applied Sciences, Vol. 9, No. 23, p. 5047, Nov. 2019, https://doi.org/10.3390/app9235047
-
P. Ha, “Custom-made headphones: listen up before it’s too late,” Time, Vol. 16, p. 62, 2010.
-
J. Stamp, A Partial History of Headphones. Smithsonian Magazine, 2013.
-
C. Smith. “Now hear this: the history of headphones.” The Guardian, 2011. https://www.theguardian.com/business/2011/oct/30/history-of-headphones
-
T. Hirahara, “Physical characteristics of headphones used in psychophysical experiments,” Acoustical Science and Technology, Vol. 25, No. 4, pp. 276–285, 2004, https://doi.org/10.1250/ast.25.276
-
Paul Du Gay, Stuart Hall, Linda James, Anders Koed Madsen, Hugh Mackay, and Keith Negus, Doing Cultural Studies: The Story of the Sony Walkman. California: SAGE Publications, 2013.
-
J. Sterne, “MP3: The Meaning of a Format,” Duke University press, 2012.
-
“Cable Design: Theory Verses Evidence.” 2006. https://www.audiovisualonline.co.uk/media/audioquest/pdfs/aq_cable_theory.pdf
-
K. Gao, J. A. W. van Dommelen, and M. G. D. Geers, “Microstructure characterization and homogenization of acoustic polyurethane foams: Measurements and simulations,” International Journal of Solids and Structures, Vol. 100-101, pp. 536–546, Dec. 2016, https://doi.org/10.1016/j.ijsolstr.2016.09.024
About this article

