Abstract
In the current work, the nonlinear dynamic behavior of an eight degrees of freedom gear system is investigated. Tooth crack is introduced into the model. The main sources of excitation are the time varying mesh stiffness (TVMS), time varying mesh damping, backlash and friction inter teeth. By using the potential energy method applied into the cantilevered beam, the TVMS is calculated. The backlash is considered as a dead zone. The effect of backlash, friction and tooth crack on the vibration frequencies is highlighted. The crack detection is based on the time-frequency analysis.
1. Introduction
Currently, monitoring and diagnosis of rotating machines have become an absolute necessity because of their importance in most industrial sectors where the gear is a ubiquitous component in these machines. Gears are used for changing the rotational speed between two shafts. In spite of their advantages, defects may occur leading to limiting their lives and increasing vibration and noise. These defaults are caused either by inadequate lubrication or by errors in mounting or excessive loads. Indeed, the crack is considered as one of the most dangerous defects encountered by gear tooth and it can be developed into the tooth breakage. As the noise and vibration are undesired phenomena in structures where their nonlinear behavior study is essential. M. Sayed et al. [1] focused on applying active control to nonlinear dynamical beam system to eliminate its vibration. They analyzed stability using frequency-response equations and bifurcation and investigated the effects of most system parameters on its stability. A. Kandil et al. [2] investigated the 16-pole rotor-AMB system at constant stiffness coefficients. Several bifurcation diagrams were plotted to show the influences of the different system parameters on the overall dynamical behavior of the rotor whirling motion. Y. S. Hamed et al. [3] applied a time-delay PPF controller to reduce the nonlinear vibrations of a contact-mode AFM model. The effect of different parameters on frequency response curves of the system before and after control was implemented. The gain effects on the vibration amplitude and stability behavior are studied. A. A. Moussa et al. [4] investigated the stability of a simply supported laminated composite piezoelectric rectangular plate under combined excitations. The influence of different parameters on the dynamic behavior of the composite laminated piezoelectric rectangular plate is studied. Variation of some parameters leads to multivalued amplitudes and hence to jump phenomena. Therefore, the need to study and model the gear vibration signature in the presence of cracked tooth.
In the dynamic modeling of gear systems, the transmission is decomposed into simple elements: mass, spring and damper. Many models have been proposed in the literature [5-8]. In addition, some works considered the effect of the friction force in their model [9-11]. The TVMS is considered as the most important source of excitation which depends on the time varying point of meshing during the line of action (LOA). Several research works have given a great interest in its study in healthy and cracked cases [12-15].
The presence of crack on one or more teeth produces shocks in the vibration signal and can introduces a non-stationarity in the signal. Indeed, the choice of signal processing tools play crucial role for gear defect detection. Several methods have been used in the time, frequency and time-frequency domain. M. Er-raoudi et al. [16] used a time-frequency analysis by the Continuous Wavelet Transform for gear tooth fault detection in comparison with classical methods. Also, they used an intelligent method based artificial neural networks [17]. Polyshchuk et al. [18] presented a NP4 gear fault detection parameter which is derived from the joint time-frequency Wigner Ville distribution. Cai et al. [19] proposed the gear fault diagnosis based on the time-frequency domain denoising using the generalized S-transform. Staszewski et al [20] studied the use of the Wigner-Ville distribution in gearbox condition monitoring for broken tooth and the application of the pattern recognition to spur gear vibration data.
The main objectives of this work are the modeling of gearbox system, the study of the non-linearity of the vibration signal in the presence of the crack, the evaluation of crack parameters, backlash and friction coefficient on the vibratory signal, and the early fault detection using the joint time-frequency analysis. For this purpose, a nonlinear dynamic model of the gear system, with eight degrees of freedom, is investigated. The defect is incorporated into a model by the time varying mesh stiffness considering the bending, shear, axial compressive, Hertzian effect [6, 21, 22] and fillet- foundation deflection [23]. Also, the time varying friction force is considered. A comparison between the Smoothed Pseudo Wigner Ville Distribution, the Continuous Wavelet Transform and S-Transform in gear tooth crack detection is made. Then the present works is based on a dynamic gear model which take into account all effects and gives in the same time the influence of system parameters on its dynamic behavior and the defect analysis.
2. Mechanical modelling
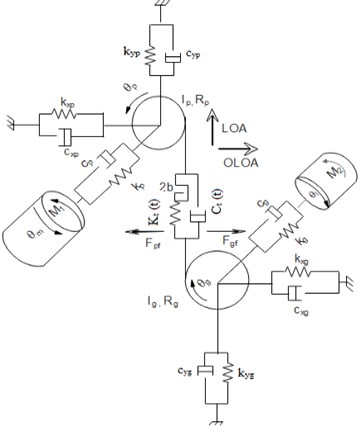
The gear pair model examined in this study is based on the model developed in [6, 9]. As illustrated in Fig. 1, it has an eight degrees of freedom (8 DOF), with masses , base radius , is the mass moment of inertia of the motor/load, is the pinion/gear rotation, is the motor/load rotation, is the input/output torque. is the time varying mesh stiffness/damping, , , and represent the bearings stiffness, , , and represent the bearings damping is the shaft damping, is the shaft stiffness. The present model takes into account the friction between teeth and backlash with 2b coefficient where is the friction force of the pinion/gear.
Fig. 1Eight DOF Gear pair model
The TVMS is calculated based on Yang and Lin [21] potential energy method. In this method, the gear tooth is considered as a non-uniform cantilevered beam on base circle with an effective length L, then the deflections under the action of the force can be determined. The fillet-foundation deflection is calculated using reference [23]. Then, the TVMS of one pair is considered as nine springs in series, it is computed by the Eq. (1):
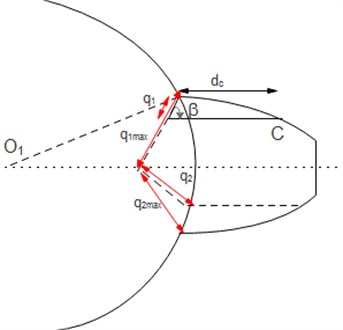
where is the Hertzian stiffness, is the bending stiffness, is the axial compressive stiffness, is the shear stiffness and is the fillet-foundation stiffness. In the presence of crack, the tooth is still considered as a cantilevered beam, the crack starts at the tooth root with length (from root to point C), opening crack angle and depth . The crack propagates through the gear tooth length . When reached its maximum the crack depth propagation change direction into which is symmetric to [22]. The Fig. 2 represents cracked tooth model.
Fig. 2Cracked tooth model
The equations of motion of the present model are as follows:
where is the relative displacement expressed as:
where is the dynamic transmission error expressed by the Eq. (11):
The backlash is represented by a nonlinear function with coefficient of the dead zone as defined by:
is the contact force defined by the following equation:
The force is the total friction force, which is moving in the OLOA (off line of action) direction; its calculation is based on the He et al work [15].
3. Materials and methods
The time analysis lets to extract time information from the signal while the spectral analysis gives a global frequency representation and any notion of chronology has disappeared and used to analyze the stationary signals. Both these two representations don’t show how the frequency content of a signal changes over time. The joint time-frequency analysis is a set of transforms that maps a one-dimensional time domain signal into a two-dimensional representation of energy versus both the time and frequency. In this work, we use the time-frequency analysis based three methods: Smoothed Pseudo Wigner Ville distribution, Continuous Wavelet Transform and the Stockwell Transform.
3.1. Smoothed pseudo Wigner Ville distribution
The Wigner Ville Distribution (WVD) is a non-linear transformation provides a time-frequency decomposition. It is mathematically defined as the Fourier transform of the autocorrelation of the signal given as follows [24, 25]:
where is the conjugate of the signal , is the WVD of the continuous signal , , represents time and frequency respectively.
The WVD satisfying many good mathematical properties such as energy conservation, real-valued, marginal properties, translation and dilation covariance [26]. The drawback of the WVD is the presence of cross term interference in case of multiple components signal. Its computation requires the signal to be known in all the time but the integration is for an infinite interval. This problem can be solved using windows leading to the definition of the Pseudo Wigner Ville Distribution (PWVD) [27]. This windowing operation is with a smoothing of the frequency only from the WVD, the PWVD is given by the Eq. (15):
where is the window, to reduce the oscillating interference produced by PWVD analysis, the SPWVD is proposed. It lets to perform a smoothing separable in time and frequency controlled by two independent windows of time and frequency ; defined by [24, 25]:
3.2. Continuous wavelet transform
The Continuous Wavelet Transform (CWT) is a time-scale representation based on decomposing a signal into a family of functions localized in time and scale, called wavelets which is constructed by expanding and translating a base wavelet called mother wavelet. For a given continuous signal the CWT is defined by the following formula [24, 25]:
where represent the complex conjugate of the mother wavelet , the pair is the time-scale variable. The quantity is an energy normalized factor which means that the energy of the wavelet must be the same for any value of scale parameter a. The function must satisfy a set of mathematical criteria [28]: The wavelet must have finite energy, and must hold the admissibility condition.
3.3. Stockwell transform
The Stockwell Transform or S-Transform (ST) is a time-frequency analysis method which is deduced from short-time Fourier transform and CWT [29], known for its local spectral phase properties. It combines a frequency dependent resolution of the time-frequency space and absolutely referenced local phase information [30]. The ST of a continuous signal is expressed as [30]:
where is defined as a one-dimensional function of time for a constant frequency , which shows how the amplitude and phase for this exact frequency change over time.
4. Results and discussion
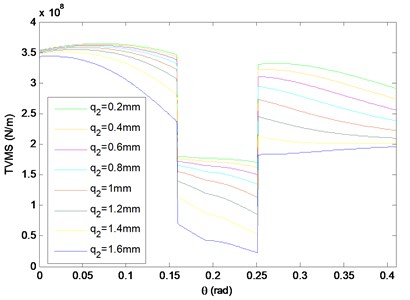
The TVMS is simulated in two cases, healthy and defected, in MATLAB with the parameters given in Table 1. It is a periodic function in normal case as obtained in Fig. 3. In the presence of one tooth crack, the variation of the crack depth value showed that as the crack grows up, the TVMS decreases as illustrated in Fig. 4.
Table 1Parameters of the pinion and the wheel [31]
Pinion | Wheel | |
Teeth number | 25 | 30 |
Module (mm) | 2 | 2 |
Teeth width (mm) | 20 | 20 |
Contact ratio | 1.63 | 1.63 |
Rotational speed (Rpm) | 2400 | 2000 |
Pressure angle | 20° | 20° |
Young modulus (N/mm²) | 2.105 | 2.105 |
Poisson ratio | 0.3 | 0.3 |
Fig. 3Total TVMS for a healthy gear in one mesh revolution
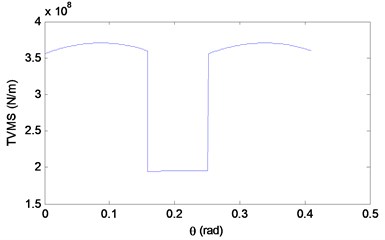
Fig. 4TVMS in cracked case: q2 from 0.02 mm to 1.6 mm
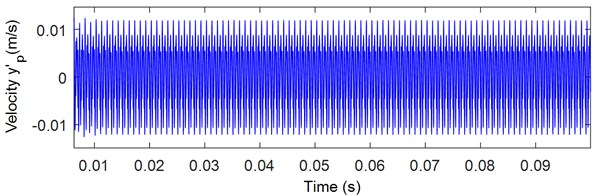
The equations of motion are resolved using the ode15s MATLAB with the parameters presented in Tables 1 and 2. The meshing frequency is 1000 Hz; the pinion and gear rotation frequencies are 40 Hz and 33.33 Hz respectively with a sampling frequency of 20 kHz. The obtained pinion time, displacement and velocity, and frequency response in the y-direction are represented respectively in Figs. 5 and 6. This pinion response signal is composed by the meshing frequency and its harmonics (Fig. 6).
Fig. 5Pinion response in y direction: a) displacement, b) velocity
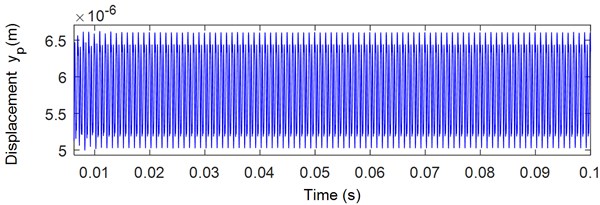
a)
b)
Fig. 6Pinion spectrum in y direction
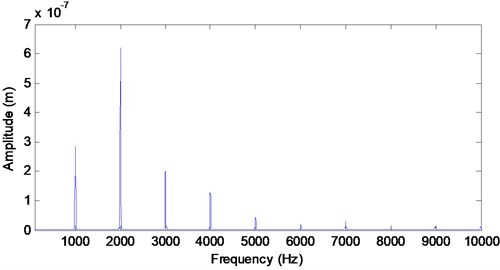
Table 2Gear system parameters [32]
Pinion | Wheel | |
Mass (kg) | 0.4439 | 0.3083 |
Moment of inertia (kgm2) | 2×10⁻³ | 0.96×10⁻⁴ |
Radial stiffness of the bearing (N/m) in the , directions | 6.56×10⁸ | 6.56×10⁸ |
Damping of the bearing (Ns/m) in the , directions | 1.8×10³ | 1.8×10³ |
Damping of the coupling (Nms/rad) | 5×10⁵ | |
Torsional stiffness of the coupling (Nm/rad) | 4.4×10⁴ | |
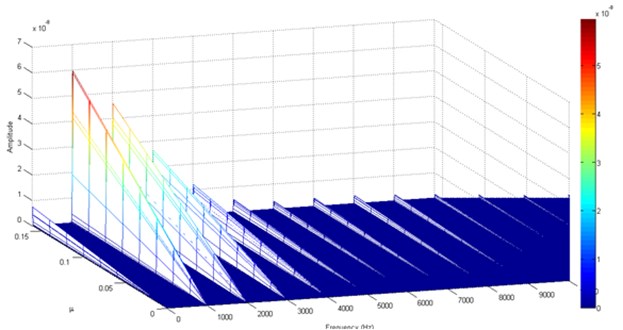
When the friction coefficient is equal 0 the vibration in the -direction is neglected. Taking into account the friction effect, the vibration in the -direction is shown in Fig. 7. Also, the response is composed by the meshing frequency and its harmonics (Fig. 8). Fig. 9 illustrates the effect of the friction coefficient on the frequency response. As the friction coefficient increases, the meshing frequencies amplitude increases. Hence the vibration in the -direction is resulted by the friction force.
Fig. 7Pinion response in x direction: a) displacement, b) velocity
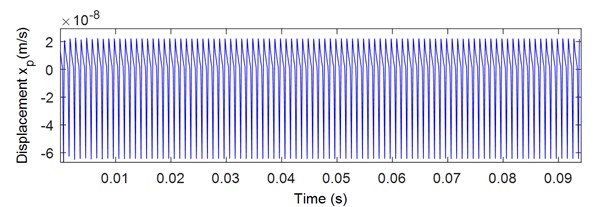
a)
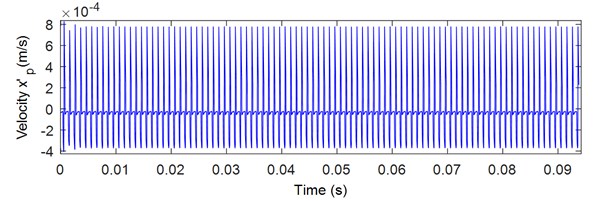
b)
Fig. 8Pinion spectrum in x direction
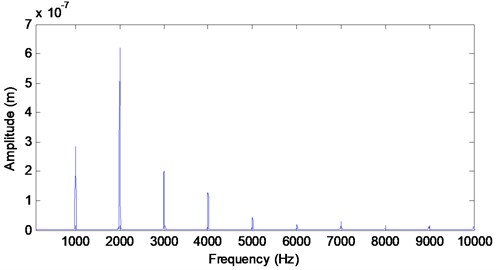
Fig. 9Evolution of the spectrum as a function of the coefficient μ
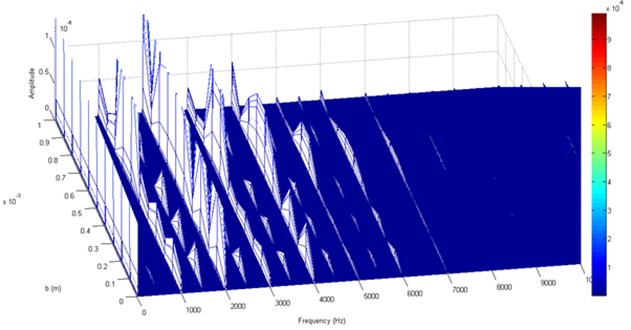
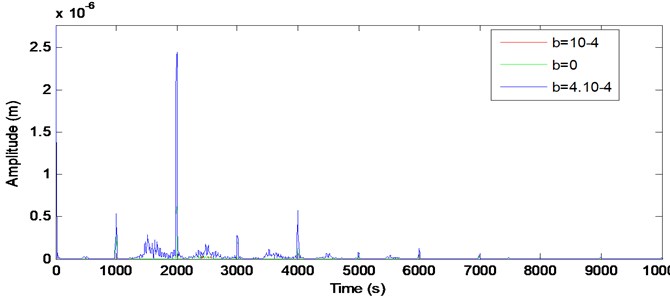
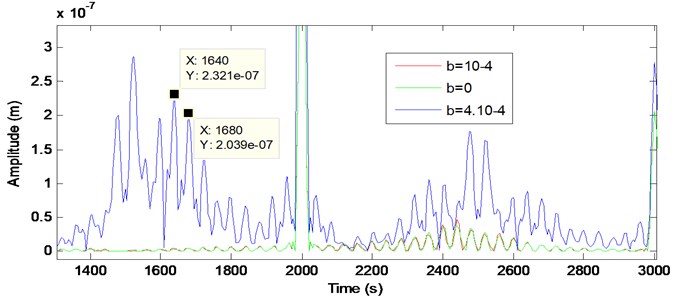
The effect of the backlash coefficient , in the healthy case, on the vibration frequency response is shown in Fig. 10 where the meshing frequencies varies with the variation of the backlash coefficient . This evolution is due to the pass of the TVMS from the dead zone hence the phenomenon of impact between teeth.
Fig. 10Spectrum variation versus the backlash coefficient b changing
The vibration in the time and the frequency domains in the presence of cracked pinion tooth are represented in Fig. 11 which shows the appearance of sidebands around the meshing frequency and its harmonics. The residual signal is presented in the time domain and in the frequency domain (Fig. 12) where a periodic shock with a period equal to pinion rotation time (0.025 s) which contains the cracked tooth. This sidebands magnitude increases with the presence of backlash as found in Figs. 13 and 14.
Fig. 11yp for the cracked case: a) in time domain, b) in frequency domain
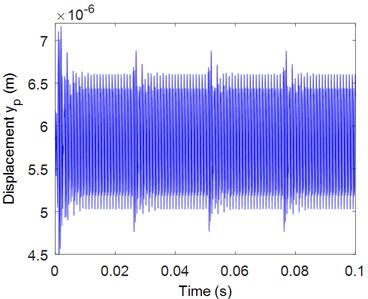
a)
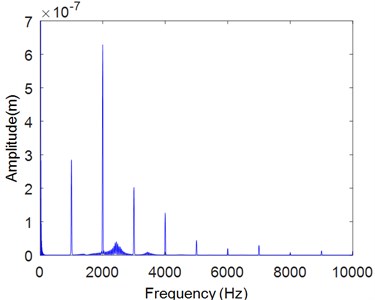
b)
Fig. 12Residual signal of yp: a) in time domain, b) in frequency domain.
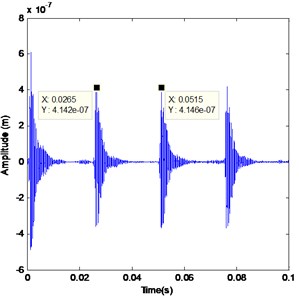
a)
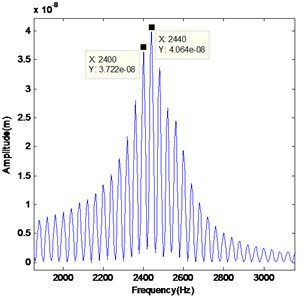
b)
Fig. 13Effect of backlash on vibration spectrum
In comparison with the classical methods, the time-frequency analysis by CWT, SPWVD and ST gives the representation in the joint time and frequency domain (Fig. 15, Fig. 16 and Fig. 17).
Fig. 14Zoom on Fig. 13
The three used methods let us to detect the presence of shocks in the vibratory signal therefore the presence of crack and the spectrum maximum pic (2000 Hz) and the resonance around this frequency. The SPWVD and ST extract more shock in comparison with the CWT that extract more signal features as represented in Fig. 18 which shows the maximum of the extracted components by each method. The SPWVD allows us to extract the defect due to the use of windows and smoothed windows neglecting the repeated information extracted by WVD. Also, the ST permit the detection of defect and the possibility of using its inverse Transform and phase information.
Fig. 15Time-frequency representation by CWT
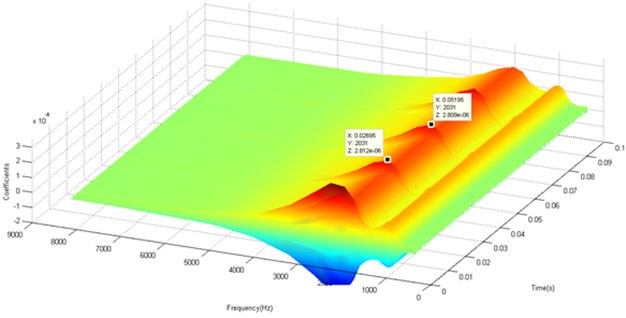
Fig. 16Time-frequency representation by SPWV
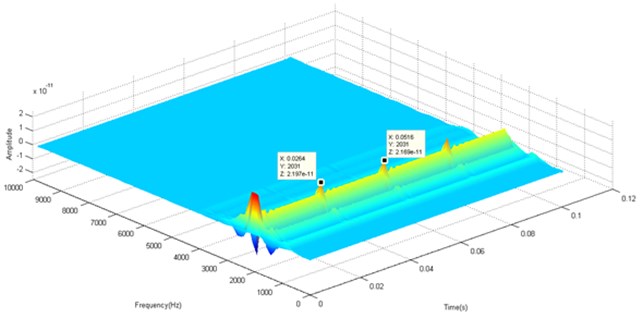
Fig. 17Time frequency representation using the S-Transform
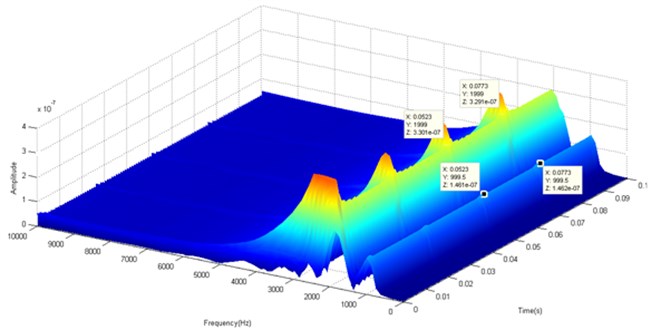
Fig. 18Maximum of extracted components by: a) CWT, b) SPWV, c) ST
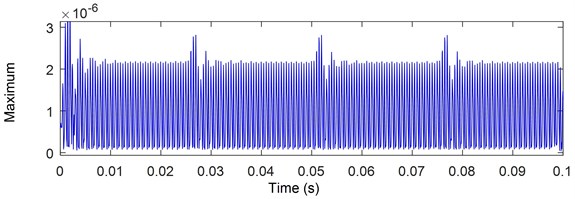
a)
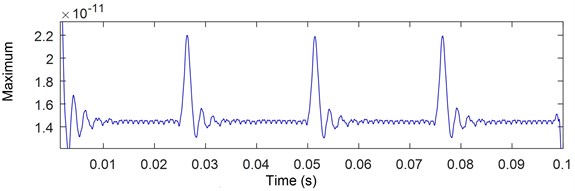
b)
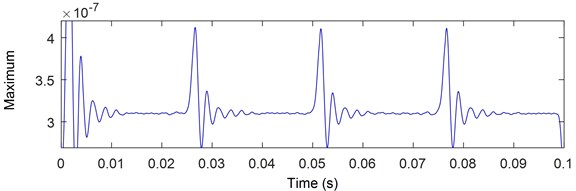
c)
5. Conclusions
An eight DOF gear system is investigated taking into account the effect of friction, backlash and tooth crack. The gear nonlinear dynamic behavior is depending on the model parameters. The increasing of the friction coefficient leads to the increasing in the meshing frequencies magnitude. The presence of backlash passes the TVMS from the dead zone causing a non-linearity in the signal. In the cracked case, the sidebands magnitude, relative to the defect, increases with the presence of backlash. Three time-frequency methods are used: SPWVD, CWT and ST which showed that the tree methods let detect the presence of crack.
References
-
M. Sayed, A. A. Mousa, and I. Mustafa, “Stability and bifurcation analysis of a buckled beam via active control,” Applied Mathematical Modelling, Vol. 82, pp. 649–665, Jun. 2020, https://doi.org/10.1016/j.apm.2020.01.074
-
A. Kandil, M. Sayed, and N. A. Saeed, “On the nonlinear dynamics of constant stiffness coefficients 16-pole rotor active magnetic bearings system,” European Journal of Mechanics – A/Solids, Vol. 84, p. 104051, Nov. 2020, https://doi.org/10.1016/j.euromechsol.2020.104051
-
Y. S. Hamed, K. M. Albogamy, and M. Sayed, “Nonlinear vibrations control of a contact-mode AFM model via a time-delayed positive position feedback,” Alexandria Engineering Journal, Vol. 60, No. 1, pp. 963–977, Feb. 2021, https://doi.org/10.1016/j.aej.2020.10.024
-
A. A. Mousa, M. Sayed, I. M. Eldesoky, and W. Zhang, “Nonlinear stability analysis of a composite laminated piezoelectric rectangular plate with multi-parametric and external excitations,” International Journal of Dynamics and Control, Vol. 2, No. 4, pp. 494–508, Dec. 2014, https://doi.org/10.1007/s40435-014-0057-x
-
F. Chaari, T. Fakhfakh, and M. Haddar, “Analytical modelling of spur gear tooth crack and influence on gearmesh stiffness,” European Journal of Mechanics – A/Solids, Vol. 28, No. 3, pp. 461–468, May 2009, https://doi.org/10.1016/j.euromechsol.2008.07.007
-
Tian X., “Dynamic Simulation for System Response of Gearbox Including Localized Gear faults,” M.Sc. Thesis, University of Alberta. Alberta, Canada, 2004.
-
O. D. Mohammed, M. Rantatalo, and J.-O. Aidanpää, “Improving mesh stiffness calculation of cracked gears for the purpose of vibration-based fault analysis,” Engineering Failure Analysis, Vol. 34, pp. 235–251, Dec. 2013, https://doi.org/10.1016/j.engfailanal.2013.08.008
-
O. D. Mohammed, M. Rantatalo, J.-O. Aidanpää, and U. Kumar, “Vibration signal analysis for gear fault diagnosis with various crack progression scenarios,” Mechanical Systems and Signal Processing, Vol. 41, No. 1-2, pp. 176–195, Dec. 2013, https://doi.org/10.1016/j.ymssp.2013.06.040
-
W. Bartelmus, “Mathematical modelling and computer simulations as an aid to gearbox diagnostics,” Mechanical Systems and Signal Processing, Vol. 15, No. 5, pp. 855–871, Sep. 2001, https://doi.org/10.1006/mssp.2001.1411
-
M. Mohamed El Badaoui, “Contribution au Diagnostic Vibratoire des Réducteurs Complexes à Engrenages par l’Analyse Cepstrale,” Ph.D. Thesis, Jean Monnet University, t Saint Etienne, France, 1999.
-
H. Nevzat Özgüven and D. R. Houser, “Mathematical models used in gear dynamics-A review,” Journal of Sound and Vibration, Vol. 121, No. 3, pp. 383–411, Mar. 1988, https://doi.org/10.1016/s0022-460x(88)80365-1
-
K. F. Brethee, F. Gu, and A. D. Ball, “Frictional effects on the dynamic responses of gear systems and the diagnostics of tooth breakages,” Systems Science and Control Engineering, Vol. 4, No. 1, pp. 270–284, Jan. 2016, https://doi.org/10.1080/21642583.2016.1241728
-
F. Liu, H. Jiang, S. Liu, and X. Yu, “Dynamic behavior analysis of spur gears with constant and variable excitations considering sliding friction influence,” Journal of Mechanical Science and Technology, Vol. 30, No. 12, pp. 5363–5370, Dec. 2016, https://doi.org/10.1007/s12206-016-1103-8
-
F. Liu, H. Jiang, L. Zhang, and L. Chen, “Analysis of vibration characteristic for helical gear under hydrodynamic conditions,” Advances in Mechanical Engineering, Vol. 9, No. 1, p. 168781401668796, Jan. 2017, https://doi.org/10.1177/1687814016687962
-
S. He, R. Gunda, and R. Singh, “Effect of sliding friction on the dynamics of spur gear pair with realistic time-varying stiffness,” Journal of Sound and Vibration, Vol. 301, No. 3-5, pp. 927–949, Apr. 2007, https://doi.org/10.1016/j.jsv.2006.10.043
-
M. Er-raoudi, M. Diany, H. Aissaoui, and M. Mabrouki, “Numerical gear vibration simulation in the presence of localized and distributed defects,” Journal of Engineering Science and Technology, Vol. 2, No. 4, pp. 576–581, Jan. 2015.
-
M. Er-Raoudi, M. Diany, H. Aissaoui, and M. Mabrouki, “Gear fault detection using artificial neural networks with discrete wavelet transform and principal component analysis,” Journal of Mechanical Engineering and Sciences, Vol. 10, No. 2, pp. 2016–2029, Sep. 2016, https://doi.org/10.15282/jmes.10.2.2016.6.0190
-
V. V. Polyshchuk, F. K. Choy, and M. J. Braun, “Gear fault detection with time-frequency based parameter NP4,” International Journal of Rotating Machinery, Vol. 8, No. 1, pp. 57–70, 2002, https://doi.org/10.1155/s1023621x02000064
-
J. Cai and X. Li, “Gear fault diagnosis based on time-frequency domain de-noising using the generalized S transform,” Journal of Vibration and Control, Vol. 24, No. 15, pp. 3338–3347, Aug. 2018, https://doi.org/10.1177/1077546317704793
-
W. J. Staszewski, K. Worden, and G. R. Tomlinson, “Time-frequency analysis in gearbox fault detection using the Wigner-Ville distribution and pattern recognition,” Mechanical Systems and Signal Processing, Vol. 11, No. 5, pp. 673–692, Sep. 1997, https://doi.org/10.1006/mssp.1997.0102
-
D. C. H. Yang and J. Y. Lin, “Hertzian damping, tooth friction and bending elasticity in gear impact dynamics,” Journal of Mechanisms, Transmissions, and Automation in Design, Vol. 109, No. 2, pp. 189–196, Jun. 1987, https://doi.org/10.1115/1.3267437
-
S. Wu, M. J. Zuo, and A. Parey, “Simulation of spur gear dynamics and estimation of fault growth,” Journal of Sound and Vibration, Vol. 317, No. 3-5, pp. 608–624, Nov. 2008, https://doi.org/10.1016/j.jsv.2008.03.038
-
P. Sainsot And, P. Velex, and O. Duverger, “Contribution of gear body to tooth deflections-a new bidimensional analytical formula,” Journal of Mechanical Design, Vol. 126, No. 4, pp. 748–752, Jul. 2004, https://doi.org/10.1115/1.1758252
-
Allard J. F., Bourdier R., and Depollier C., “3 – Utilisation de la pseudo-distribution de Wigner-Ville lissée pour la détermination de l’instant de fermeture de la glotte,” Journal de Traitement du Signal, Vol. 4, No. 4, pp. 305–310, 1987.
-
Meryem Jabloun, “Modélisation de signaux fortement non stationnaires à phase et à amplitude locales polynomiales,” Traitement du signal et de l’image. Institut National Polytechnique de Grenoble – INPG, Oct. 2007.
-
T. A. C. M. Claasen and W. F. G. Mecklenbrauke, “The Wigner distribution-A tool for time-frequency signal analysis-Part I: Continuous – time signals,” Philips Journal of Research, Vol. 35, pp. 275–300, 1980.
-
P. Flandrin and B. Escudié, “An interpretation of the Pseudo-Wigner-Ville distribution,” Signal Processing, Vol. 6, No. 1, pp. 27–36, Jan. 1984, https://doi.org/10.1016/0165-1684(84)90048-3
-
D. Komorowski and S. Pietraszek, “The use of continuous wavelet transform based on the fast fourier transform in the analysis of multi-channel electrogastrography recordings,” Journal of Medical Systems, Vol. 40, No. 1, Jan. 2016, https://doi.org/10.1007/s10916-015-0358-4
-
R. G. Stockwell, L. Mansinha, and R. P. Lowe, “Localization of the complex spectrum: the S transform,” IEEE Transactions on Signal Processing, Vol. 44, No. 4, pp. 998–1001, Apr. 1996, https://doi.org/10.1109/78.492555
-
R. G. Stockwell, “A basis for efficient representation of the S-transform,” Digital Signal Processing, Vol. 17, No. 1, pp. 371–393, Jan. 2007, https://doi.org/10.1016/j.dsp.2006.04.006
-
F. Chaari, W. Baccar, M. S. Abbes, and M. Haddar, “Effect of spalling or tooth breakage on gearmesh stiffness and dynamic response of a one-stage spur gear transmission,” European Journal of Mechanics – A/Solids, Vol. 27, No. 4, pp. 691–705, Jul. 2008, https://doi.org/10.1016/j.euromechsol.2007.11.005
-
Z. Chen and Y. Shao, “Mesh stiffness calculation of a spur gear pair with tooth profile modification and tooth root crack,” Mechanism and Machine Theory, Vol. 62, pp. 63–74, Apr. 2013, https://doi.org/10.1016/j.mechmachtheory.2012.10.012
About this article

