Abstract
The geological effects of rock blasting in silt-rock strata are complex, and the vibrations caused by the blasting threaten the safety of inhabitable areas. Based on measured data for the vibrations at the site and dynamic finite element simulations, the propagation characteristics of vibrations in silt-rock strata were studied. The propagation of the vibrations of the surface, the propagation characteristics of the vertical vibration velocities from the surface to the tunnel, and the attenuation of the blasting vibrations along the tunnel’s axis were analyzed. The results of this study are as followings: in the direction of the tunnel’s axis and in the direction vertical to the tunnel’s axis, the peak particle velocities (PPVs) of the surface decreases with increasing horizontal distance from the explosion source. The magnitudes of the PPVs of the surface under five working conditions are the same when the surface particle is right above the center of the explosion source and 10 m away from the center. In the vertical direction from the surface to the explosion source, the vertical direction of the silt-rock strata and the vertical direction of the silt stratum, the PPVs increases gradually with the increasing distance from the surface in the vertical direction. The change in the thickness of the artificial fill and silt in the shield interval strata has little effect on the PPVs along the tunnel’s axis. The results of this study provide a reference for identifying the safety distance around the inhabitable areas of rock blasting under similar geological conditions.
1. Introduction
With the fast economic growth in China, the demand for urban underground space engineering is growing rapidly. In 2020, 33 cities had 177 subway lines in China [1]. In the construction of metro-tunnels using the shield method, mixed strata are often encountered within the tunnel’s cross-section, such as in the Guangzhou Metro Line 7 [2], the 2.3-km-long C line and the 4-km-long S line of the Oporto Metro [3], the Tabriz metro line 1 [4], the Kranji tunnel in Singapore [5], the Shenzhen Metro Line 11 [6], the Xiamen Metro Line 2 [7], the power tunnel in Shenzhen [8], and the Fuzhou Metro Line 6 [9]. When the shield machine bores through silt-rock strata, the rock stratum in the lower part of the cross-section is too hard to bore, while the silt stratum in the upper part of the cross-section easily enters the soil chamber, especially for silt stratum that is rich in groundwater. When the soil pressure in the sealed soil chamber is unbalanced, soil loss, large amounts of settlement and collapse accidents easily occur. Many scientists have attempted to solve this problem [6-7]. They concluded that if the rock stratum is blasted into blocks in advance, with a maximum diameter of the blocks is less than 30 cm, then the blocks can smoothly enter the soil chamber through the opening of the tunnel boring machine’s (TBM) cutter head and can finally be discharged through the screw conveyor. However, the vibrations caused by the blasting will inevitably affect the surrounding environment. The geological effects of rock blasting in silt-rock strata are complex. Many researchers have studied the propagation characteristics of vibrations passing through different strata. For example, R. Nategh [10] studied the attenuation of PPVs on the surface for different types of explosives, detonators, and rocks. Y. L. Gui et al. [11] researched the propagation of blasting vibrations in rock stratum and rock-soil strata through field tests and finite element simulations. U. Ozer [12] fitted the PPVs and the distance from the explosion source under different rocks. Y. K. Wu et al. [13] investigated the propagation of blast waves under different joint strike angles. Z. L. Wang et al. [14] studied the propagation of blast waves in a rock plate and rock wall through numerical simulations. X. B. Zhao et al. [15] simulated the propagation of P-waves in multiple nonlinear deformation fractures using the universal distinct element code (UDEC). B.C. Lin et al. [16] studied the attenuation of blast waves near the interface between a soil stratum and rock stratum through numerical simulations. Z. T. Li et al. [17] researched the vibration response and cavity effect of the surrounding rock under a blasting load in upper-soft and lower-hard strata through numerical simulations. Based on previous research in China and abroad, few studies have been conducted on the propagation characteristics of vibrations caused by rock blasting in silt-rock strata.
In this study, based on the rock blasting engineering in the silt-rock strata of the shield section of the Zhuhai metro line, the propagation of vibrations of the surface, the propagation of vibrations from the shield section to the surface, and the attenuation of the vibrations along the tunnel’s axis were investigated using a combination of field tests and finite element numerical simulations. The conclusions of this study provide a reference for determining the safety distance around the blast area of rock blasting under similar geological conditions.
2. Geological conditions and blasting vibration tests
2.1. Geological conditions and blasting parameters
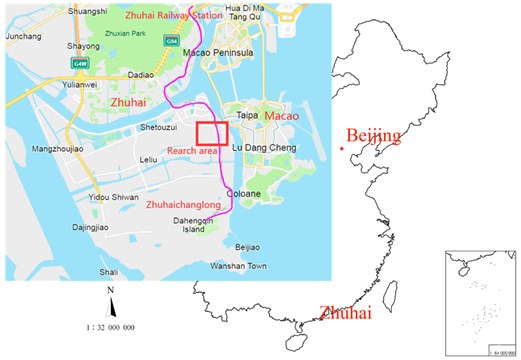
The shield section between Hengqinbei Railway Station and Hengqin Railway Station on the Zhuhai-Zhuhai Airport Intercity Railway is located in the economic development zone of Hengqin Island, Zhuhai City (Fig. 1). It runs along the coastline of the South China Sea, with a total length of 2.656 km.
Fig. 1Layout of the Zhuhai-Zhuhai Airport Intercity Railway
Because the shield section passes through the silt-rock strata, the rock stratum in the tunnel section has to be blasted into blocks in advance, and the maximum diameter of the blocks should be less than 30 cm after breaking so that the blocks can smoothly enter the soil chamber through the opening of the cutter head, and can finally be discharged through the screw machine. A diagram of the charging at the blast site is shown in Fig. 2, Rock cores obtained before blasting and after blasting are shown in Fig. 3.
Fig. 2Diagram showing the charging at the blast site
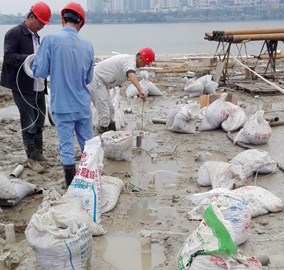
Fig. 3Rock cores obtained before blasting and after blasting
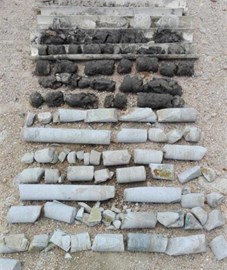
a) Rock cores obtained before blasting
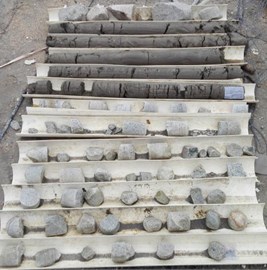
b) Rock cores obtained after blasting
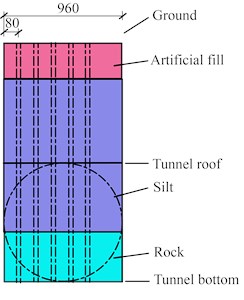
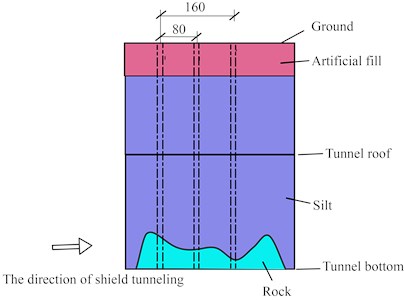
The blast area was located in the reclamation area, there were three strata from the ground surface to the subway tunnel. (1) The first stratum was composed of artificial fill. It was yellowish brown, slightly wet, mainly in a saturated loose state, slightly compacted, and was mostly composed of pavement concrete with a thickness of 20-35 cm. The thickness of this stratum was 0.30-15.10 m, with an average thickness of 2.82 m. (2) The second stratum was composed of silt. It was gray to dark gray, saturated, in a flowing plastic state, was composed of uniform and fine soil, and was locally enriched with shell debris and sand. The thickness of this stratum was 0.50-30.30 m. (3) The third stratum was composed of weakly weathered granitic rock. It was brown yellow, gray brown, and gray white, medium-coarse grained, and had a massive structure. The joint fissures were relatively well developed. The rock quality was hard. The burial depth of the stratum fluctuated greatly, and the distribution was discontinuous.
The length of the blast area was 960 cm and the width of the blast area was 160 cm. The casing while drilling method was used to drill the blastholes. Polyvinyl chloride (PVC) casing with a diameter of 7.5 cm was used to protect the blasthole wall and was installed immediately after the blasthole was drilled. The spacing and the row spacing of the blastholes were both 80 cm, the diameter of the blastholes was 14.6 cm, and the depth of the blastholes was 3400 cm. Three rows of blastholes were detonated each time, 13 blastholes were arranged in a row, and a millisecond blasting network was adopted in the blasthole. The millisecond sections of the three rows of blastholes were 6, 7 and 8 sections in turn, and the delay time was 50 ms. The layout of the blastholes is shown in Fig. 4.
After drilling the blastholes, the blastholes were immediately filled with underground water, and they were water-couple charged. The diameter of the explosive roll was 6 cm, and the density of the explosive was 1 061 kg/m3. The continuous charge scheme was adopted, the charge length was the thickness of the rock stratum at the tunnel section, and the thickness of the rock to be blasted was 1-8 m. The blastholes were stemmed with 1-1.5-cm-diameter gravel, and the length of the stemming was 10 m.
Fig. 4Sketch map of the blastholes (cm)
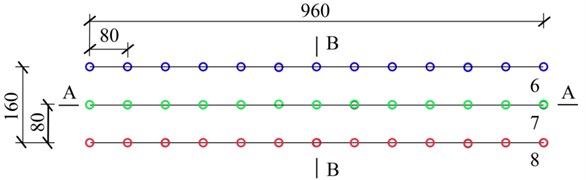
a) Planar graph
b) Cross section of A-A
c) Cross section of B-B
2.2. Test points of blasting vibrations
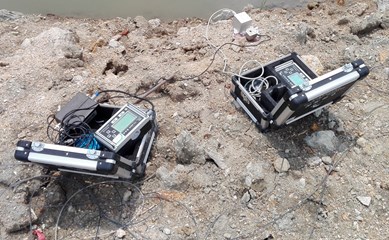
The TC-4850 self-recording instrument (Zhongke (Chengdu) Instruments Company Limited) was used to measure the blasting vibrations during the blasting. Each instrument had three channels and the collection was conducted in parallel. The arrangement of the blasting vibration meters is shown in Fig. 5.
Fig. 5Arrangement of blasting vibration meters
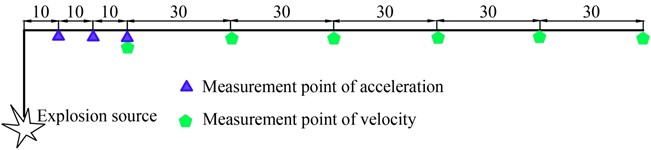
Three acceleration measuring points and six velocity measuring points were arranged in total. The measuring points were arranged along the ray with the explosion source as the center. A schematic diagram of the explosion source and measuring points is shown in Fig. 6.
Fig. 6Schematic diagram showing the explosion source and measuring points (m)
3. Numerical model and verification
The physical and mechanical properties of the materials involved in blasting engineering were verified through field tests and dynamic finite element simulations, which provided the parameters for the numerical simulations in the following section.
3.1. Calculation model and boundary conditions
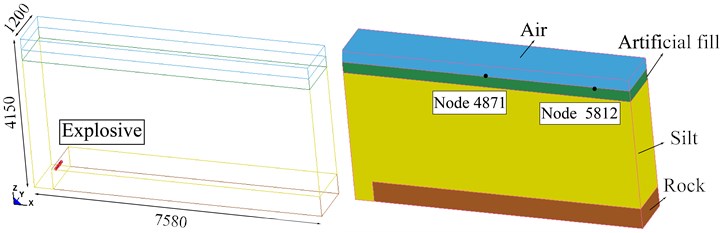
In order to analyze and verify the physical and mechanical properties of the explosive, silt, rock, etc during the actual blasting engineering, a numerical model of the rock blasting of the silt-rock strata were established. Since the model was symmetric, a half model was established to simulate the computation. The model is shown in Fig. 7.
According to the characteristics of the blasthole layout, the model was established using the maximum charge in one section. Since the radius of the crushing zone was between 10 and 15 times of the radius of the charge, the distance between the model boundary and the center line of the blasthole needed to be greater than 15 times of the radius of the blasthole [18], but if the model is larger, the calculation time is longer. Considering these factors comprehensively, a cube model was established with a length of 7 580 cm ( direction), a width of 1 200 cm ( direction), and a height of 4 150 cm ( direction).
The blastholes were arranged in the left part of the model, 500 cm away from the left free surface. The blasthole radius was 7.3 cm. Because the blasthole radius was too small relative to the model size, it was easy to produce an abnormal grid; so, the equivalent charge was established to enlarge the blasthole radius to 30 cm [19]. The height of blastholes was 50 cm, the number of blastholes was six, and the spacing was 80 cm. The height of the charging was 50 cm, the height of the rock stratum was 550 cm, and the height of the silt stratum was 3 000 cm. The height of the artificial fill stratum was 300 cm and the height of the air was 300 cm.
Fig. 7Calculation model of rock blasting in silt-rock strata(cm)
According to the characteristics of the rock blasting of the silt-rock strata, the boundary conditions of the calculation model were set as follows: the front face of the model was a symmetric boundary, the upper surface was a free boundary, and the other surfaces were non-reflecting boundaries. The length of the element should be less than 1/10-1/8 of the length of the explosive shock wave [20], but the calculation time is too long if the mesh is too small. Considering these factors comprehensively, the maximum length of the element was set to 1 m. The entire model was divided into 34 290 nodes and 30 272 elements. The ALE grid was used to divide the explosive element and the air element; and the Lagrange grid was used to divide the rock element, the silt element, and the artificial fill element. A fluid-solid coupling algorithm was used to define the connection between the ALE grid element and the Lagrange grid element, and the cm-g-μs unit system was adopted.
3.2. Numerical model and parameters of material
The materials in the numerical model included the explosive, rock, silt, artificial fill and air. The No. 2 rock emulsion explosive was used in the engineering, and the highly explosive material *MAT_HIGH_EXPLOSIVE_BURN in the ANSYS/LS-DYNA software was used to simulate it [21, 22]. The rock was weakly weathered granite, and *MAT_PLASTIC_KINEMATIC was selected to simulate it [23, 24]. The silt was an ideal incompressible fluid, and the viscous effect could be ignored. The *MAT_PLASTIC_KINEMATIC was also used to simulate the silt [25]; The artificial fill was simulated using *MAT_DRUCKER_PRAGER [12]. The air was simulated using *MAT_NULL [26]. The physical and mechanical properties of the explosive, rock, silt [27], artificial fill [28], and air were obtained through field tests and laboratory tests (Table 1-5).
Table 1Physical and mechanical properties of the explosive
Density (g.cm-3) | Detonation velocity (cm.μs-1) | (GPa) | (GPa) | (GPa) | |||
1.06 | 0.5 | 216.4 | 0.182 | 4.2 | 0.9 | 0.15 | 4.192 |
In the calculations, the equation of state of the detonation of the explosive material could be described by the Jones-Wilkins-Lee (JWL) equation:
where is the pressure determined by the JWL equation of state; , , , , and are material constants related to the explosive; is the relative volume; and is the initial specific internal energy.
According to G. Zhao’s experimental results on the decrease in the detonation velocity of common industrial emulsion explosives under water pressure in deep water [29], the relationship between the detonation velocity of the emulsion explosive and the water depth can be obtained. Then, the relationship between the detonation pressure and the water depth can be obtained by combining the relationship (Eq. (2)) between the detonation pressure, explosive density, and detonation velocity, which are presented in Table 2:
where is the average initial detonation pressure of the explosive (GPa); is the density of the explosive (kg/m3); is the detonation velocity of the explosive (m/s); and is the isentropic index of the explosive. The isentropic index of the general industrial explosive is 3.
In the numerical model, the height of the charging was 0.5 m and the charging was located at a water depth of 34 m; so, the detonation velocity of the explosive was 2 733 m/s, and the detonation pressure of the explosive was 1.98 GPa.
The null material model was adopted for the air, which satisfied the Gruneisen equation of state:
where is the intercept of the shear-compression wave velocity curve; is the pressure; is the initial specific internal energy; ; is the density of the material; and , and are the slope factors of the shear-compression wave velocity curve; is the Uneisen constant; is the initial volume correction factor; and is the initial density of the material.
Table 2Relationship between the detonation velocity of the explosive D, the detonation pressure of the explosive PCJ and the water depth h0
Water depth (m) | 0 | 26 | 27 | 28 | 29 | 30 | 31 | 32 | 33 | 34 |
Detonation velocity (m/s) | 5000 | 3267 | 3200 | 3133 | 3067 | 3000 | 2933 | 2867 | 2800 | 2733 |
Detonation pressure of explosive (GPa) | 6.63 | 2.83 | 2.72 | 2.60 | 2.50 | 2.39 | 2.28 | 2.18 | 2.08 | 1.98 |
Table 3Physical and mechanical properties of the rock and silt
Density (g·cm-3) | Elastic modulus (GPa) | Poisson’s ratio u | P-wave velocity (m/s) | Yield strength (MPa) | ETAN (GPa) | BETA | Strain rate parameter C | |
Rock | 2.5 | 0.74 | 0.25 | 5357 | 3.0e-5 | 0.042 | 1.0 | 0.06 |
Silt | 1.63 | 3.3e-5 | 0.45 | 1250 | 4.0e-9 | 0.0 | – | – |
Table 4Physical and mechanical properties of the air
(g·cm-3) | (m·s-1) | (GPa) | ||||||
Air | 1.29E-03 | 344 | 0 | 0 | 0 | 1.40 | 0 | 0 |
Table 5Physical and mechanical properties of the artificial fill
Density (g/cm3) | Poisson’s ratio | Cohesion (KPa) | Shear modulus (MPa) | Angle of internal friction (rad) |
1.98 | 0.35 | 100 | 150 | 0.31 |
3.3. Reliability analysis of numerical simulation
The vibrations of the ground surface were tested at the blasting sites, and the monitoring points #1 and #2 were located at 30 m and 60 m to the right of the explosion source. The location of the numerical simulation points is shown in Fig. 5. The results of numerical calculations and field tests were listed in Table 6. The results show that the data are close, and the errors are between 5.88 % and 19.64 %. Therefore, it is feasible to study the propagation characteristics of rock blasting in silt-rock strata using the numerical calculation model and parameters.
Table 6Comparison of PPVs at each monitoring point
Monitoring point | #1 (4871) | #2 (5812) | ||
X | Y | X | Y | |
Field tests (cm/s) | 2.13 | 0.68 | 0.56 | 0.68 |
Numerical calculations (cm/s) | 1.76 | 0.64 | 0.45 | 0.56 |
Error rate (%) | 17.37 | 5.88 | 19.64 | 17.65 |
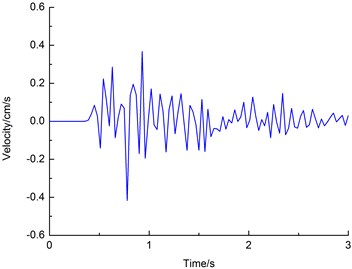
Fig. 8 shows the measured horizontal () vibration velocity waveforms of monitoring point #2, and Fig. 9 shows the simulated waveform of the corresponding points.
Fig. 8Measured horizontal transverse velocity (X) of waveform at measuring point #2
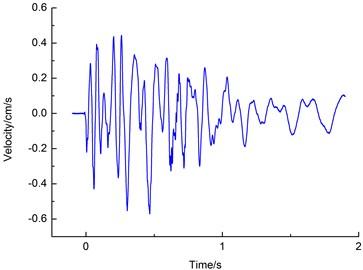
Fig. 9Simulated horizontal transverse velocity (X) of waveform at measuring point #2
4. Numerical calculation model
4.1. Numerical model
There are a large number of land reclamation areas in the world including in Hong Kong, Singapore, the Netherlands, Japan, and much of the coastlines of mainland China [30]. The thickness of the silt stratum and the thickness of the artificial fill are different in these areas. In order to research the propagation characteristics of blasting vibrations in silt-rock strata, a numerical model (Fig. 10) was established. Due to the symmetry of the model, a half model was established to simplify the computation. The model was cubic, with a length of 8 080 cm ( direction), a width of 4 600 cm ( direction) and a height of 4 150 cm ( direction). The height of the blasthole, the spacing of the blasthole, the height of the rock, and the height of the air were consistent with the model parameters described in Section 3. By modifying the key words of the K file in ANSYS/LS-DYNA, the thickness of the silt stratum and the thickness of the artificial fill were varied. The five different thicknesses of silt and artificial fill are listed in Table 7.
Fig. 10Numerical calculation model of rock blasting in silt-rock strata (cm)
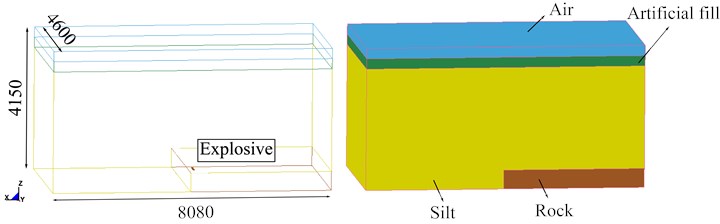
Table 7Five different thicknesses of silt and artificial fill
Working condition 1 | Working condition 2 | Working condition 3 | Working condition 4 | Working condition 5 | |
Thickness of artificial fill (m) | 3 | 9 | 15 | 21 | 27 |
Thickness of silt (m) | 30 | 24 | 18 | 12 | 6 |
4.2. Boundary conditions and material parameters
The boundary conditions of the model were set as follows: the front surface of the model was a symmetric boundary, the upper surface was a free boundary, and the other surfaces were non-reflecting boundaries. One hundred and sixty-four 3-D solid elements were used for the mesh generation. The entire model was divided into 173 700 nodes and 164 384 elements. The ALE grid was used to divide the elements of the explosive and air, and a Lagrange grid was used to divide the elements of the rock, silt, and artificial fill. A fluid-solid coupling algorithm was used to define the connection between the ALE grid elements and the Lagrange mesh elements, and a cm-g-μs unit system was adopted. The material models and parameters were verified through field tests and laboratory experiments (see Section 3).
5. Analysis of calculation results
5.1. Propagation of vibration velocity on the surface
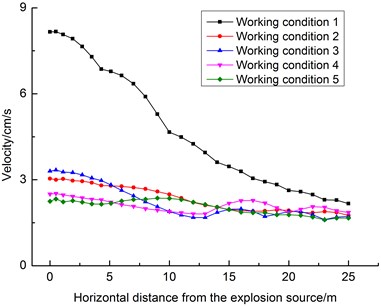
5.1.1. Propagation of vibration velocity along the tunnel’s axis on the surface
Taking the particle in the surface directly above the center of the explosion source as the origin, monitoring points were arranged outwards on sides of the tunnel’s axis on the surface. The PPVs of the vector superposition are shown in Fig. 11. In Fig. 11, the negative axis of the coordinate axis is the silt stratum, and the positive axis of the coordinate axis is the silt-rock strata.
It can be seen from Fig. 11 that the PPVs of the vector superposition exhibit increased attenuation trend with increasing horizontal distance from the explosion source under the five sets of working conditions, among which the attenuation speed of the PPVs is the fastest under working condition 1, and the attenuation speed of the PPVs is relatively slow under the other four sets of working conditions. The PPVs are larger under working condition 1 than under the other four sets of working conditions. Within in the range of –6 to 6 m from the explosion source, the PPVs under working condition 3 are greater than those under working condition 2, followed by working condition 4, and those under working condition 5 are the smallest.
The PPVs under working condition 1 increase from –4 to –7 m, from –13 to –15 m, from –16 to –18 m, from 9 to 11 m and from 15 to 17 m away from the explosion source. The PPVs under working condition 2 increases from –11 to –15 m, from –16 to –19 m, from 13 to 15 m and from 18 to 20 m away from the explosion source. The PPVs under working condition 3 increases from –12 to –17 m, from –18 to –20 m, from 12 to 16 m and from 19 to 21 m away from the explosion source. The PPVs under working condition 4 increases from –13 m to –17 m and from 12 m to 17 m from the explosion source. The PPVs under working condition 5 increases from –7 to –11 m, from –15 to –18 m, and from 8 to 12 m from the explosion source.
Fig. 11PPVs along the tunnel’s axis on the surface
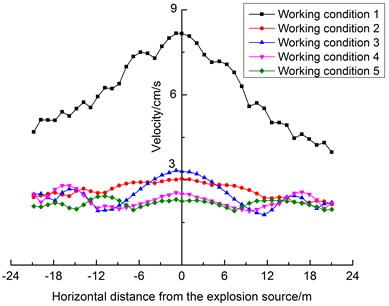
Fig. 12Velocity propagation of surface vibrations vertical to the tunnel’s axis
5.1.2. Propagation of velocity of surface vibrations vertical to the tunnel’s axis
Taking the surface particle directly above the center of the explosion source as the origin, the monitoring points were arranged in the direction of the surface vertical to the tunnel’s axis, and the vector superposition of each of the PPVs is shown in Fig. 12.
It can be seen from Fig. 12 that the PPVs of the vector superposition of the surface exhibit increasing attenuation with increasing horizontal distance from the explosion source under the five sets of working conditions, among which the attenuation speed of the PPVs under working condition 1 is the fastest, and the attenuation speeds of the PPVs under the other four working conditions are relatively slow. The PPVs under working condition 1 are larger than those under the other four sets of working conditions. Within in the range of 0–6 m from the explosion source, the PPVs under working condition 3 are larger than those under working condition 2, followed by working condition 4, and those under working condition 5 are the smallest. The PPVs under the five sets of working conditions tend to be similar at distances of greater than 23 m from the explosion source.
The PPVs under working condition 2 increase from 18 to 20 m. The PPVs under working condition 3 increases from 13 to 16 m and from 18 to 20 m. The PPVs under working condition 4 increases from 14 to 17 m and from 20 to 22 m. The PPVs under working condition 5 increases from 8 to 12 m.
5.1.3. Comparison of vibration velocity at equal horizontal distance from explosion source in surface
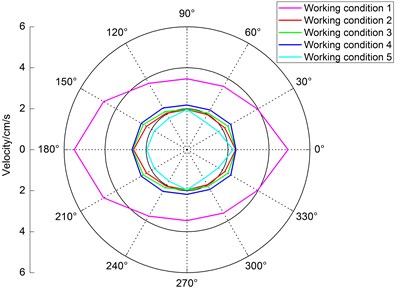
Because the model is symmetrical about the tunnel’s axis, only the PPVs between 0° and 180° of the tunnel’s axis on the silt-rock strata side are discussed. Taking the surface particle directly above the explosion source as the center, the radius was 10 m, the central axis of the tunnel on the silt-rock strata side was a 0° line, and the monitoring points were arranged by rotating 30° counterclockwise. The vector superposition of the peak velocity of each particle is shown in Fig. 13.
It can be seen from Fig. 13 that the magnitudes of the PPVs of the surface 10 m from the center of the circle under the five sets of working conditions are the same, but the values are different. The PPVs under working condition 1 are the largest, and the PPVs under the other four sets of working conditions are similar. The largest PPV occurs at 180° to the tunnel’s axis on the silt-rock strata side, the second largest PPV occurs at 150°, and the smallest PPV occurs at 90° under working condition 1. There is little difference on the silt-rock strata side of the tunnel’s axis at different angles under working condition 2. Under working condition 3, the largest PPV occurs at 180° to the tunnel’s axis on the silt-rock strata side, followed by those at 0° and 150°, and the smallest PPV occurs at 60°. Under working condition 4, the largest PPV occurs at 180° to the tunnel’s axis on the silt-rock strata side, followed by those at 0° and 150°, and the smallest PPV occurs at 60°. Under working condition 5, the largest PPV occurs at 180° to the tunnel’s axis on the silt-rock strata side, followed by that at 90°, and the smallest PPV occurs at 60°.
Taking the surface particle directly above the explosion source as the center, the radius was 15 m, the central axis of the tunnel on the silt-rock strata side was a 0° line, and the monitoring points were arranged by rotating 30° counterclockwise. The vector superposition of the peak velocity of each particle is shown in Fig. 14.
It can be seen from Fig. 14 that the magnitudes of the PPVs of the surface 10 m from the center of the circle under the five sets of working conditions are the same, but the values are different. The PPVs under working condition 1 are the largest, and the PPVs under the other four sets of working conditions are similar. Under working condition 1, the largest PPV occurs at 180° to the tunnel’s axis on the silt-rock strata side, the second largest PPV occurs at 0°, and the smallest PPV occurs at 90°. Under working condition 2, the largest PPV occurs at 180° to the tunnel’s axis on the silt-rock strata side, the second largest PPV occurs at 0°, and the smallest PPV occurs at 90°. Under working condition 3, the largest PPV occurs at 180° to the tunnel’s axis on the silt-rock strata side, the second largest PPV occurs at 150°, and the smallest PPV occurs at 90°. Under working condition 4, the largest PPV occurs at 180° to the tunnel’s axis on the silt-rock strata side, the second largest PPV occurs at 150°, and the smallest PPV occurs at 90°, Under working condition 5, the largest PPV occurs at 0° to the tunnel’s axis on the silt-rock strata side, the second largest PPV occurs at 180°, and the smallest PPV occurs at 60°.
Fig. 13Comparison of vibration velocity 10 m away from the explosion source in the surface
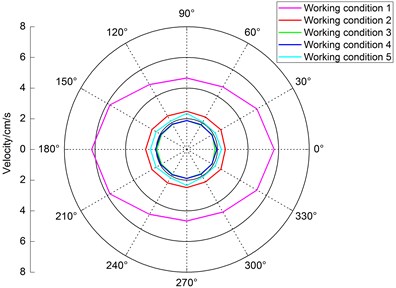
Fig. 14Comparison of the vibration velocity 15 m away from the explosion source in the surface
5.2. Propagation characteristics of the vibration velocity of the surface along the vertical direction of the tunnel
5.2.1. Propagation characteristics of the vibration velocity of the surface along the vertical direction from the explosion source
There are numerous pipelines and building foundations underground, so, it is of great engineering significance to study the vibration propagation characteristics of the blasting shock wave in the vertical direction from the center of explosion source. Taking the surface particle directly above the center of the explosion source as the origin, the monitoring points were arranged in the direction perpendicular to the surface in the form of rays from the explosion source, and the vector superposition of each PPV is shown in Fig. 15.
It can be seen from Fig. 15 that the PPVs increase with increasing vertical distance from the surface. The PPVs under working condition 1 are the largest and those under the other four sets of working conditions are basically the same within 0–3 m from the surface in the vertical direction. The PPVs under the five sets of working conditions are basically the same within 30-33 m from the surface in the vertical direction.
The PPVs under working conditions 1, 2, 3, 4, and 5 suddenly increase after vertical distances of 3, 9, 15, 21, and 27 m from the ground, respectively. The PPVs decrease within 2-3 m from the explosion source in the vertical direction and then increase slowly with decreasing distance from the explosion source in the vertical direction.
5.2.2. Propagation of vibration velocity in the vertical direction in the silt-rock strata
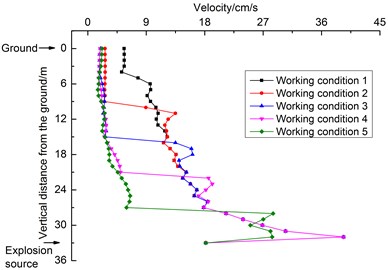
According to the distance between the surface particle 10 m directly above the explosion source in the silt-rock strata on the tunnel side, the monitoring points were arranged in the direction perpendicular to the surface in a radial sequence from the explosion source. The vector superposition of the peak velocity of each particle is shown in Fig. 14.
It can be seen from Fig. 16 that the PPVs increases with increasing distance from the surface in the vertical direction. The PPVs under working condition 1 are the largest and those under the other four sets of working conditions are basically the same within 0-3 m from the surface in the vertical direction. The PPVs under working conditions 1-4 are basically the same and are slightly larger than those under working condition 5 within 30-33 m from the surface in the vertical distance.
The PPVs under working conditions 1, 2, 3, 4, and 5 suddenly increase after vertical distances of 3, 9, 15, 21, and 27 m from the ground, respectively. The PPVs decrease within 3-4 m from the explosion source in the vertical direction, and then, they increase slowly with decreasing distance from the explosion source in the vertical direction.
Fig. 15Propagation of vibration velocity of the surface from the explosion source in the vertical direction
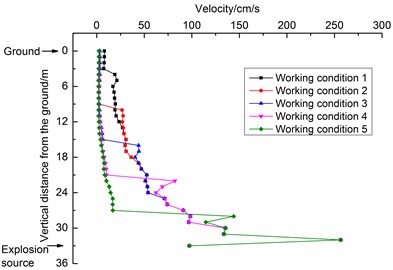
Fig. 16Propagation of vibration velocity in the vertical direction on the silt-rock strata side
5.2.3. Propagation characteristics of vibration velocity in the vertical direction in the silt stratum
According to the distance between the surface particle 10 m directly above the explosion source of the silt stratum on the tunnel side, the monitoring points were arranged in the direction perpendicular to the surface in a radial sequence from the explosion source. The vector superposition of the peak velocity of each particle is shown in Fig. 17.
It can be seen from Fig. 17 that the PPVs increase with increasing distance from the surface in the vertical direction. The PPVs under working condition 1 are the largest and those under the other four sets of working conditions are basically the same within 0-3 m from the surface in the vertical direction. The PPVs under working conditions 1-4 m are basically the same, and are slightly larger than those under working condition 5 within 30-33 m from the surface in the vertical direction.
The PPVs under working conditions 1, 2, 3, 4, and 5 suddenly increase after vertical distances of 3, 9, 25, 21, and 27 m from the ground, respectively. The PPVs decrease within 2-4 m from the explosion source in the vertical direction, and then, they increase slowly with decreasing distance from the explosion source in the vertical direction.
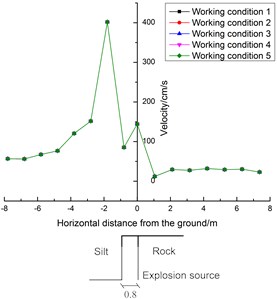
5.3. Attenuation of blasting vibrations in the direction along the tunnel’s axis
Taking the center of the explosion source as the origin, the monitoring points were arranged in the direction along the tunnel’s axis on both sides of the tunnel in the form of rays, and the vector superposition of the peak velocity of each particle is shown in Fig. 18. In Fig. 18, the direction of the negative axis of the coordinate axis is the silt stratum, and the direction of the positive axis of the coordinate axis is the silt-rock strata.
It can be seen from Fig. 18 that the attenuation of the PPVs is basically the same under the five sets of working conditions, which indicates that the change in the thicknesses of the artificial fill and silt in the shield interval strata has little effect on the PPVs along the tunnel’s axis. As the horizontal distance from the explosion source increases, the PPVs basically exhibit increased attenuation. The PPVs increase suddenly at −1.8 m from the blasting source (i.e., at –1 m from the vertical interface between the silt and rock) and then decrease sharply.
Fig. 17Propagation of vibration velocity in the vertical direction in the silt stratum
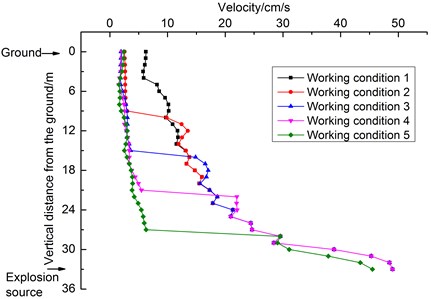
Fig. 18Attenuation of blasting vibrations in the direction along the tunnel’s axis
6. Discussions
The propagation characteristics of the vibrations caused by the rock blasting in the silt-rock strata were analyzed using a combination of field tests and simulations. The following discussions were obtained.
1) According to the propagation of the vibration velocity of the surface, the thickness of the artificial fill under working condition 1 is 3 m. The explosion shock waves reflect and transmit constantly at the interface between the silt and artificial fill and the interface between the artificial fill and air. The reflected shock waves overlap with the incident shock waves, resulting in the PPVs under working condition 1 being much larger than those under the other four sets of working conditions. The thicknesses of the artificial fill under working conditions 2, 3, and 4 are greater than 9 m, and the superposition of the reflected shock waves and the incident shock waves is weak. The explosion shock wave is reflected when it reaches the interface between the artificial fill and air. The superposition of the reflected shock wave and the incident shock wave leads to an increased peak velocity of some of the particles and a decrease of the peak velocity of other particles.
2) According to the propagation characteristics of the vibration velocity from the ground along the direction vertical to the tunnel, the explosion shock wave is reflected and transmitted when it passes through the interface between the silt and artificial fill. The superposition of the reflected shock wave and the incident shock wave causes the peak velocity to increase suddenly. The influence in the vertical direction from the center of the explosion source on the peak velocity occurs 2-4 m from the interface between the silt and artificial fill.
3) According to the attenuation of the blasting vibrations in the direction along the tunnel’s axis, the PPVs transmitted from the rock into the silt stress wave will increase sharply because the density and P-wave velocity of the silt are smaller than those of the rock. The PPVs decay rapidly in the silt-rock strata 1-2 m away from the interface between the silt and rock in the vertical direction, and then they slow down. The PPVs decay rapidly at a distance of 1-4 m from the interface between the silt and rock in the silt stratum in the vertical direction, and then they slow down. At the same horizontal distance from the center of the explosion source, the PPVs are greater in the silt stratum than in the silt -rock strata.
4) The theoretical analysis of the propagation of P waves, SV waves, and SH waves in the rock, silt, and artificial fill; the transmission and reflection of P waves, SV waves, and SH waves at the geological interface; and the propagation of Rayleigh waves, Love waves, and Stoneley waves will be discussed in our next paper.
7. Conclusions
The propagation characteristics of vibrations caused by rock blasting in silt-rock strata were analyzed using a combination of field tests and simulations. The following results were obtained.
1) In the directions along the tunnel’s axis and vertical to the tunnel’s axis, the PPVs of the surface decrease with increasing horizontal distance from the explosion source. The PPVs are larger under in working condition 1 than under the other four sets of working conditions, and the decrease in the speed is the fastest. Under working condition 1, it is necessary to strengthen the field tests of blasting vibrations.
2) For the surface particle right above the center of the explosion source and 10 m away from the center, the magnitudes of the PPVs of the surface under the five sets of working conditions are the same. The maximum number of times occurs at 180° from the tunnel’s axis on the silt-rock side, and the minimum number of times occurs at 60° from the tunnel’s axis on the silt-rock side. At 15 m away from the center, the magnitudes of the PPVs of the surface under the five sets of working conditions are the same too. The maximum number of times occurs at 180° from the tunnel’s axis on the silt-rock side, and the minimum number of times occurs at 90° from the tunnel’s axis on the silt-rock side; so the focus should be on 180° from the tunnel’s axis on the silt-rock side. This provides a basis for safety protection of surface buildings.
3) In the vertical direction from the surface to the explosion source, in the vertical direction in the silt-rock strata, and in the vertical direction in the silt stratum, the PPVs increases gradually with increasing vertical distance from the surface under the five sets of working conditions. This provides a basis for safety protection of buried pipelines.
4) The attenuation of the PPVs is basically the same along the tunnel’s axis under the five sets of working conditions, which indicates that the change in the thicknesses of the artificial fill and silt in the shield interval of strata has little effect on the PPVs along the tunnel’s axis. This provides a basis for the safety protection of the shield tunnel and the shield machine during construction.
References
-
Z.-L. Chen, J.-Y. Chen, H. Liu, and Z.-F. Zhang, “Present status and development trends of underground space in Chinese cities: Evaluation and analysis,” Tunnelling and Underground Space Technology, Vol. 71, pp. 253–270, Jan. 2018, https://doi.org/10.1016/j.tust.2017.08.027
-
D.-J. Ren, S.-L. Shen, W.-C. Cheng, N. Zhang, and Z.-F. Wang, “Geological formation and geo-hazards during subway construction in Guangzhou,” Environmental Earth Sciences, Vol. 75, No. 11, Jun. 2016, https://doi.org/10.1007/s12665-016-5710-6
-
S. Babendererde et al., “Geological risk in the use of TBMs in heterogeneous rock masses – The case of “Metro do Porto” and the measures adopted,” Course on Geotechnical Risks in Rock Tunnels, University of Aveiro, Portugal, 2004.
-
G. Barzegari, A. Uromeihy, and J. Zhao, “EPB tunneling challenges in bouldery ground: a new experience on the Tabriz metro line 1, Iran,” Bulletin of Engineering Geology and the Environment, Vol. 73, No. 2, pp. 429–440, May 2014, https://doi.org/10.1007/s10064-013-0490-7
-
J. Zhao, Q. M. Gong, and Z. Eisensten, “Tunnelling through a frequently changing and mixed ground: a case history in Singapore,” Tunnelling and Underground Space Technology, Vol. 22, No. 4, pp. 388–400, 2007.
-
L. Chong, “Study on construction technology of deep hole blasting pretreatment for shield passing through upper soft and lower hard strata,” (in Chinese), Technology and Market, Vol. 8, No. 8, pp. 32–35, 2015.
-
Z. Q. Wu, “Key construction technology of boulder and bedrock bulge treatment in cross sea shield tunnel,” (in Chinese), Jiangxi Building Materials, Vol. 3, No. 5, pp. 181–183, 2016.
-
Q. S. Luo and Z. S. Sang, “Study on Bedrock Pretreating Blast Construction Technology in Shield Section of Electric Power Tunnel,” Urban Roads Bridges and Flood Control, Vol. 12, pp. 154–158, 2020, https://doi.org/10.16799/j.cnki.csdqyfh.2020.12.042
-
Y. K. Qiu, “Study on Mechanism and Application of Artificial Surface in Bedrock Blasting of Shield Tunnel,” China University of Mining and Technology, 2020.
-
R. Nateghi, “Prediction of ground vibration level induced by blasting at different rock units,” International Journal of Rock Mechanics and Mining Sciences, Vol. 48, No. 6, pp. 899–908, 2011.
-
Y. Gui, Zhiye Zhao, L. B. Jayasinghe, H. Zhou, A. Goh, and M. Tao, “Blast wave induced spatial variation of ground vibration considering field geological conditions,” International Journal of Rock Mechanics and Mining Sciences, Vol. 101, pp. 63–68, 2018.
-
U. Ozer, “Environmental impacts of ground vibration induced by blasting at different rock units on the Kadikoy-Kartal metro tunnel,” Engineering Geology, Vol. 100, No. 1-2, pp. 82–90, Jun. 2008, https://doi.org/10.1016/j.enggeo.2008.03.006
-
Y. K. Wu, H. Hao, Y. X. Zhou, and K. Chong, “Propagation characteristics of blast-induced shock waves in a jointed rock mass,” Soil Dynamics and Earthquake Engineering, Vol. 17, No. 6, pp. 407–412, Aug. 1998, https://doi.org/10.1016/s0267-7261(98)00030-x
-
Z.-L. Wang, Y.-C. Li, and J. G. Wang, “Numerical analysis of blast-induced wave propagation and spalling damage in a rock plate,” International Journal of Rock Mechanics and Mining Sciences, Vol. 45, No. 4, pp. 600–608, Jun. 2008, https://doi.org/10.1016/j.ijrmms.2007.08.002
-
X. B. Zhao, J. Zhao, J. G. Cai, and A. M. Hefny, “UDEC modelling on wave propagation across fractured rock masses,” Computers and Geotechnics, Vol. 35, No. 1, pp. 97–104, Jan. 2008, https://doi.org/10.1016/j.compgeo.2007.01.001
-
B. C. Lin et al., “Study on the characteristics of surrounding rock vibration during tunnel blasting construction with soil-rock interlaced stratum,” (in Chinese), Highway Engineering, pp. 154–160, 2019.
-
Z. T. Li et al., “Analysis of vibration response and cavity effect of blasting construction of tunnel in soil-rock interlaced strata,” (in Chinese), Tunnel construction, Vol. 213, No. 4, pp. 70–75, 2018.
-
S. Esen, I. Onederra, and H. A. Bilgin, “Modelling the size of the crushed zone around a blasthole,” International Journal of Rock Mechanics and Mining Sciences, Vol. 40, No. 4, pp. 485–495, Jun. 2003, https://doi.org/10.1016/s1365-1609(03)00018-2
-
N. Jiang, “Study on Blasting Dynamic Characteristics of Open Pit to Underground Mining Slope,” (in Chinese), China University of Geosciences, 2013.
-
F. J. Serãn et al., “Finite-element method for elastic wave propagation,” Communications in Numerical Methods in Engineering, Vol. 6, No. 5, pp. 359–368, 2010.
-
E. Lee, M. Finger, and W. Collins, “JWL equation of state coefficients for high explosives,” Office of Scientific and Technical Information (OSTI), Jan. 1973.
-
“Livermore Software Technology Corporation (LSTC),” LS-DYNA Keyword User’s manual, Livermore, 2003.
-
C. B. Zhou, R. G. Gu, and X. D. Luo, “Numerical simulation on cutting mode of shaft excavation by one-step deep-hole blasting in hard rock,” (in Chinese), Chinese Journal of Rock Mechanics and Engineering, Vol. 13, pp. 100–105, 2005.
-
X. Ma, T. Sui, J. Shang, and D. Wang, “Response analysis of dot shield tunnels under internal explosion,” (in Chinese), Tongji Daxue Xuebao/Journal of Tongji University, Vol. 39, No. 7, pp. 983–988, Jul. 2011, https://doi.org/10.3969/j.issn.0253-374x.2011.07.008
-
J. Y. Qiao, H. Ding, and Z. M. Zheng, “Seaooze constitutive model for toe-shooting method,” (in Chinese), Engineering blasting, Vol. 9, No. 3, pp. 1–6, 2003.
-
D. Y. Shi, Y. C. Li, and S. M. Zhang, Explicit dynamic analysis based on ANSYS/LS-DYNA 8.1.1 edition. (in Chinese), Beijing: Press of Tsinghua University, pp. 199–214.
-
D. Shuttle and M. Jefferies, “Determining silt state from CPTu,” Geotechnical Research, Vol. 3, No. 3, pp. 90–118, Sep. 2016, https://doi.org/10.1680/jgere.16.00008
-
Y. Cao, D. Li, and Z. Li, “Random distribution of shear modulus of soils and interval estimation of ground vibration transfer function,” (in Chinese), Yanshilixue Yu Gongcheng Xuebao/Chinese Journal of Rock Mechanics and Engineering, Vol. 40, No. 5, pp. 1022–1031, May 2021, https://doi.org/10.13722/j.cnki.jrme.2020.0616
-
G. Zhao, “Study on technology of the cofferdam demolition blasting in deep water conditions,” (in Chinese), University of Science and Technology of China, 2008.
-
J. L. Stauber, A. Chariton, and S. Apte, “Global change,” in Marine Ecotoxicology, Elsevier, 2016, pp. 273–313, https://doi.org/10.1016/b978-0-12-803371-5.00010-2
About this article

The research was sponsored by the National Natural Science Foundation of China (Grant No. 41972286), the Fund for Talent Introduction, Anhui University of Science and Technology (No. 13190208), and the Program for Innovation Training (No. S202110361067). We thank LetPub (www.letpub.com) for its linguistic assistance during the preparation of this manuscript.
