Abstract
To ensure that large precision instruments and equipment are in the best working condition, it is necessary to provide a suitable working environment for them. At this time, there is a high requirement for the vibration of the foundation at the location. Measuring the foundation vibration parameters, analyzing the foundation vibration state, and taking necessary damping measures during the construction process to provide basis are the premise of equipment installation and normal work. Combined with an application example, this paper briefly introduces the general situation of a project blasting, and obtains the basic characteristic parameters such as the peak velocity of ground motion and the time of arrival during the blasting operation; Based on the basic principle of regression analysis, the relationship between the peak velocity and the distance between the detonation centers and the charge weight is obtained by fitting the Sadovsky formula.
1. Introduction
Large precision instruments and equipment (such as lasers, calibration and verification platforms, etc.) required highly for the vibration of the foundation at their locations. If the working environment of precision equipment vibrates violently, key components of the instrument may not work properly, resulting in inaccurate measurement results; It may even be damaged, affecting the service life of the instrument [1-2]. Measuring foundation vibration parameters, analyzing foundation vibration status, and taking necessary damping measures during construction can provide necessary data support for the proper environmental conditions for the normal operation of key instruments and equipment. According to the national standard “GB/T 14125-2008/ISO 8569:1996, Measurement and Evaluation of the Impact of Vibration and Impact on Sensitive Equipment in Buildings”, the peak value, spectrum distribution, dominant frequency, etc. of ground vibration parameters are the basic parameters for analyzing the vibration state. In recent years, in the analysis of ground vibration caused by blasting, more and more attention has been paid to the arrival time, peak value of the ground motion velocity (acceleration) signal [3-7].
Based on the measurement and analysis of ground motion signals in a blasting operation, the attenuation law and spectrum distribution law of ground motion velocity signals at different blast center distances are obtained. In blasting engineering, the attenuation law of blasting vibration is mainly reflected by the variation relationship between the peak vibration velocity of the medium particle and the charge amount and the distance between the blasting centers [8-11]. This rule is quantitatively described by the Sadovsky formula as follows:
where is the peak vibration velocity, (kg) is the explosive amount, (m) is the distance between the explosive centers, and is the coefficient and attenuation index related to the terrain and geological conditions between the explosive centers and the velocity measurement points.
2. Project overview
During the blasting operation of a certain project, it is required to conduct multiple monitoring of foundation vibration at certain points according to the design requirements. Set 1-6 # measuring points for ground motion velocity at a distance of 90, 120, 160, 180, 220, and 260 m from the explosion center, and arrange a 3-axis velocity sensor (radial, vertical, perpendicular to radial, and vertical) at each measuring point. The sensor is fixed to the on-site bedrock by adhesive method to ensure that the sensor and the foundation are in the same vibration state. Magnetoelectric speed sensors are used for measuring the speed of ground motion. The principle of a magnetoelectric speed sensor is to convert the measured speed into an induced electromotive force. The test adopts Jiangsu Donghua Dynamic Parameter Debugger, which has high integration, simple operation, multiple trigger modes, and corresponding data acquisition software for automatic data acquisition and storage. It can accurately collect the required speed signals in real time.
3. Measurement results and analysis
Select the motion velocity data of the two large explosive blasting operations A and B as the vibration analysis object. The explosive weights for the two blasts A and B are 180 and 230 kg TNT, respectively. Figs. 1-4 shows the waveform diagrams of measured radial and vertical velocity signals at 1~6 # measuring points in blasting operations A and B.
Fig. 1Radial velocity waveform of A
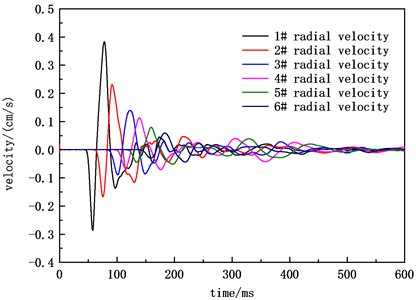
Fig. 2Radial velocity waveform of B
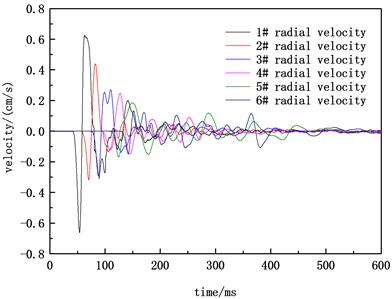
Fig. 3Vertical velocity waveform of A
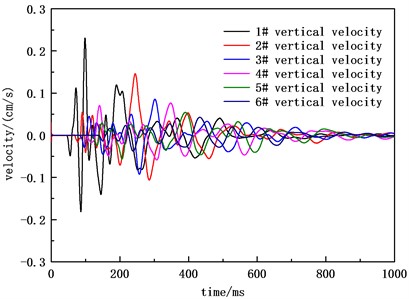
Fig. 4Vertical velocity waveform of B
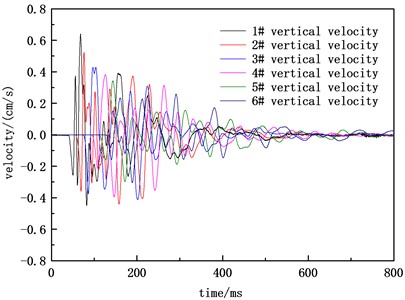
Table 1 and Table 2 show the peak arrival time and peak statistics of the two blasting ground motion velocities. In terms of single blasting data, the vertical and radial velocity peaks decrease with the increase of blast center distance. The arrival time of the radial velocity peak for A blasting is earlier than the arrival time of the vertical velocity peak, while the difference between the radial and vertical velocity arrival times for B blasting is not significant. Comparing the results of two blasting velocity measurements, it can be seen that at the same blasting center distance, the greater the charge amount, the greater the peak velocity, and the arrival time of the peak velocity for the second blasting is significantly earlier than the arrival time of the peak velocity for the second blasting. The radial velocity peak value and vertical velocity peak value of the 1 # measuring point with the smallest blast center distance in the A blasting were 0.383 and 0.231 cm/s, respectively. The radial velocity peak value and vertical velocity peak value of the 1 # measuring point with the smallest blast center distance in the B blasting were 0.663 and 0.640 cm/s, respectively. Based on the measured data and in combination with the instrument operating instructions, the impact of the vibration environment caused by blasting operations on the working state of the instrument and equipment can be specifically analyzed, so as to design reasonable shock absorption measures.
Table 1Peak speed and arrival time of A
Measure point | Distance from the explosion center / (m) | Measuring parameters | Arrival time / (ms) | Peak value / (cm/s) |
1 | 90 | Radial velocity | 78.0 | 0.383 |
Vertical velocity | 98.4 | 0.231 | ||
2 | 120 | Radial velocity | 91.3 | 0.231 |
Vertical velocity | 244.6 | 0.146 | ||
3 | 160 | Radial velocity | 122.4 | 0.139 |
Vertical velocity | 256.5 | -0.092 | ||
4 | 180 | Radial velocity | 138.8 | 0.113 |
Vertical velocity | 347.6 | 0.077 | ||
5 | 220 | Radial velocity | 159.2 | 0.080 |
Vertical velocity | 206.1 | -0.056 | ||
6 | 260 | Radial velocity | 182.9 | 0.059 |
Vertical velocity | 432.5 | 0.043 |
Table 2Peak speed and arrival time of B
Measure point | Distance from the explosion center / (m) | Measuring parameters | Arrival time / (ms) | Peak value / (cm/s) |
1 | 90 | radial velocity | 53.7 | –0.663 |
vertical velocity | 68.1 | 0.640 | ||
2 | 120 | radial velocity | 82.3 | 0.439 |
vertical velocity | 76.2 | 0.524 | ||
3 | 160 | radial velocity | 87.7 | –0.291 |
vertical velocity | 103.7 | 0.428 | ||
4 | 180 | radial velocity | 127.2 | 0.246 |
vertical velocity | 146.4 | –0.394 | ||
5 | 220 | radial velocity | 148.8 | 0.185 |
vertical velocity | 143.6 | 0.343 | ||
6 | 260 | radial velocity | 141.8 | –0.145 |
vertical velocity | 188.8 | –0.305 |
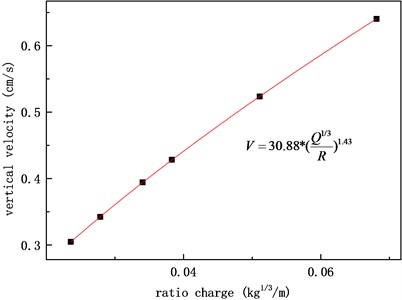
The relationship between the peak values of blasting velocities A and B, the distance between the blasting centers, and the charge amount is obtained by fitting the Sadovsky formula, as shown in Figs. 5-8.
From Figs. 5-8, it can be seen that the fitting consistency between the velocity peak value obtained during a single blasting operation and the charge amount and blast center distance is good using the Sadovsky formula. Due to the differences in charge amount, buried depth, ground motion propagation distance, path media, and other factors, the fitting formula varies greatly among different blasting operations. Prior to subsequent similar blasting operations, the magnitude of velocity peaks at different blast center distances can be estimated based on empirical formulas obtained, providing data support for evaluating the safety of facilities and equipment and designing reasonable shock absorption measures.
Fig. 5Radial velocity fitting of A
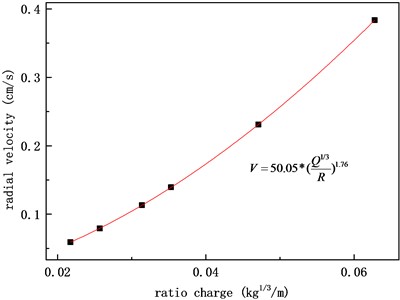
Fig. 6Vertical velocity fitting of A

Fig. 7Radial velocity fitting of B
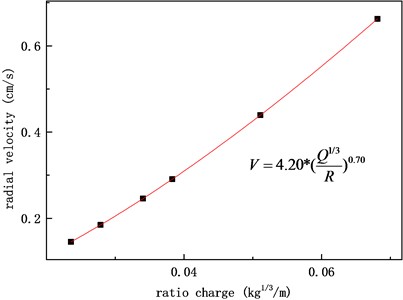
Fig. 8Vertical velocity fitting of B
4. Conclusions
The testing system and method used in this paper successfully obtained ground motion velocity data during blasting operations. The ground motion peak fitting formula obtained using the Sadovsky formula method can provide data support for carrying out subsequent similar operations and designing reasonable seismic mitigation measures.
References
-
W. Liu, D. Zhang, F. Zhong, S. Cheng, and Q. Zhang, “Quasi-static gas pressure formed by explosive explosion in spherical explosive container,” Explosion and Shock, Vol. 38, pp. 1045–1049, 2017.
-
D. H. Bultman, “Static-stress analysis of dual-axis confinement vessel,” Nasa Sti/recon Technical Report N, 1992.
-
C. E. Anderson, W. E. Baker, D. K. Wauters, and B. L. Morris, “Quasi-static pressure, duration, and impulse for explosions (e.g. HE) in structures,” International Journal of Mechanical Sciences, Vol. 25, No. 6, pp. 455–464, Jan. 1983, https://doi.org/10.1016/0020-7403(83)90059-0
-
J. R. Anthony and P. A. Foster, “Explosive containment study,” DE85011719, 1985.
-
P. Jin, W. Guo, J. Wang, S. Ren, Z. Gao, and J. Yan, “Explosion pressure characteristics of TNT under closed conditions,” Journal of Explosives, Vol. 36, No. 3, pp. 39–41, 2013.
-
H. Li, P. Jin, Yan Jiajia, and J. Wang, “Calculation method of quasi-static pressure of blast waves in confined chamber,” Initiators Pyrotechnics, pp. 45–48, 2014.
-
Z. Li, H. Zhai, X. Yan, and J. Yuan, “Research on a quasi-static pressure measurement method for temperature and pressure internal explosion,” Journal of Sensing Technology, Vol. 29, No. 2, pp. 208–212, 2016.
-
Wang et al., “Experimental study of quasi-static pressure in explosion containers,” Journal of Military Engineering, Vol. 33, No. 12, pp. 1493–1497, 2012.
-
Zhong Wei, Zhang Haibo, and Tian Zhou, “Research on the influence of chemical reactions of explosive products on chamber pressure,” Journal of Computational Mechanics, Vol. 30, pp. 68–72, 2013.
-
W. Zhong and Z. Tian, “Calculation of quasi-static pressure of constrained explosion considering the influence of chemical reaction dynamics under the isobaric hypothesis,” Explosion and Shock, 2013.
-
Zhong Wei and Tian Ze, “Numerical calculation method of quasi-static pressure of constrained explosion considering chemical reactions of decomposition products,” Explosion and Shock, pp. 78–83, 2013.
About this article

The authors have not disclosed any funding.
The datasets generated during and/or analyzed during the current study are available from the corresponding author on reasonable request.
The authors declare that they have no conflict of interest.
