Abstract
The development of methods for calculating losses of oil and petroleum products vapours from the tank has been going on for a long time. Systems that allow for more accurate calculations are also being developed along the way. In each country, and sometimes in each company, there are their own methods for determining the loss of light hydrocarbon fractions from losses from the tank through the breathing valve. In addition, losses are divided into “working losses” and “standing losses”. In each technique, there are both pros and cons. The most characteristic disadvantage of each technique is its applicability only to the conditions in which it was developed, due to the presence of correction coefficients. This article proposes a new technique for determining the loss of hydrocarbons vapours from the tank through the breathing valve, both from “working losses” and from “standing losses”. In the course of the work, formulas were obtained for calculating the flow rate through the breathing valve, which depends on the degree of opening of the pressure plate and overpressure. An experiment was conducted, instrumentally proving the application of the developed methodology. And also, the equipment is selected and recommendations on its installation and use are given.
Highlights
- A new methodology and system for monitoring and accounting for LFH losses from vapors from tanks in real time has been developed
- Based on the Ansys software package, a model of a breathing valve was built and the flow rate of the gas-air mixture was calculated depending on the degree of opening of the pressure plate and the pressure difference (internal and atmospheric)
- Equations for the flow through the breathing valve are obtained depending on the degree of opening of the pressure plate and the excess pressure Q (h, ∆P) for the fully open plate and half
- An experiment with water has been carried out, which shows that instrumentally the method can be used in production to calculate the losses of LFH through the breathing valve in automatic mode
- The equipment was selected and recommendations for its installation and use were given
1. Introduction
When transporting oil and petroleum products from the production site to the consumer, product losses occur. Most of the losses are accounted for by tank farms. Losses from the tank during the storage of oil or petroleum products occur as a result of evaporation of stored raw materials, the volume of which in 2018 in the Russian Federation, according to approximate estimates [1], is 100 thousand tons.
Losses of oil and petroleum products are divided into three categories: natural, operational and emergency. In this paper, the proposed methodology was developed to account for natural losses. So, in turn, natural losses are divided into: “working losses” and “standing losses”.
“Working losses” occur as a result of emptying and filling, and “standing losses” are the result of temperature fluctuations throughout the day.
The development of methods for calculating the loss of light fractions of hydrocarbons as a result of evaporation from the tank through the breathing valve began in that century and is still ongoing. So, one of the widely used methods in the world are [2] and [3]. The bases for Russia are [4] and [5].
At the moment, a huge number of methods are known by which these losses are calculated. Thus, the comparative analysis carried out in [6]-[9] showed that all the proposed methods have their drawbacks. For example, the considered methods are mostly intended only for those places where they were developed, since there are coefficients in the formulas that are characteristic of certain conditions. Another disadvantage is that all methods do not provide for constant monitoring and calculation of losses from evaporation from the tank. The closest inventions are the techniques proposed in [10]-[12].
Evaporation of oil and oil products (O&OP) from reservoirs leads not only to deterioration of the physico-chemical properties of the stored product, but also to economic losses, as well as environmental pollution. According to Russian companies, up to 90 % of all losses (O&OP) in the chain from production to consumer use are due to losses from evaporation in the tank. Therefore, accounting for and reducing evaporation losses is an urgent problem in the oil and gas sector.
Therefore, the development of a new method for accounting for losses from evaporation, which will more accurately determine the volume of light hydrocarbon fractions (LHF) coming out of the tank, is a very urgent problem.
Domestic and foreign scientists were engaged in the development and development of methods for accounting for losses of O&OP from evaporation: F. F. Abuzova [13], N. I. Belokon, V. B. Galeev, N. N. Konstantinov [14], A.A. Korshak [15], R. E. Levitin, V.I [16]. Chernikin, V. F. Novoselov [15], J. R. Beckman [17] and others, as well as various organizations. The results of the work done have made a significant contribution to the development of methods for accounting for losses from evaporation, which led to the accuracy of their determination. The physical essences of O&OP vapors from the surface of the stored product were described, and various relationships between external factors affecting the reservoir and the intensity of vapors were also revealed.
2. Development of the methology
The aim of the work was to develop a new methodology and system for accounting for mass losses of light fractions of hydrocarbons (LFH) from evaporation from tanks through a breathing valve in real time.
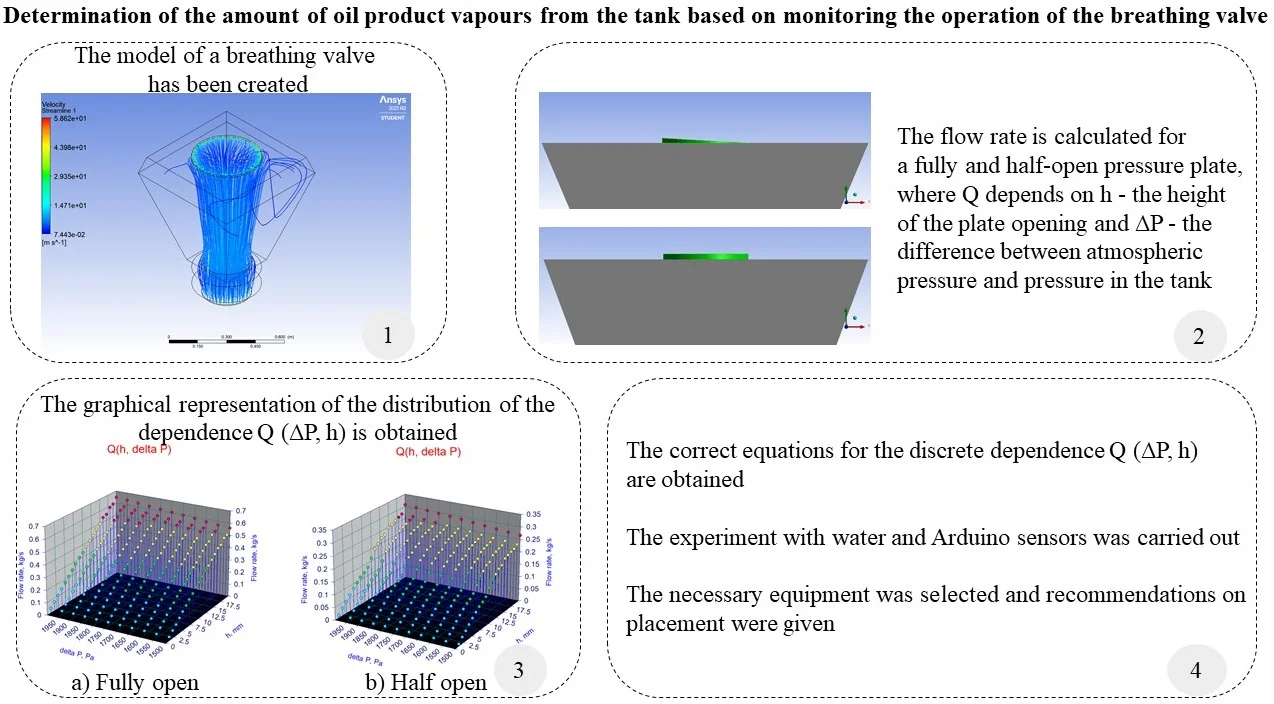
To achieve this goal, first of all, a model of a breathing valve in КОМПАС-3D was built, which was subsequently imported to Ansys to calculate the flow rate of the gas-air mixture Fig. 1.
Fig. 1CBV-1500/150
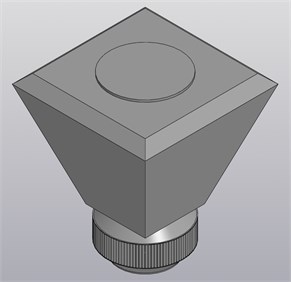
a) KОМPАС-3D
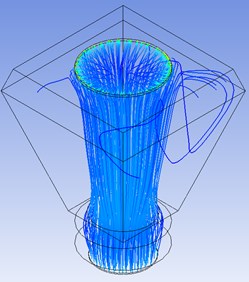
b) Ansys CFX
In order to save the computing power of the computer, it was decided to divide the breathing valve into two parts: the breathing valve itself and the fire barrier.
A fire barrier is a fire protection device, which is a corrugated metal tape rolled into a circle. Therefore, in Ansys, this design was presented in the form of a cylinder Fig. 2, of which there are 886 in such a tape.
As a result of the calculations graphically presented in Fig. 3, it was concluded that the fire barrier slightly affects the flow rate through the breathing valve, so it was not taken into account further. The upper graph describes the dependence of the friction pressure loss on the flow through the fire barrier, and the lower one describes the dependence of the friction pressure loss on the flow in the breathing valve. And as you can see, the friction losses of the fire barrier are too small compared to the friction losses in the breathing valve.
Fig. 2Drawing of one link of the fire barrier
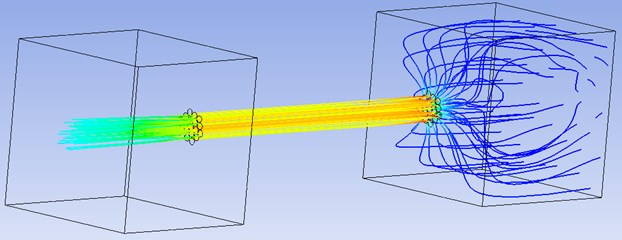
Fig. 3Pressure characteristic HQ for the fire barrier and for the breathing valve
a), fire protector
b), breath valve
In the course of calculations of the flow rate of the gas-air mixture through the breathing valve, depending on the degree of opening of the pressure plate and the excess pressure inside the tank, a discrete dependence was obtained, presented in Fig. 4. Calculations were carried out for the pressure plate fully and half open.
Fig. 4The graphical representation of the distribution of dependence Q∆P,h
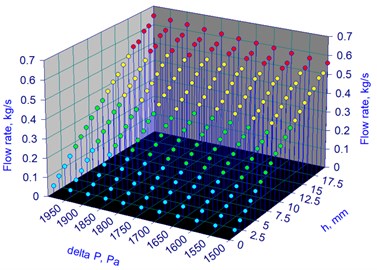
a) The pressure plate is fully open
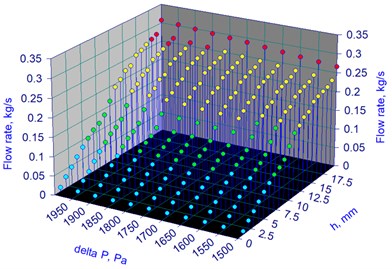
b) The pressure plate is half open
For each formula obtained using the above tools, the standard deviation was calculated and these values were summarized in Table 1.
Table 1Standard deviations for the formulas obtained
The degree of opening of the pressure plate | Method of obtaining the equation | ||||
Excel () | Excel () | Table Curve 3D | LSM | Equation of the plane | |
Fully open | 0,0295 | 0,1847 | 0,1726 | 0,1705 | 0,198 |
Half open | 0,0139 | 0,0864 | 0,0847 | 0,0819 | 0,0939 |
Thus, most accurately describing the discrete dependence presented in Fig. 4, there were formulas obtained using Excel tool (search for a solution using the downward gradient method):
3. Description of the method
Having previously calculated the flow rate of the gas-air mixture through the breathing valve and obtained the dependence , it is possible to measure the flow rate of losses from evaporation using the following technique.
When the threshold value of excess pressure is reached, the breathing valve is triggered, that is, the pressure plate rises. At this time, sensors take readings of excess pressure every second, the degree of opening of the pressure plate of the breathing valve, the concentration of controlled hydrocarbons in the tank and the temperature inside the tank.
So, with the help of these data, we will be able to calculate the losses from the evaporation of light fractions of hydrocarbon through the breathing valve:
where – the total mass flow rate of the gas-air mixture through the breathing valve, kg/s; – the mass flow rate of the gas-air mixture in the -th second, calculated by the formula , kg/s.
Where the mass of LFH is calculated by the formula:
where – the mass of the gas-air mixture in the -th second, kg; – 1 second, s; – the concentration of LFH in the -th second coming out of the breathing valve, measured using an optical gas analyzer, %.
Accordingly, the total losses for the entire period of opening the pressure cap will be calculated according to the formula:
4. Experimental setup
For safety and in order to increase the speed of the experiment, it was decided to conduct experiments with water.
A small container of water, pre-weighed, was heated on a stove to accelerate evaporation from the surface of the liquid.
Two Arduino sensors were also used for the experiment: the BMP280 pressure and temperature sensor and the SI7021 temperature and humidity sensor (I2C).
When the liquid was boiling, the pressure inside and outside the container, the temperature inside and outside, as well as the humidity of the liquid, that is, its concentration, were recorded. The lid was opened periodically to simulate the operation of the breathing valve.
Previously, an experiment was modeled in the Ansys software package to determine the steam flow through the opened lid.
After the experiment, the container was weighed again, so the exact amount of evaporated liquid was calculated, calculations were also carried out using the proposed methodology and thus the error was calculated.
As a result of 9 series of experiments, for each series, the relative error from the results obtained by weighing a vessel with water before and after the experiment was calculated, and the results were summarized in Table 2.
Table 2Relative errors in experiments
No | 1 | 2 | 3 | 4 | 5 | 6 | 7 | 8 | 9 |
22,85 | 31,19 | 25,62 | 24,25 | 22,61 | 23,18 | 28,43 | 26,15 | 23,15 |
The average value of the relative error in the end is:
5. Necessary equipment
As described above, in order to implement the operability of the technique, the use of additional equipment located on the roof of the tank will be required.
Since to calculate the flow rate of the gas-air mixture, it is necessary to know the value of , that is, the pressure difference inside and outside the tank, then a pressure gauge can be used to measure this value, which will show the overpressure, that is, just the required difference. To measure the overpressure, EMIS BAR 103 Exd an overpressure sensor in explosion-proof design can be used.
After analyzing the gas analyzers, it was decided to focus on an optical gas analyzer. Optical sensors are now gaining popularity in use, as they are easy to use and safe.
Based on the principle of operation of the optical gas analyzer, it can be concluded that it is possible not to measure the density of the gas, and not to make adjustments for concentration, since all this has already been taken into account in the principle of operation of the gas analyzer.
The Russian-made gas analyzer IDK-10-X1 will cope well with this task. In the line of gas analyzers there are models that determine the concentration of gasoline vapor AI 92, AI 95, diesel fuel, kerosene for rocket engines, kerosene for gas turbine engines, aviation gasoline, as well as other gases. This gas analyzer measures gasoline vapors in the range from 0 to 50 LCLFP (lower concentration limit of flame propagation).
To measure the position of the pressure plate, you need a device that will measure both the vertical movements of the plate and the angle of inclination. The accelerometer will perfectly cope with such a task.
An accelerometer is a device that, thanks to its sensitive mass, determines the projection of free acceleration, thereby it is possible to calculate movements.
There are MEMS accelerometers (microelectromechanical systems), this type of accelerometer will be used in the method, which must be connected to a spectrum analyzer.
To simulate the exit of the gas-air mixture from the tank through the exhaust valve, and therefore to obtain the dependence , the temperature should be measured.
“ОВЕН” temperature sensors will cope with this task; the operating temperature range is very wide. In the line there are both thermal resistance converters and thermoelectric converters.
6. Location of sensors
In the course of the work, equipment was selected for the implementation of the methodology. All sensors will be located on the roof of the tank. The accelerometer will be located directly on the pressure cap to record its movements. The remaining sensors will be located near the breathing valve.
To do this, you will need to make a hatch, measuring 30×30 cm, in the roof of the tank near the breathing valve, on which temperature and overpressure sensors will be installed on top and a concentration sensor will be installed inside, and an accelerometer will be installed directly on the pressure plates of the breathing valve to measure the position.
The sensitive membrane of the overpressure sensor will be attached to a pre-made branch pipe, and the sensor itself will be located 20-30 cm higher from the mounting point on the mounting pipe, mounted on brackets. The temperature sensor will be attached to a pre-made hole so that the sensor element will be inside the tank, and the sensor itself will be outside. Both sensors will be in protective casings to protect against weather events.
The concentration sensor will be mounted at the bottom of this hatch, since the sensitive element must be in a controlled/measured environment. On the back side of the hatch, a metal frame will be mounted in the form of a pipe perpendicular to the surface of the hatch, to which the concentration sensor will be attached, or you can mount the frame in the form of a plane to which the sensor will be attached, so it will even be easier to install and maintain in the future. For the channels of connection and output of data from the concentration sensor, a hole will be made in the hatch, which will be sealed at the time of operation of the sensor.
The hatch is necessary for compact placement of all sensors in one place, this will facilitate repair work, verification work and maintenance of sensors.
7. Conclusions
As a result of the work, a discrete dependence of the flow rate of the gas-air mixture through the breathing valve was obtained depending on the overpressure and the degree of opening of the pressure plate . After that, using several mathematical tools, Eqs. (1) and (2) were obtained that most accurately describe the discrete dependence , for fully open pressure plate and half open.
Instrumentally, on experience with water and with the help of Arduino sensors, it was proved that with the help of the proposed technique, it is possible to account for losses from evaporation in the tank through a breathing valve. During the experiment, the average relative error of all experiments is 25.27 %. Such an error could arise due to the inaccuracies of the experiment, as well as inaccurate sensor readings. These shortcomings can be eliminated in production; as more accurate devices will be used there.
Also, during the work, the equipment was selected, and recommendations were given on its location.
References
-
R. R. Gabdinurov and M. M. Gareev, “The application of soft shells inside the tank to prevent losses oil and oil products from evaporation,” Transport and Storage of Oil Products and Hydrocarbons, Vol. 4, pp. 39–44, 2021.
-
“Evaporative loss reference information and speciation methodology,” in API MPMS – Manual of Petroleum Measurement Standards, 2017.
-
“VDI 3479 (2010): Emissionsminderung,” Raffinierieferne Mineralöltanklager, 2010.
-
“GD 153-39-019-97, 1997: Methodological guidelines for determining technological losses of oil at the enterprises of oil companies of the Russian Federation,” 1997.
-
“GD 153-39.4-033-98, 1998: Norms of natural loss of petroleum products during reception, transportation, storage and release at the facilities of the main oil pipelines,” 1998.
-
E. I. Zorya and O. V. Loshchenkova, “Evaluation of publicly available technologies and methods for determining losses of petroleum products from evaporation from a storage tank,” Oil and Gas Chemistry, pp. 24–31, 2019.
-
A. Elizaryev et al., “Influence of seasonal changes in climatic conditions on losses at oil tanks filling (on example of the Republic of Bashkortostan),” E3S Web of Conferences, Vol. 175, p. 12021, 2020, https://doi.org/10.1051/e3sconf/202017512021
-
A. F. Maksimenko and S. S. Lopovok, “Comparative analysis of methods of accounting for losses of oil and petroleum products in tanks from evaporation,” Oil, Gas and Business, Vol. 5, pp. 56–59, 2015.
-
M. I. Mednikova, “Comparative analysis of methods for calculating oil loss from evaporation of the XXI century,” in 52nd Student International Scientific and Practical Conference, Vol. 4, No. 51, 2017.
-
O. V. Molchanov, A. Z. Navmatullin, S. V. Khudynin, S. V. Dmitriev, and V. I. Kabanov, “Method for determining amount of oil products in exhausts of steam-air mixture from a reservoir,” Patent No. RU2240512C2.
-
Y. D. Zemenkov, R. E. Levitin, and K. V. Dyakov, “Method for determining losses of oil and petroleum products from evaporation with small tank breathing,” Patent No. RU2561660C1.
-
O. P. Buzenkov, V. I. Kabanov, N. A. Mironov, O. V. Molchanov, and M. V. Novikov, “Method for determining losses of oil and oil products in result of evaporation at storage and transportation,” Patent No. RU2541695C1.
-
F. F. Abuzova, “Investigation of losses of oil and petroleum products and the effectiveness of means of reducing them in reservoirs,” Ph.D. Thesis, 1977.
-
N. N. Konstantinov, Struggle with Losses from Evaporation of Oil and Petroleum Products. Moscow: Gostoptehizdat, 1961.
-
P. I. Tugunov et al., Typical Calculations in the Design and Operation of Oil Depots and Pipelines. Ufa: LLC “Designpoligrafservice”, 2022.
-
R. E. Levitin and R. A. Tryascin, “Determining fuel losses in storage tanks based on factual saturation pressures,” in IOP Conference Series: Materials Science and Engineering, Vol. 154, p. 012022, Oct. 2016, https://doi.org/10.1088/1757-899x/154/1/012022
-
J. R. Beckman and J. R. Gilmer, “Model for predicting emissions from fixed-roof storage tanks,” Industrial and Engineering Chemistry Process Design and Development, Vol. 20, No. 4, pp. 646–651, Oct. 1981, https://doi.org/10.1021/i200015a011
About this article

