Abstract
Aiming at the problem that there is a strong eardrum pressure in the passenger car during the closing process, two analysis and prediction methods, fast formula prediction and CFD simulation based on accurate models, are proposed. The regression model of ear pressure comfort was established by DOE method and multiple linear regression; The simulation software star-CCM+ is applied to simulate and analyze the dynamic characteristics of the flow field in the cockpit during the closing process by using the overlapping grid technology, and the pressure change curve near the ear is obtained. Finally, the CFD numerical simulation model is established by comparing and analyzing the regression prediction analysis results and the real vehicle test data. The results show that the effects of closing speed, effective opening area of pressure relief valve and air tightness of the whole vehicle on the pressure of passengers’ eardrums decrease in turn, and the prediction error of multiple linear regression equation is 17 %; The analysis error of the internal flow field dynamic characteristic model based on refined modeling is 8 %. This study provides a theoretical basis for solving the problem of rapid prediction of eardrum pressure and optimization of engineering structure.
1. Introduction
With the improvement of automobile manufacturing technology, the air tightness of the whole vehicle has reached an excellent level, but the tingling of the eardrums of the drivers and passengers during the closing process has become the focus of customer complaints. Researchers [1-6] studied the improvement scheme of eardrum pressure by analyzing the influence of single factors on the pressure in the vehicle. However, as a complex system engineering, automobile performance development should comprehensively analyze the change law of the dynamic characteristics of the flow field in the cabin from the perspective of the joint action of multiple factors; Secondly, researchers usually judge the degree of influence of factors based on engineering experience. The order of importance is not clear, the order of optimization and improvement is not clear, and the research on statistical laws and interaction mechanisms is relatively scarce, which treats the symptoms but not the root cause; Finally, the simplified simulation model replaces the real vehicle digital model, which leads to low simulation accuracy and has little guiding significance for engineering design.
This paper takes a car under research as the research object, takes the elimination of the pressure feeling of the eardrum when the car is closed as the research goal, comprehensively analyzes many influencing factors, obtains the importance ranking of many influencing factors, uses multiple linear regression analysis to fit the regression prediction equation, and provides rapid improvement suggestions for parameter optimization. In order to obtain a more accurate and reliable engineering improvement scheme, a refined finite element model of the whole vehicle is built. In combination with the CFD software star CCM + and with the measured values of three influencing factors as inputs, the pressure relief channel is optimized and the pressure change in the vehicle is monitored. Finally, the error between the predicted value of regression model, simulation analysis model and real vehicle test data is analyzed and compared.
2. Pressure change test
The main factors affecting the instantaneous pressure in the vehicle are: air flow input, transmission loss and air flow output, that is, the air flow into the vehicle after closing the door leaf, the gas leakage of the whole vehicle and the leakage of the pressure relief valve of the vehicle body [7]. The corresponding key performance parameters are the closing speed, the air tightness data of the whole vehicle and the actual pressure relief area of the pressure relief valve. The following studies will analyze these three parameters as important influence factors.
In this paper, the closing speed, the air tightness value of the whole vehicle and the actual pressure relief area of the pressure relief valve are taken as the influence factors, and the pressure near the inner ear of the vehicle is taken as the monitoring value to carry out the research.
2.1. Dynamic pressure test in the vehicle during door closing
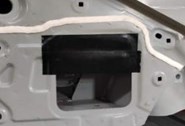
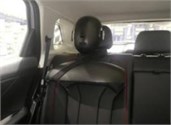
The experimental equipment and conditions are mainly composed of four parts: 1) the closing speed sensor (as shown in Fig. 1a) for measuring the closing speed, which is arranged at the door latch to measure the instantaneous linear speed of the door at the latch before closing. 2) The air tightness test system of the whole vehicle (as shown in Fig. 1(b)) will adjust the leakage of the whole vehicle by plugging the gaps such as doors, skylights and welds; 3) Adjust the opening area of the pressure relief valve of the vehicle body with the airtight adhesive tape and damping sheet (as shown in Fig. 1(c)), so as to change the actual pressure relief area of the pressure relief valve of the vehicle body; 4) The manual head for dynamic pressure test (as shown in Fig. 1(d)) is arranged at the right rear passenger's position, and the acquisition accuracy is 0.006 s. It is used to monitor and record the change value of the pressure near the ear during the whole process of closing the door.
Fig. 1Dynamic pressure test in the vehicle during door closing: a) door closing speedometer, b) air tightness test system, c) partial blocking state of body pressure relief valve, d) dynamic pressure test system in the vehicle

a)

b)
c)
d)
2.2. Experimental design scheme
According to the above analysis, three main factors are set: A- closing speed (m/s); B -effective opening area of pressure relief valve (mm2); C-air tightness of the whole vehicle (SCFM@125Pa). Each factor has six levels. The specific experimental design scheme is shown in Table 1. The numbering design is carried out at the level of 3 factors and 6 levels.
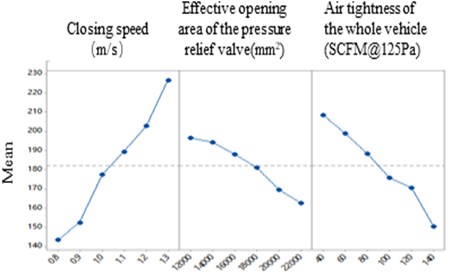
Test according to the experimental design scheme to obtain the pressure amplitude of each group, as shown in Table 1. Import the test data into the statistical analysis software Minitab for data analysis. Considering the interaction between factors, Taguchi analysis is adopted as the analysis method, and the output results are signal-to-noise ratio and mean value, as shown in Table 2. According to the analysis, the most influential factor on the output result (pressure amplitude) is the closing speed, followed by the air tightness of the whole vehicle, and finally the effective opening area of the pressure relief valve. The smaller the horizontal value of the closing speed, the better. The larger the effective opening area of the relief valve and the air tightness of the whole vehicle, the better. Therefore, the best test schemes are A1, B6 and C6, that is, the closing speed is 0.8 (m/s), the effective opening area of the relief valve is 22000 (mm2), and the air tightness of the whole vehicle is 140 (SCFM@125Pa). Draw the main effect diagram of 3-factor 6-level ANOVA (as shown in Fig. 2) to test the influence of factors on pressure amplitude.
Table 1Test results – pressure amplitude
Serial number | Pressure amplitude (Pa) | Serial number | Pressure amplitude (Pa) | Serial number | Pressure amplitude (Pa) | Serial number | Pressure amplitude (Pa) |
1 | 181 | 10 | 144 | 19 | 201 | 28 | 222 |
2 | 166 | 11 | 117 | 20 | 195 | 29 | 208 |
3 | 145 | 12 | 156 | 21 | 162 | 30 | 178 |
4 | 138 | 13 | 205 | 22 | 212 | 31 | 205 |
5 | 122 | 14 | 193 | 23 | 189 | 32 | 278 |
6 | 109 | 15 | 171 | 24 | 177 | 33 | 263 |
7 | 184 | 16 | 139 | 25 | 203 | 34 | 231 |
8 | 163 | 17 | 188 | 26 | 171 | 35 | 194 |
9 | 151 | 18 | 169 | 27 | 235 | 36 | 188 |
Table 2Signal to noise ratio
Level | Closing speed (m/s) | Effective opening area of pressure relief valve (mm2) | Air tightness of the whole vehicle SCFM@125Pa ) |
1 | –43.01 | –45.86 | –46.22 |
2 | –43.59 | –45.62 | –45.85 |
3 | –44.92 | –45.25 | –45.38 |
4 | –45.51 | –44.93 | –44.82 |
5 | –46.09 | –44.37 | –44.5 |
6 | –47 | –44.1 | –43.34 |
Delta | 4 | 1.75 | 2.88 |
Sort | 1 | 3 | 2 |
Fig. 2Main effect diagram of ANOVA
3. Empirical prediction model
In order to further analyze the relationship between the three factors and the pressure amplitude, SPSS statistical analysis software was used to analyze the correlation of the data, and a regression prediction model was built using multiple linear regression.
It can be seen from Table 3 that the closing speed, the effective opening area of the pressure relief valve and the air tightness of the whole vehicle are taken as independent variables, and the pressure amplitude is taken as the dependent variable for linear regression analysis. It can be seen from the above table that the R-square value of the model is 0.945, which indicates that the closing speed, the effective opening area of the relief valve and the air tightness of the whole vehicle can explain 94.5 % of the change in the pressure amplitude. When f-checking the model, it was found that the model passed f-checking (= 184.943, 0.000 < 0.05), indicating that at least one of the three factors of closing speed, effective opening area of pressure relief valve and air tightness of the whole vehicle will affect the pressure amplitude. The corresponding prediction model formula is:
where: is pressure amplitude, is closing speed, is air tightness of the whole vehicle, is the actual leakage area of the body pressure relief valve.
The regression coefficient value of closing speed is 165.095 ( 18.431, 0.000 < 0.01), indicating that closing speed has a significant positive impact on pressure amplitude; Similarly, the effective opening area of the pressure relief valve and the air tightness of the vehicle will have a significant negative impact on the pressure amplitude. From Table 4, it can be seen that the R-square value of the model is 0.945, which means that the closing speed, the effective opening area of the pressure relief valve and the air tightness of the whole vehicle can explain 94.5 % of the change in the pressure amplitude.
Table 3Linear regression analysis results
Right rear passenger ear pressure | Regression coefficient | Vif |
Constant | 118.883 (9.254**) | – |
Closing speed (M/s) | 165.095 (18.431**) | 1.000 |
Effective opening area of pressure relief valve (mm2) | –0.004 (–7.947**) | 1.000 |
Air tightness of the whole vehicle (SCFM@125Pa ) | –0.552 (–12.328**) | 1.000 |
Sample size | 36 | |
R2 | 0.945 | |
Adjust R2 | 0.940 | |
F value | F (3,32) = 184.943, 0.000 | |
Dependent variable: pressure amplitude Pa | ||
D-W value: 1.476 | ||
* 0.05 * * 0.01 (t value in parentheses) | ||
Table 4Linear regression analysis results
R | R2 | Adjust R2 | Model error | D-W value |
0.972 | 0.945 | 0.940 | 9.179 | 1.476 |
4. CFD numerical simulation prediction
Although the regression model provides a method to quickly judge the change trend of pressure amplitude, it is not comprehensive and accurate to take the effective relief area of the pressure relief valve as the influencing factor to reflect the gas outflow, because it ignores the influence of the gas flow path in front of the pressure relief valve, so there is a large error in the theoretical prediction result of the regression model [8]. Therefore, this paper further adopts the simulation analysis method to calculate and analyze the pressure change of the vehicle during the closing process by establishing an accurate vehicle model and fully considering the impact of the pressure relief channel. The closing speed adopts the measured curve of 1.2 m/s under 5° door opening collected by the real vehicle. In order to accurately compare with the measured internal pressure data, the step size is set to 0.006 s, which is consistent with the data acquisition step size.
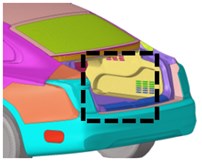
The trunk grille is the main air flow channel for pressure relief. The closing eardrum pressure is mainly simulated and calculated for three model states. The models before and after the optimization of the trunk grille structure are shown in Fig. 3:
1) Effective pressure relief area of grid in original state: 11000×2 mm2;
2) The effective pressure relief area of grid increases by 5500×2 mm2;
3) The effective pressure relief area of grid increases by 8000×2 mm2.
The pressure change curve and data near the ear of the right rear passenger in the vehicle are shown in Fig. 4 and Table 5. From the simulation results, it can be seen that the trunk grille is the main air flow relief channel, and increasing its opening area will help the gas flow smoothly to the pressure relief valve position, which can effectively reduce the pressure on the eardrum in the vehicle.
Fig. 3Original scheme and improved scheme of trunk grille: a) overall view of trunk grille, b) partial enlarged view of grille in its original state, c) grille optimization scheme 1, d) grille optimization scheme 2
a)
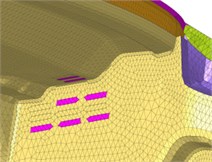
b)
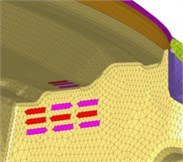
c)
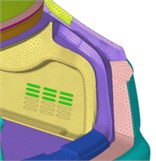
d)
Fig. 4Pressure curve of luggage compartment grille structure before and after improvement
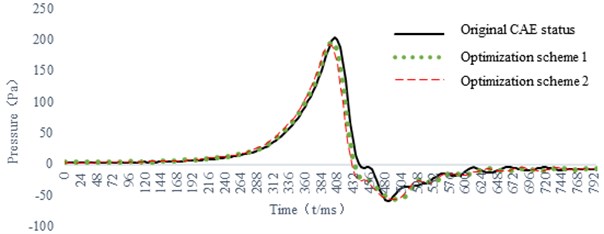
Table 5Data comparison before and after improvement of trunk grille
Right rear passenger ear pressure | Original CAE status | Optimization scheme 1 | Optimization scheme 2 |
Maximum pressure max (Pa) | 203.04 | 193.07 | 178.70 |
Minimum pressure min (Pa) | –57.88 | –55.58 | –55.67 |
(Max-Min) (Pa) | 260.92 | 248.65 | 234.37 |
5. Data comparison of regression model prediction, CFD prediction and measured results
According to the prediction formula (5) of the multiple linear regression model, the closing speed of the original vehicle test data is 1.2 m/s, and the vehicle leakage is 63SCFM@125 Pa , the effective opening area of the body pressure relief valve is 18200 mm2, which is brought into the formula, and the calculated pressure amplitude is 209.42 Pa. The multiple linear regression prediction value, CFD simulation prediction value and real vehicle test value are compared and analyzed (as shown in Table 6). The comparison results show that the error of regression prediction value is 17.77 %, and the error of CFD simulation analysis model is 8.3 %. The prediction method of multiple linear regression model is more suitable for quickly analyzing and judging the pressure change trend because of its short calculation cycle and high efficiency. The CFD simulation analysis method can more truly reflect the body structure and simulate the dynamic movement process. Although the analysis and calculation cycle is longer, the prediction accuracy is higher, and it is more suitable for guiding the engineering design and development and optimizing the structural parameters of parts and products.
Table 6Multiple linear regression, CFD calculation and comparison of real vehicle test data
Regression prediction value | Simulation value | Measured value | |
Maximum pressure max (PA) | / | 178.70 | 198.16 |
Minimum pressure min (PA) | / | –55.67 | –55.82 |
(Max-Min) (Pa) | 209.42 | 234.37 | 253.98 |
Error with measured value | 17.77 % | 8.3 % | / |
6. Conclusions
A prediction mathematical model for quickly predicting the pressure peak that reflects the pressure feeling of the eardrum in the vehicle is established, and the prediction method of the refined simulation is studied by using the CFD simulation analysis method, and the data errors of the mathematical model, the simulation method and the measured value are compared. The experimental and analytical results show that:
1) Doe experiments show that the effects of closing speed, air tightness of the whole vehicle and the opening area of the relief valve on the ear pressure comfort decrease in turn;
2) A multiple linear regression prediction model for the pressure feeling of the eardrum in the closed car is established, which can realize the rapid prediction of the pressure near the eardrum in the car under different input parameter combinations, and can also reverse obtain the guidance value of the opening area of the relief valve according to the pressure target value, which shortens the development cycle and reduces the impact of subjective experience.
References
-
Y. L. Lee and S. H. Hwang, “Flow characteristics in a cabin during door closure,” Proceedings of the Institution of Mechanical Engineers, Part D: Journal of Automobile Engineering, Vol. 225, No. 3, pp. 318–327, 2011, https://doi.org/10.1177/09544070jauto1
-
R. Zhang, “Study on human ear pressure comfort during door closing,” Jilin University, Changchun, 2014.
-
F. Chen, “Analysis on pressure during door closure considering air tightness,” Hunan University, Changsha, 2018.
-
L. Y. Xiang, R. He, Y. Gu, P. Guan, and F. Kang, “Research and optimization of closing ear pressure of electric car,” Shanghai Auto, No. 11, pp. 18–22, 2019.
-
P. Guan, L. Pan, and Y. Gu, “Research on vehicle ear pressure performance character of slamming door,” Automobile Applied Technology, No. 10, pp. 177–180, 2020, https://doi.org/10.16638/j.cnki.1671-7988.2020.10.053
-
R. Su, H. L. Li, L. L. Su, Z. M. Xu, and Y. M. Chen, “Study on simulation method of ear pressure resulting from door close of a car,” Automobile Technology, No. 11, pp. 33–37, 2020, https://doi.org/10.19620/j.cnki.1000-3703.20191242
-
F. Lin and C. J. Chen, “Study on passenger comfort affected by interior pressure variation,” China Measurement and Test, Vol. 40, No. 2, pp. 125–129, 2014.
-
C. C. Geng, M. Kang, Z. M. Xu, W. Q. Jiang, and L. L. Su, “Research and optimization of the influencing factors of closing door pressure,” Journal of Chongqing University of Technology (Natural Science), Vol. 35, No. 2, pp. 67–73, 2020.
About this article

The authors have not disclosed any funding.
The datasets generated during and/or analyzed during the current study are available from the corresponding author on reasonable request.
The authors declare that they have no conflict of interest.
