Abstract
A force transducer-based plate dynamometer for milling force measurements is presented in this paper. The main components of the designed dynamometer were described, and experimental modal analysis was carried out while considering the dynamometer as a 1DOF system. The values of the main components of the 1DOF systems such as mass, damping coefficient, and equivalent stiffness were identified, and the natural frequency for rings and dynamometer was calculated. The calculated natural frequencies of components were found in reacceptance FRF, obtained by modal analysis done with an impact hammer. A MATLAB simulation was done to validate the system using the transfer function based on the modal test.
1. Introduction
Milling is one of the most important manufacturing processes. As in all machining operations research, a very important subject refers to the dynamic behaviour of the manufacturing system considered as a dynamic mechanical system. The main problem associated with the cutting process is the appearance of the chatter, developed in different ways in turning, milling, drilling, etc. The chatter phenomenon was analysed in many papers, beginning with the years 50’ and 60’ [1]-[3]. One of the most difficult activities in machining process study, and in milling, in particular, is to do an accurate identification of the system dynamics and its parameters [4] and to accurately predict the cutting process mechanics through simulation [5].
The considered mathematical models are based on classical damped lumped models with 1DOF [6]-[9] or 2DOF [10]-[13]. The motion equations that describe the dynamic behaviour are time-periodic delay-differential equations which use modal data found by experimentally measuring frequency response functions (FRFs). The cutting force information can be found using specialised dynamometers. The best dynamometers that can be used are based on a flexural mechanism. Such devices have some advantages as simple design and assembly, low cost of manufacturing, monolith structure, linear relationship between applied force and displacement for small distortions, and continuous smooth displacement characteristics [14].
In this paper, a dynamometer made of two plates coupled with four octagonal elastic elements (rings) and force transducers mounted on the top plate in milling directions for dynamic milling forces measurements is presented and studied as 1DOF system. Compared with the laboratory dynamometers that use a strain gauges system the proposed one uses dedicated force transducers and accelerometers. The force transducers are calibrated and can measure tensile and compressive forces, and the frequency of dynamic forces. In comparison with the strain gauges, the system force transducer is easy to mount/unmount, have low-impedance output, and have a rigid construction with high stiffness.
2. Considerations on dynamometer design
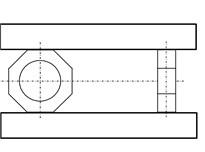
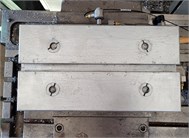
In milling modelling and simulation, it is necessary to measure the three forces developed during milling operations: feed force , thrust force and main cutting force . The components of the considered dynamometer are presented in Figs. 1-3.
Fig. 1Three views of the plate dynamometer
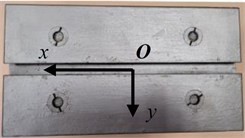
a) Top view
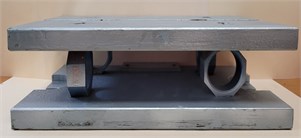
b) Front view
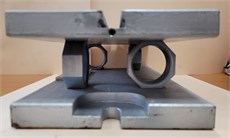
c) Side view (front)
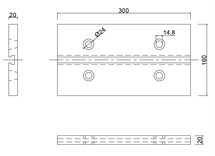
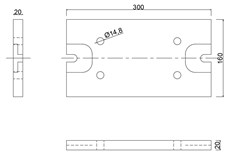
Fig. 2Sketches of the dynamometer components
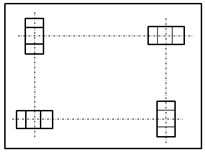
a) Plan view
b) Side view
Fig. 3Sketches of the dynamometer components
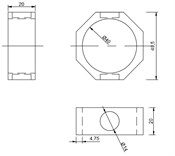
a) Ring
b) The top plate
c) Bottom plate
The dynamometer was designed for using four force transducers type 8230 C 003 (Brűel & Kjær) that have the possibility to measure all the forces in dynamic range, and two TEDS accelerometers type 4507 B (Brűel & Kjær). The accelerometers and the force transducer were mounted as presented in Fig. 4 considering the directions and presented in Fig. 1.
Fig. 4Mounting positions of the force transducer

a) Direction
b) Direction
The plate dynamometer presented in Figs. 1 and 4 was designed, by the authors, in the Mechanical Engineering Department from Transilvania University of Brașov.
The major limitation of the dynamometer is given by the frequency bandwidth that can be achieved during the milling process. For a proper operation, the designed dynamometer should have a higher natural frequency than the dynamic frequency associated with the milling process, given by the relation [15]:
where is the dynamic frequency calculated in kHz, represents the cutting speed expressed in mm/min, is the number of teeth, and is the diameter of the cutter measured in mm.
Another important step that is necessary for dynamometer design is to find the natural frequency of the rings. The natural frequency involves stiffness calculation. The static ring stiffness, for milling dynamometers in case of normal force, can be calculated by the relation [16]:
where is the Young’s modulus (modulus of elasticity) in N/mm2, represents the width of the ring measured in mm, is the radius expressed in mm, and represents the thickness of the ring measured in mm.
The specifications of the designed rings are 2e5 N/mm2, 20 mm, 20 mm, and 4.7 mm which resulted in a static stiffness of 24,675 N/mm. The measured mass of the ring is 0.153 kg, and considering the static stiffness results in a natural frequency of 2021.17 Hz. Reported to the radial and tangential directions, in [17] there are presented the following relations for stiffness in radial direction and in tangential direction :
Considering above mentioned data for dimensions in relations Eqs. (3) and (4) there are obtained the values 30.28e6 N/m, and 15.14e6 N/m.
3. Modal test of the dynamometer considered as 1DOF system
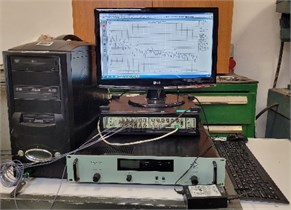
Modal parameters of any structure can be found using one of the experimental modal methods: with impact hammer excitation or with shaker excitation. In the present paper, the impact hammer excitation method was used, an impact hammer type 8207 (Brűel & Kjær), and the Platform PULSE 12 (Brűel & Kjær) which have its own software for data acquisition and data processing (Fig. 5). The data acquisition system presented in Fig. 5 is used in the Mechanical Engineering Department from Transilvania University of Brașov, Romania.
In tests, the bottom plate is fixed and an impact force was introduced on the upper, resulting in vibration signals being generated in both considered directions.
Fig. 5Data acquisition system
The hits were applied on the opposite side of the points where are mounted the force transducers. There applied a number of 10 hits and a linear average of the values were done. The measurements were done for direction (Fig. 5) and direction (Fig. 6). The upper plate and the four rings were considered as a 1DOF that is governed by the motion equation:
where is the upper plate mass, is the damping constant, and is the stiffness of the system.
The mass of the upper plate of the designed dynamometer is 6.6 kg and the rings are parallel connected and they have an equivalent stiffness of 90.84e6 N/m.
For the data of the mass and stiffness the natural frequency can be calculated with the relation:
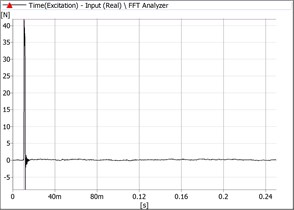
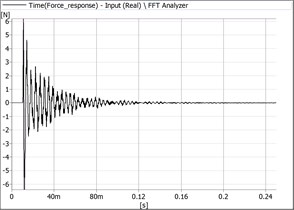
Introducing the calculated data, the mass and stiffness the natural frequency of the dynamometer considered as 1DOF is 590.45 Hz, and the rotational frequency corresponding to is 3709.93 s-1. The identification of the system involves obtaining the damping constant . From the test, the obtained responses are presented in Figs. 6-7.
Fig. 6Signals recorded in Ox direction
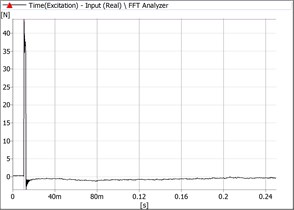
a) Hammer signal
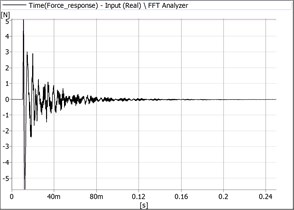
b) Force transducer signal
Fig. 7Signals recorded in Oy direction
a) Hammer signal
b) Force transducer signal
As it can be seen the values of the dynamometer for both considered directions are typical for 1DOF-damped systems. The measured values are presented in Table 1.
Table 1Modal parameters
Hit direction | Time [ms] | Force value [N] | n | Hit direction | Time [ms] | Force value [N] | |
10.996 | 5.063 | 6 | 10.996 | 5.063 | 6 | ||
14.404 | 3.013 | 14.106 | 3.013 |
As it is known from the theory of vibration applied for the 1DOF it can be found the logarithmic decrement considering the relation:
where is the amplitude of the signal at the moment , is the amplitude of the signal after periods , and is any integer number of successive, positive peaks.
From the data presented in Table 1 the following values were obtained: in direction 0.331, and in direction 0.191. As results from the values of and the damping effect is different in the two considered directions.
The values of the damping ratio are given by the:
The values of the damping ratio in both directions, calculated with Eq. (7) are 0.052 and 0.03. Considering the relations of damping constant:
one can calculate these constants in both directions taking into consideration the values of , , and : 2546.49 Ns/m, and 1469.13 Ns/m.
From the experimental data one can conclude that the dynamometer has two different motions that can be modelled by equations written on direction and on direction, as a 1DOF system:
Based on Eqs. (9) and (10) there were simulated in MATLAB the responses of the system on and directions (Fig. 8).
Fig. 8System simulated response
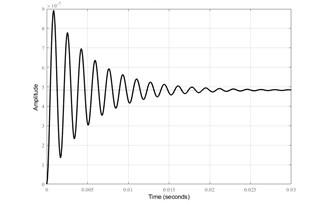
a) On direction
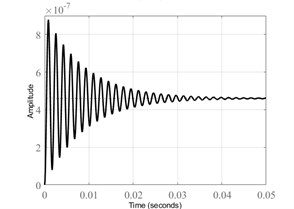
b) On direction
Concurrently the receptance FRF of the displacements was measured by double integration of the acceleration signal recorded by both accelerometers and the input signal was the signal generated by hitting the structure with the hammer (Fig. 9).
In the above presentation the natural frequency for the ring ( 2021.17 Hz), and for the dynamometer, which is considered as a 1DOF system ( 590.45 Hz). Analysing the obtained values in FRFs from Fig. 9 one can identify a resonant frequency of 600 Hz and another of 2016 Hz which are close to the calculated values.
Fig. 9The measured FRF
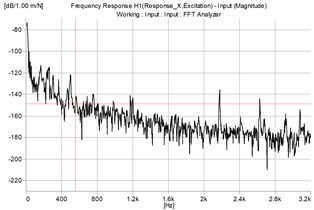
a) On direction
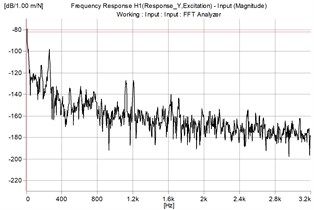
b) On direction
4. Conclusions
In the presented work, a designed dynamometer with dynamic force transducers for milling forces measurements has been presented. The proposed dynamometer dynamic behaviour was analysed as a 1DOF system considering the impact hammer test on the two normal directions that are coincidences with the directions of the milling cutting forces. Based on calculation and on the modal experiment the parameters needed to formulate the equations of motion on considered directions were obtained. The strain gauges system for force measuring was replaced with four calibrated load cells and accelerometers. The use of calibrated cells offers flexibility in measurements of a wide range of forces due to their easy assembly. The modal analysis of the designed plate dynamometer proves that the technique used in data acquisition can provide accurate data in measuring cutting forces.
References
-
J. Tlusty and L. Spacek, Self-Excited Vibrations on Machine Tools. Prague, Czech: Nakl. CSAV, 1954.
-
S. A. Tobias, Theory of Regenerative Machine, Tool Chatter. THE ENGINEER, 1958.
-
S. A. Tobias, Machine Tool Vibration. London: Blackie & Son, Ltd., 1965.
-
D. Hajdu, T. Insperger, and G. Stepan, “Robust stability analysis of machining operations,” The International Journal of Advanced Manufacturing Technology, Vol. 88, No. 1-4, pp. 45–54, Jan. 2017, https://doi.org/10.1007/s00170-016-8715-0
-
Y. Altintas and A. Ber, “Manufacturing automation: metal cutting mechanics, machine tool vibrations, and CNC design,” Applied Mechanics Reviews, Vol. 54, No. 5, pp. B84–B84, Sep. 2001, https://doi.org/10.1115/1.1399383
-
A. K. Kiss, D. Hajdu, D. Bachrathy, and G. Stepan, “Operational stability prediction in milling based on impact tests,” Mechanical Systems and Signal Processing, Vol. 103, pp. 327–339, Mar. 2018, https://doi.org/10.1016/j.ymssp.2017.10.019
-
Yi S., Nelson Pw, and Ulsoy Ag, “Delay differential equations via the matrix Lambert W function and bifurcation analysis: application to machine tool chatter,” Mathematical Biosciences and Engineering, Vol. 4, No. 2, pp. 355–368, 2007, https://doi.org/10.3934/mbe.2007.4.355
-
G. Jin, H. Qi, Z. Li, and J. Han, “Dynamic modeling and stability analysis for the combined milling system with variable pitch cutter and spindle speed variation,” Communications in Nonlinear Science and Numerical Simulation, Vol. 63, pp. 38–56, Oct. 2018, https://doi.org/10.1016/j.cnsns.2018.03.004
-
Y. Wu, Y. You, and J. Jiang, “A stability prediction method research for milling processes based on implicit multistep schemes,” The International Journal of Advanced Manufacturing Technology, Vol. 105, No. 7-8, pp. 3271–3288, Dec. 2019, https://doi.org/10.1007/s00170-019-04487-3
-
Y. Altintas, G. Stepan, D. Merdol, and Z. Dombovari, “Chatter stability of milling in frequency and discrete time domain,” CIRP Journal of Manufacturing Science and Technology, Vol. 1, No. 1, pp. 35–44, 2008, https://doi.org/10.1016/j.cirpj.2008.06.003
-
S. Wan, X. Jin, N. K. Maroju, and J. Hong, “Effect of vibration assistance on chatter stability in milling,” International Journal of Machine Tools and Manufacture, Vol. 145, p. 103432, Oct. 2019, https://doi.org/10.1016/j.ijmachtools.2019.103432
-
X. Zhang, C. Wang, J. Liu, R. Yan, H. Cao, and X. Chen, “Robust active control based milling chatter suppression with perturbation model via piezoelectric stack actuators,” Mechanical Systems and Signal Processing, Vol. 120, pp. 808–835, Apr. 2019, https://doi.org/10.1016/j.ymssp.2018.10.043
-
L. T. Tunc, Y. Mohammadi, and E. Budak, “Destabilizing effect of low frequency modes on process damped stability of multi-mode milling systems,” Mechanical Systems and Signal Processing, Vol. 111, pp. 423–441, Oct. 2018, https://doi.org/10.1016/j.ymssp.2018.03.051
-
M. F. Gomez and T. L. Schmitz, “Displacement-based dynamometer for milling force measurement,” in Procedia Manufacturing, Vol. 34, pp. 867–875, 2019, https://doi.org/10.1016/j.promfg.2019.06.161
-
G. Totis, O. Adams, M. Sortino, D. Veselovac, and F. Klocke, “Development of an innovative plate dynamometer for advanced milling and drilling applications,” Measurement, Vol. 49, pp. 164–181, Mar. 2014, https://doi.org/10.1016/j.measurement.2013.11.049
-
S. Yaldız, F. Ünsaçar, H. Sağlam, and H. Işık, “Design, development and testing of a four-component milling dynamometer for the measurement of cutting force and torque,” Mechanical Systems and Signal Processing, Vol. 21, No. 3, pp. 1499–1511, Apr. 2007, https://doi.org/10.1016/j.ymssp.2006.06.005
-
M. C. Shaw, Metal Cutting Principles. Oxford: Clarendon Press, 1984.
About this article

The authors have not disclosed any funding.
The datasets generated during and/or analyzed during the current study are available from the corresponding author on reasonable request.
The authors declare that they have no conflict of interest.
