Abstract
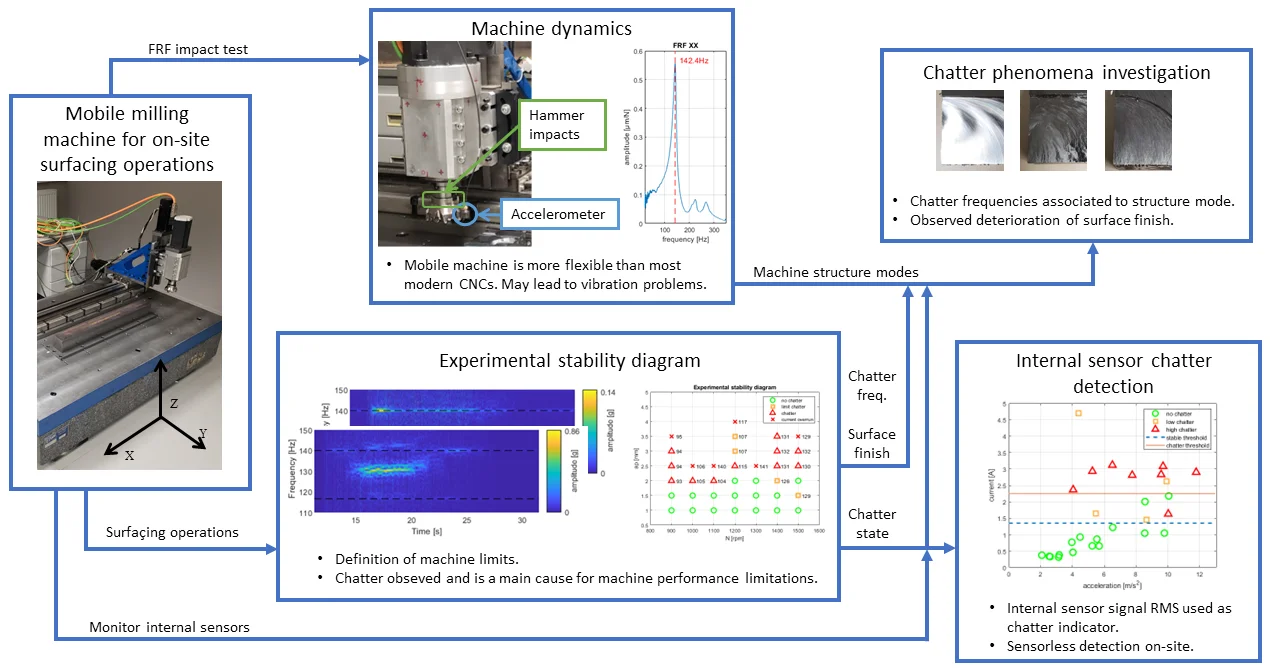
Many industries rely on heavy-duty machinery such as cranes, pipelines, motors, which are subject to wear and tear. Milling of such parts using conventional machine tools presents many drawbacks and is impossible in some cases. In such situations, mobile machine tools can be used to machine directly on site. However, mobile machines are flexible, and are prone to detrimental vibrations during cutting operations. Vibrational stability in the surfacing process has been extensively studied in conventional milling. However, the focus of this article is an original study on a mobile milling machine used for on-site surfacing operations. An experimental investigation into the vibrational behavior of the machine is carried out and a sensorless method is used to detect the onset of chatter. Machine flexibility is discussed using a tool-point frequency response function and references from the literature. Milling operations are carried out over a range machining parameter to determine an experimental stability limit. Internal sensors for spindle motor consumption and spindle motor encoder are monitored during the machining process. A threshold is established for determining the appearance of chatter using only the machine’s internal sensors.
Highlights
- The FRF of a mobile milling machine structure shows that it is more flexible than most modern conventional milling machines found in the literature.
- Chatter presence was monitored during surfacing operations using an accelerometer placed on the machine head. It is shown that chatter is an important limiting factor in machine performance.
- Milling machine internal sensors signals are used as indicators for chatter presence.
1. Introduction
Many industrial sectors, such as energy production (nuclear, hydroelectric, etc.), maritime transportation and aeronautical use machines containing very large metallic parts. These parts are subject to wear and tear and, with time, need to be machined back to specific functional tolerances. These operations present a challenging undertaking due to the scale of such parts [1], [2]. Two methods are usually considered: either conventional machining where the large part is brought to a large conventional machine, or on-site machining, where a mobile machine is brought to the part. The first solution presents many difficulties. For instance, it can be hard to find machines on the same scale as the part and companies sometimes resort to transporting parts overseas to use appropriate machines, ensuing large costs. In some instances, the part can be impossible to disassemble. In such cases, on-site machining leads to a significant reduction in company costs.
Mobile machine tools designed specifically for on-site machining need to be easily disassembled and transported. Consequently, they are lighter and more flexible than their conventional counterparts. This added flexibility is the source of problematic vibrations, such as chatter. In fact, chatter vibrations are one of the most common problems reported by technicians working in the field. Such phenomena can cause difficulty in machining, leading to an increased operation duration and a loss of income for the on-site machining company.
Mobile machine tool dynamics have been studied in an on-site environment [1], [2], [3]. The authors used substructure decoupling to obtain a dynamic model of a complete system of a mobile milling machine and its support. Later, the model was used to predict chatter stability. Such a model may be of great use when machining unitary parts with no prior experience of the process. A mobile milling machine was also studied in comparison with a robotic arm for face milling operations [4]. The authors proposed a model of the attainable tolerances for each machine. It was shown that the mobile milling machine was more performant than the robotic arm, due to the low rigidity of the arm. However, when the hydraulic spindle motor of the mobile milling machine is pushed above 500 rpm, important vibrations are observed, rendering machining impossible.
Historically, vibrational problems in conventional milling have been rigorously studied. The most notorious problem is chatter, which can lead to a deteriorated surface finish, and to increased wear on the tools and on the machine [4]. Chatter is a phenomenon which arises from the interaction between the machine and the workpiece. It causes characteristic vibrations at a stable frequency that is different from the forced vibrations experienced by the system. Consequently, one common method for detecting chatter is to search for the appearance of such vibrations in the frequency domain. Reference [5] presents a method for fast identification of the experimental chatter stability diagram using a spindle speed ramp-up test (SSR) for a milling machine. This method uses order analysis for chatter detection where signal information is studied in both time and frequency domain using a waterfall Fast Fourier Transform (FFT) diagram. Using such a diagram, authors can distinguish chatter frequency from other sources of vibration in the system. The stability diagram obtained by SSR is then compared to a series of fixed parameter milling tests for validation. Reference [6] presents a method for detecting chatter vibrations in the time domain. To achieve this, the forced vibrations are filtered out from sound and acceleration measurement signals using a Kalman filter. The vibration energy on the remaining signal was then studied for the determination of chatter presence. This method can detect chatter earlier than frequency-based domain methods that use FFTs.
In this paper, a case study of process chatter in a face milling operation on a mobile milling machine is presented. The tool-point FRF is acquired and is shown to display increased flexibility of the machine compared to other cases in the literature. Chatter was detected using waterfall FFT diagrams on an accelerometer mounted on the machine head during face milling operations. Using this method, an experimental stability diagram was created for the machine. Chatter vibration was also studied using the vibration severity of machine internal sensors for spindle motor current and spindle encoder. It is shown that chatter can be rapidly detected using only the machine internal sensors.
2. Identifying mobile milling machine dynamics
A study is carried out on the mobile milling machine vibrational behavior. The objective is to get an insight into the origin of the chatter that may be observed during the milling process. Furthermore, mobile milling machines are very flexible. This section aims to demonstrate how the increased flexibility impacts the dynamics of the system.
2.1. Test bench description
The mobile milling machine used in this paper has recently been automated to improve its performance and vibrational behavior. More information on the modifications carried out on the milling machine can be found in reference [7]. The machine is a lightweight three axis vertical milling machine. Its underlying plate is bolted to a machining table. The machining table is composed of a metal plate, a block of granite and pneumatic anti-vibration mounts and can be seen in Fig. 1. The photos in Fig. 1 were taken by author J. R. at the I.U.T. of Béthune on the 9th of February 2023. The support is specifically designed to the machining system from the environment. The trajectory of the machine’s primary direction of travel is adjusted using 18 screws which allow correction to within a one-hundredth of a millimeter using a Faro Laser tracker. Dovetail slides with a worm screw system allow movement of the machine head in the three directions of space. The milling tool is a WWX400-080A07AR tool with a diameter of 80 mm, and the cutting inserts are general purpose 6NMU1409080PNER-M, both from Mitsubishi.
The spindle motor is a 2.8 kW BSM90N-3150AF brushless motor with a nominal rotational speed of 2000 rpm. The motor is equipped with an incremental encoder which is accurate to 1/1000th of a rotation. The movement of the spindle and the , and axis is generated by brushless motors which are controlled by a Geo Brick Turbo PMAC 2. This controller also acts as power electronics for the drives. It has a nominal current of 8 A with a peak current value of 16 A. By accessing the controller with a LabVIEW program using the Pcomm Server communication protocol, it is possible to obtain measurements for the spindle current and the motor velocity at an acquisition frequency of 100 Hz.
Fig. 1Mobile milling machine test bench
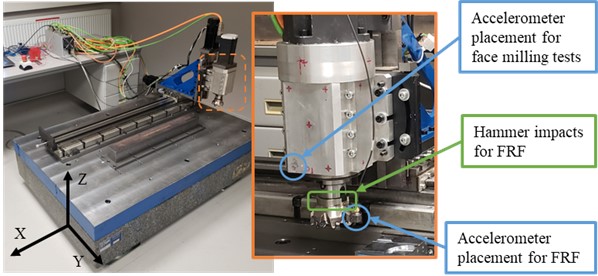
2.2. Tool point frequency response function
For a better insight into vibrational machining problems, a direct frequency response function (FRF) is curried out at the milling machine tool point. A Bruel & Kjaer 4535 B accelerometer is placed on the tool tip, as seen in Fig. 1. The structure is impacted in the tool tip using a Dytran Instruments 5850B dynamometric hammer. The measurements are acquired at using Dewesoft Sirius Mini acquisition module and the FRFs are computed using DewesoftX software. The impacts tests are acquired at 10 kHz over a duration of 5 seconds, resulting in an FRF with a frequency precision of 0.2 Hz.
Fig. 2Direct FRFs at machine tool point
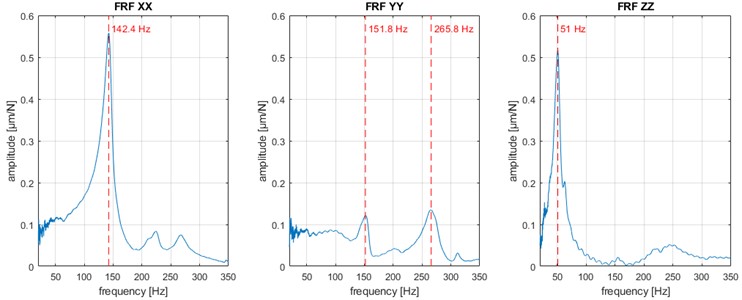
The main mode frequencies observed in the FRF are 142.4 Hz, 151.8 Hz, 265.8 Hz and 51 Hz. The mode at 51 Hz corresponds to the mode of the machining table with the anti-vibrational mounts. Conventional milling machines usually have structural modes in the range from 20 Hz to 200 Hz [8]. The structural modes are hence in a similar frequency range as conventional machines. However, the amplitude of the FRF is noticeably higher than that of modern Computer Numerical Control (CNC) machines. Indeed, references [9]–[11] all present machines with tool-point FRFs that have maximums lower than 0.17 µm/N. The present machine resembles another mobile machine tool presented in [1], [2] which has a flexibility value of 0.3 µm/N.
3. Experimental chatter stability limit
To get a better insight to the operational stability of the mobile milling machine, a series of face milling tests were carried out with different operational parameters. For each test, vibrations were measured to determine the chatter presence.
3.1. Chatter detection in a face milling operation
To determine the presence of chatter in a milling operation, the accelerometer is placed on the machine head, as close to the tool cutting edge as possible, as seen in Fig. 1. During a face milling operation, the accelerometer signal is acquired at 20 kHz using a CompactDAQ from National Instruments and LabVIEW software. The accelerometer measurement is then studied using a waterfall FFT diagram. The diagram displays FFTs of a moving time window in the accelerometer data. This type of diagram allows the viewer to observe how the measured vibrations evolve throughout the face milling operation. An FFT is calculated every 0.5 ms using a time window of 1 second, hence the calculated FFTs are sampled at 1 Hz.
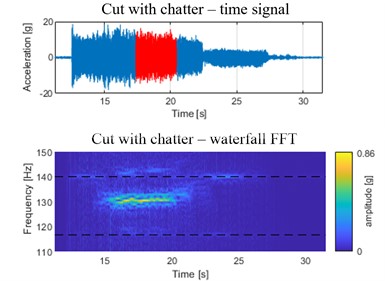
Fig. 3 depicts two such waterfall FFTs that are obtained during milling operations. Harmonics of the spindle speed are highlighted using black striped lines. In a stable cut, process vibrations should coincide with the harmonics. Indeed, the main process vibration are forced vibrations induced by the spindle. Such behaviour can be observed in Fig. 3(a). Fig. 3(b) shows a diagram where chatter is present in the cutting operation. Indeed, the calculated FFTs present a peak situated at a frequency which does not correspond to one of the spindle harmonics. The amplitude of the chatter peak is much higher than that the peaks displayed in the stable case. Indeed, in the chatter case, vibration maximum amplitude is 0.86 g whereas in the stable case, it is 0.14 g. Furthermore, once chatter vibration appears, it remains at the same frequency for the whole duration of the operation.
Furthermore, the study was focused on the portion of signal where the tool is fully immersed in the workpiece. Indeed, a MATLAB program was written to isolate the signal section where the milling machine is in such a configuration. This signal portion is determined using the time at which the tool enters the workpiece and the operational parameters.
Fig. 3Comparison of process vibration with and without chatter presence in a face milling operation
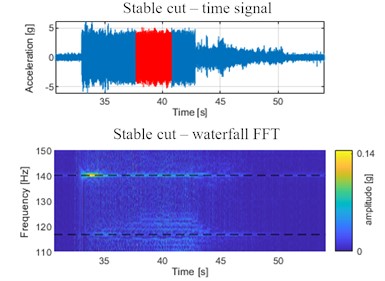
a) Face milling with depth of cut of 1 mm and spindle speed 1400 rpm process
b) Face milling with depth of cut of 1 mm and spindle speed 1400 rpm process
3.2. Experimental stability diagram
A series of face milling operations are carried out to determine the experimental stability limit for the specific tool-material-machine setup. The operation is up-milling of an 80 mm long S235JR steel plate with a 37 mm radial depth of cut. Up-milling was necessary for the face milling operation as the feed screws on the milling machine have backlash which must be compensated by orienting the cutting force. Hence the operation is chosen so that the cutting forces are always in the same direction and the machine head is not displaced during the operation.
For each test, the feed per tooth is fixed at 0.05 mm. The chosen value for the feed per tooth is lower than the recommended value by the constructor, which is from 0.10 to 0.15 mm. This feed per tooth value was specifically chosen to correspond to common on-site milling operational parameters. Seven spindle rotational speed are considered: from 900 to 1500 rpm with a 100 rpm increment. For each spindle speed, the cutting depth is increased until chatter is observed. In some cases, the process chatter caused a current overrun of the machine power electronics. This leads to a security shutdown of the machine. Hence, tests are sorted into four different categories:
– no chatter.
– low chatter: where chatter vibrations are distinguished but where the chatter spike in the FFT is lower than those of the forced vibrations.
– high chatter: where the chatter spike is the highest.
– current overload: where chatter is observed but the machine experiences a security shutdown, hence the measurement cannot be completed.
Fig. 4Differences in surface quality for different levels of vibration

a) No chatter

b) High chatter

c) Current overrun
Fig. 4 shows surface quality for three out of the four different categories. The photos in Fig. 4 were taken by author J.R. at the I.U.T. of Béthune on the 9th of February 2023. There is a visible deterioration in the machined surface quality when the face milling operation experiences chatter. However, the surface finishes of tests with chatter does not match the typical chatter surface that can be encountered in the literature [6], [8]. Indeed, it is not possible for chatter to grow to the point where such surface finish is observed as a security shutdown is triggered before.
Fig. 5Experimental stability diagram with chatter frequency specified in Hertz
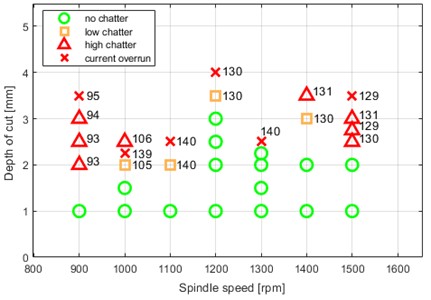
The experimental stability diagram is shown in Fig. 5. The diagram displays each face milling operation and its state of chatter stability. The limit is different for each spindle speed. This behavior is typical for chatter, where the spindle speed influences the stability limit. Indeed, the chatter stability limit usually takes on the appearance of lobes [8].
Furthermore, the chatter frequency for each test is specified in the diagram. The chatter frequency is determined by an inspection of the waterfall FFT diagrams. Hence, it is estimated that these measurements are accurate to within 3 Hz. In most cases, the chatter frequency remains fixed for a given spindle rotational speed. Furthermore, the chatter frequencies are close to but not equal to the resonance modes observed in the tool-point FRF. Indeed, this is typical of chatter behavior, where chatter is typically associated to one or multiple critical modes in the machine structure [8]. In the present case, it seems that the critical mode is the first structural mode, at 142.8 Hz. A modal analysis can be performed on the milling machine to view the critical mode shape. Once the mode shape is identified, the structure can be stiffened for more resilience to chatter.
3.3. Sensorless chatter detection
Measurements of spindle current and spindle speed were both carried out during the face milling tests presented in the previous section. The aim for such measurements was to identify a fast chatter detection method using only machine’s internal sensors. In this case two different internal sensors are used. The current is measured with an internal ammeter and the spindle rotational frequency is calculated from the motor encoder measurement.
Both sensors are measured with an acquisition frequency of 100 Hz, therefore, it is impossible to acquire precise information about the chatter vibration. Indeed, the Nyquist-Shannon criterion would not be verified as the chatter vibration is in the range of 90 Hz to 140 Hz which is too high for the sensors acquisition frequency.
Fig. 6Expression vibration severity using the RMS value on different sensors
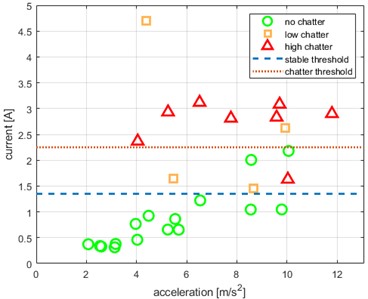
a) Current variations around the mean RMS as a function of acceleration RMS
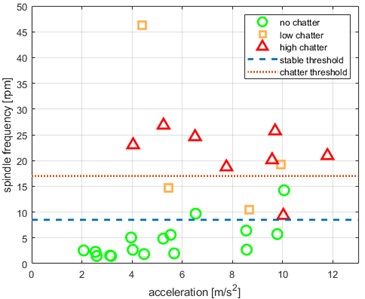
b) Spindle speed variations around the mean RMS as a function of acceleration RMS
Consequently, the Root Mean Squared (RMS) was used to quantify the vibration severity on the sensor signal. The severity on the current signal is evaluated using the RMS value of the current variations around its mean, as seen in Fig. 6(a). The spindle speed signal severity is evaluated using the RMS value of the deviation from the commanded spindle speed, as seen in Fig. 6(b). The same process was used for the accelerometer severity. Using this method, the relations between chatter stability and sensor severity were studied.
The acceleration vibration severity value is not indicative of chatter presence. Indeed, in some cases, a stable cut may have a much larger severity value than a cutting operation with process chatter. Further study of the test cases reveals that spindle rotational frequency and depth of cut have a more significant effect on this severity than the presence of chatter.
However, vibration severity for both the current and the spindle speed measurements are both highly indicative of chatter presence. Indeed, in these diagrams, stable cutting operations are grouped in distinguishable clusters. Hence, a threshold value is used to identify cutting operations with chatter. A suggestion value for the threshold is illustrated for both methods, as seen in Fig. 6. These threshold values are, respectively, 1.35 A for the current and 8.5 rpm for the spindle speed.
4. Conclusions
A study was carried out on the vibrational behavior of a mobile milling machine used for on-site machining. Measured tool point FRFs showed that machine flexibility is higher than modern CNC machines. Chatter was observed during face milling operations using an accelerometer placed in the machine tool head. Workpiece surface finish was also highly deteriorated after milling operations where chatter vibrations were detected. However, we were not able to produce distinctive chatter marks, as seen in the literature. This may also be seen as an advantage since the machine security cutoffs will occur before any significant chatter damage occurs on the milling machine or on the tool. An experimental stability limit was determined for this specific on-site mobile milling machine. Machine internal sensors were used for detecting the presence of chatter. The RMS value was calculated on the sensor signal as an indicator for chatter detection. The experimental stability limit determination of other on-site milling machines may be carried out using the same methodology.
References
-
M. Law, H. Rentzsch, and S. Ihlenfeldt, “Predicting mobile machine tool dynamics by experimental dynamic substructuring,” International Journal of Machine Tools and Manufacture, Vol. 108, pp. 127–134, Sep. 2016, https://doi.org/10.1016/j.ijmachtools.2016.06.006
-
M. Law, H. Rentzsch, S. Ihlenfeldt, and M. Putz, “Application of substructure decoupling techniques to predict mobile machine tool dynamics: numerical investigations,” Procedia CIRP, Vol. 46, pp. 537–540, 2016, https://doi.org/10.1016/j.procir.2016.04.126
-
C. Langrand, A. Albert, and M. Masset, “A magneto-rheological damper for on-site machining vibration control: from design to experimental characterization of its performance,” Vibroengineering Procedia, Vol. 34, pp. 34–38, Nov. 2020, https://doi.org/10.21595/vp.2020.21745
-
O. Legoff, M. Ritou, C. Maurin, S. Bonnet, and B. Furet, “Étude de moyens d’usinage mobiles pour pièces de grandes dimensions,” in 24th Congrès Français de Mécanique (CFM 2019), 2019.
-
N. Grossi, A. Scippa, L. Sallese, R. Sato, and G. Campatelli, “Spindle speed ramp-up test: A novel experimental approach for chatter stability detection,” International Journal of Machine Tools and Manufacture, Vol. 89, pp. 221–230, Feb. 2015, https://doi.org/10.1016/j.ijmachtools.2014.11.013
-
H. Caliskan, Z. M. Kilic, and Y. Altintas, “On-line energy-based milling chatter detection,” Journal of Manufacturing Science and Engineering, Vol. 140, No. 11, p. 11101, Nov. 2018, https://doi.org/10.1115/1.4040617
-
J. Rowe, C. Langrand, P. Deprez, E. Debarre, N. Delahaye, and R. Debuchy, “Etude du comportement vibratoire d’une fraiseuse mobile automatisée dans un contexte d’usinage sur site,” in Congres National de la Recherche des IUT, pp. 143–145, 2022.
-
J. Munoa et al., “Chatter suppression techniques in metal cutting,” CIRP Annals, Vol. 65, No. 2, pp. 785–808, 2016, https://doi.org/10.1016/j.cirp.2016.06.004
-
P. Albertelli, M. Goletti, M. Torta, M. Salehi, and M. Monno, “Model-based broadband estimation of cutting forces and tool vibration in milling through in-process indirect multiple-sensors measurements,” The International Journal of Advanced Manufacturing Technology, Vol. 82, No. 5-8, pp. 779–796, Feb. 2016, https://doi.org/10.1007/s00170-015-7402-x
-
A. Iglesias, J. Munoa, and J. Ciurana, “Optimisation of face milling operations with structural chatter using a stability model based process planning methodology,” The International Journal of Advanced Manufacturing Technology, Vol. 70, No. 1-4, pp. 559–571, Jan. 2014, https://doi.org/10.1007/s00170-013-5199-z
-
C.-Y. Lin, Y.-P. Luh, W.-Z. Lin, B.-C. Lin, and J.-P. Hung, “Modeling the static and dynamic behaviors of a large heavy-duty lathe machine under rated loads,” Computation, Vol. 10, No. 12, p. 207, Nov. 2022, https://doi.org/10.3390/computation10120207
About this article

The authors have not disclosed any funding.
The datasets generated during and/or analyzed during the current study are available from the corresponding author on reasonable request.
The authors declare that they have no conflict of interest.
