Abstract
On-site machining is a specific domain where damaging vibrations can be generated by the dynamic interaction between the tool and the workpiece. These vibrations are often the cause of the degradation of the machined part and the cutting tool. It is necessary to suppress and/or control this phenomenon. We have therefore developed in this paper our experimental investigation of the on-site machining dynamic behaviour through the acoustic field. The experimental results show the trends adopted by the main frequency peaks with numerous experimental conditions while on-site machining. This first approach is part of a larger goal, which is the in-situ detection of on-site machining defects through Acoustic.
Highlights
- First results regarding the acoustic monitoring of the on-site milling machine dynamic behaviour
- Description of the nominal phase selection process of our on-site machining operation thanks to the acoustic
- Study of the influence of the feed rate, the cutting speed, and the depth of cut on the three predominant frequencies of the sound spectra
1. Introduction
In today’s industrial world, corrective and preventative maintenance play a key role by limiting the production losses. This is even more so if industrialists do not have the possibility to move their defective equipment to rehabilitate it. To overcome these difficulties, one activity exists: the on-site machining. It consists of carrying out all types of machining operations to repair and restore non-removable parts of equipment, directly on industrial plants, using portable machines.
However, due to the lightness of these portable machines, important defaults could appear such as chatter [1-3], machine failure [4] or occurrences of abnormal machining conditions [5-7]. To study those defaults, we focus on the sound produced while machining and especially with the on-site machining, which is a key source of information. Indeed, microphones are very suitable for chatter and default detection in milling, as their sensitivity to the onset of chatter is comparable to that of expensive sensors such as plate dynamometers, displacement probes and accelerometers.
The authors’ aim is to present our first results regarding the acoustic monitoring of the on-site milling machine dynamic behaviour. We describe the nominal phase selection process of our on-site machining operation thanks to the acoustic. Finally, we study the influence of the feed rate, the cutting speed, and the depth of cut on the three predominant frequencies of the sound spectra.
2. Methods
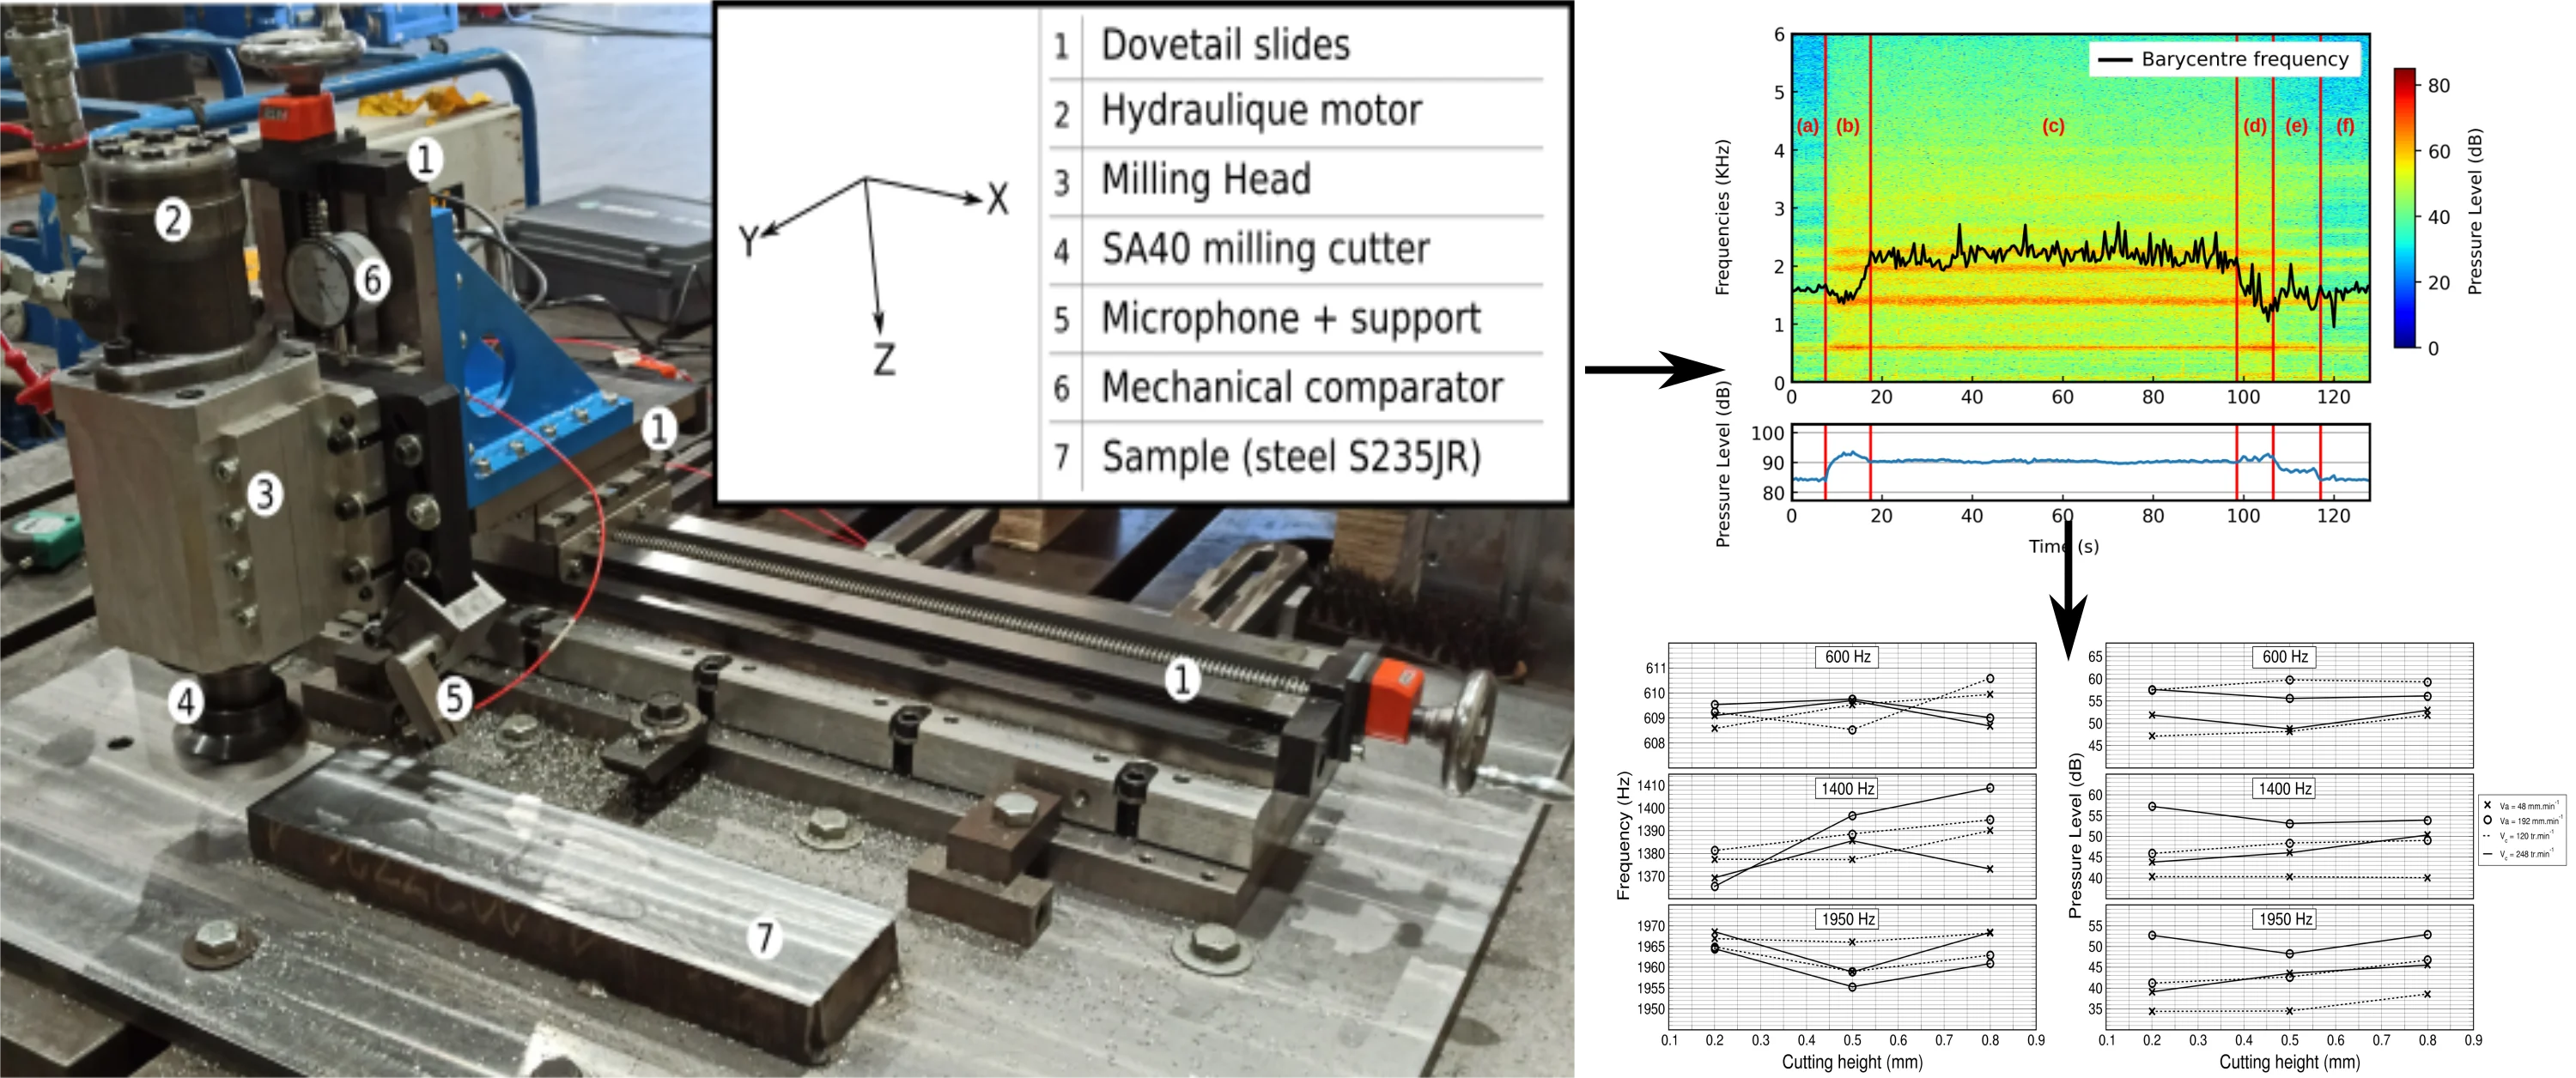
A setup to evaluate the efficiency of our on-site machining dynamic behaviour through the acoustic field was established. Shown in Fig. 1 is a light milling machine frequently used on on-site machining and a machined sample S235JR fixed by six welding points on a common plate. The light milling machine is equipped with three dovetail slides (, and axis) of length 1250, 300 and 300 mm, respectively. The axis is equipped with a demountable electric power feed ALGS-AL310S. The and axis each have a manual drive. The milling head was fixed on the axis dovetail slide. This head was powered by an OMP100 hydraulic motor that drives a milling cutter SA40. The cut was made with five Kennametal KC725M (TiAlN-PVD coated carbide) machining inserts, reference [ISO SEPT1404AEENGB2]. To be sure of the cutting experimental conditions, we adjusted the position of each light milling machine component with a Faro laser tracker [8].
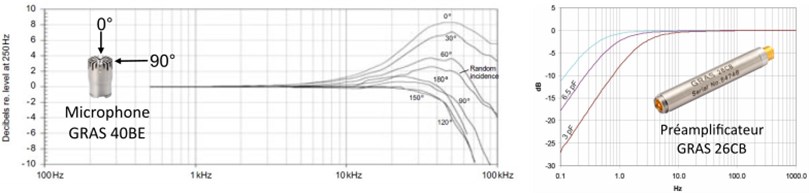
To carry out the acoustic acquisitions, we use a GRAS microphone, reference [40BE] (Fig. 2). It is an omnidirectional microphone of 1/4" size with a useful operating range of between 4 Hz and 100 kHz. The dynamic range of the microphone is between 30 and 168 dB(A) (160 dB with a CCP pre-amp). The microphone has a sensitivity of 4 mV/Pa and an electrical capacitance of 5 pF. An important feature of this microphone is its frequency response. There is a strong dependence between the response of the microphone and its angle of incidence with the acoustic source. This should be considered when processing the results. However, the effect on the acoustic signal below 30 kHz is relatively small. To ensure optimal use, we couple this microphone with a GRAS 26CB preamplifier. The preamplifier operates over a frequency range of 2.5 Hz to 200 kHz. The sensitivity at very low frequencies is entirely dependent on the electrical capacity of the microphone used. Since the electrical capacity of our microphone is 5 pF, we restrict our useful frequency range of study between 7 Hz and 30 kHz.
Fig. 1The experimental setup for the acoustic dynamic behaviour of the on-site milling machine
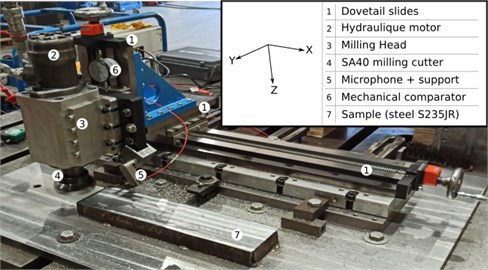
Fig. 2Frequency transfer function of the microphone and its amplifier. They were provided by the company Alliantech
We have set our microphone as close as possible to the milling head in order to study the cutting phenomena as well as the dynamic behaviour of the milling machine. A support was therefore manufactured to attach the microphone onto the milling head and direct it towards on the cutting inserts. The acoustic responses of the system are acquired and processed using a compact NI cDAQ-9174 DAQ chassis, a 9122 module and a LabView module dedicated to sound and vibration analysis.
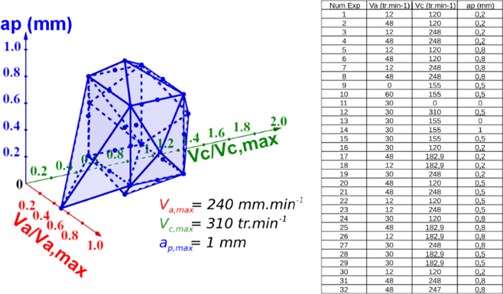
To achieve our goals, we need to study the acoustic response of the nominal operation of the machine. We also need to understand the influence of each of the relevant parameters on the on-site machining. Due to the significant number of experimental parameters, we must restrict ourselves to the variations of the following parameters: Cutting speed, feed rate and depth of cut. These parameters are fixed and controlled with, respectively, a laser tachometer and mechanical comparators. Our experimental conditions are synthesised using a phase space (Fig. 3). Also, each point represents an experiment with fixed study parameters. We set the maximum values that are the feed rate 240 mm.min-1, the cutting speed 310 tr.m-1 and the depth of cut 1 mm. The data are processed by time analysis, time-frequency analysis, sound pressure level evolution as well as the evolution of the barycentre frequency.
Fig. 3Phase space comprising the set of experimental cases studied as a function of the depth of cut (ap), the cutting speed (Vc) and the feed rate (Va). The detailed experimental conditions have been listed in the table on the right
3. Results and discussions
To select the time interval when the machine is in nominal operation, we focus on the evolution of the pressure level and the Barycentre Frequency. We illustrated in Fig. 4 an example where the rapid variation of these parameters allows us to divide our signal into several sections. We identify six machining phases. The (a) and (f) zone is the rotation of only the cutting motor. The (b), (d) and (e) zone are the entry and the exit of the milling cutter.
Fig. 4Temporal representation of the short-time Fourier transform (STFT) with the frequency barycentre and the pressure level for the following cutting parameters: Va= 191 mm.min-1, Vc= 247 tr.min-1 and ap= 0.8 mm
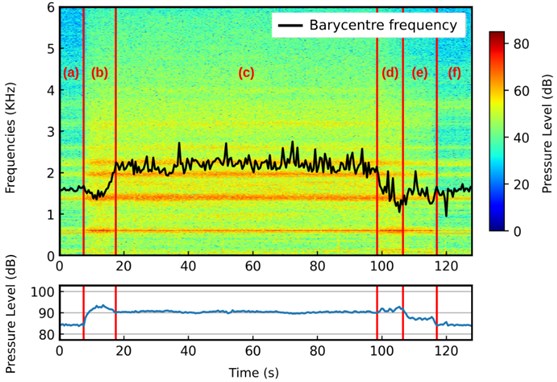
The last time interval is the (c) zone which is the nominal operating phase. This zone corresponds to the time interval when the milling cutter is in full material. The sound pressure level measured by the microphone is relatively constant. The average barycentre frequency is relatively high compared to the machine operation without machining.
The highest frequencies are in the range of 70 to 1950 Hz. However, the low frequencies are difficult to use despite the high-pressure level. It is due to the relatively high signal to noise ratio. In the following, we will focus on the evolution of the three peaks with the highest-pressure level. The peaks at 606.0 Hz, 1398.4 Hz and 1946.5 Hz are retrieved with a gaussian fit. They are typical for the investigated machinery and the selected machined tool. Indeed, those frequency peaks value depends only on the experimental cutting conditions and the on-site machine used as shown in Fig. 4(a). Furthermore, the behaviour of the frequency peaks does depend on the experimental cutting conditions. It does not depend on the dimensions of the workpiece and the material as shown in Fig. 4(b, c, d, and e).
To study the cutting speed influence, we focus on the evolution of the barycentre frequency and the pressure level for each of the three predominant peaks (see Fig. 5). The experimental conditions are: 48 mm.min-1 (cross), 192 mm.min-1 (round), 0.2 mm (dash) and 0.8 mm (solid line).
Fig. 5Evolution of frequencies and sound pressure levels as a function of cutting speed for each of the three predominant frequencies. The experimental conditions are: Va= 48 mm.min-1 (cross), Va= 192 mm.min-1 (round), ap= 0.2 mm (dash) and ap= 0.8 mm (solid line)
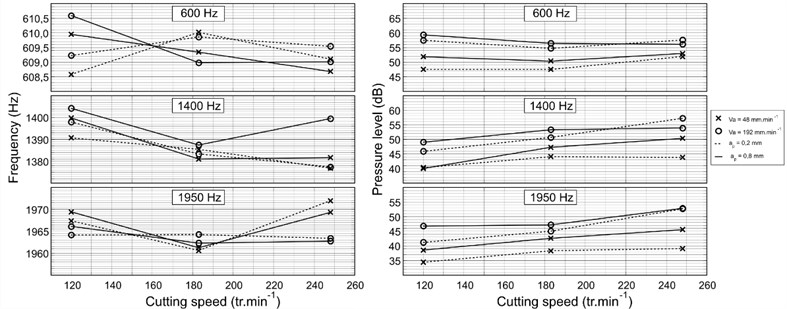
It can be seen that for the three predominant pressure peaks: the higher the cutting speed, the higher the sound pressure level (Fig. 5). It corresponds to the evolution of the overall sound pressure level, which also increases with the cutting speed. We cannot reach any general conclusions regarding the variation of the frequency peaks’ position (Fig. 5). Nevertheless, we notice a slight increase of the barycentre frequency as a function of the cutting speed for all the signals.
We then investigate the influence of the cutting speed on the frequency barycentre and the sound pressure level, which is illustrated by Fig. 6. The experimental conditions are: 120 rpm (cross), 248 rpm (round), 0.2 mm (dash) and 0.8 mm (solid line).
We observe the following for the three predominant pressure peaks: the higher the feed rate, the higher the sound pressure level (Fig. 6). This is in line with the behaviour of the overall sound pressure level, which also increases with the cutting speed.
As for the variation in the position of the frequency peaks, we are unable to draw any general conclusions (Fig. 6). We also observe similar behaviour for the barycentre frequency with the feed rate for all signals.
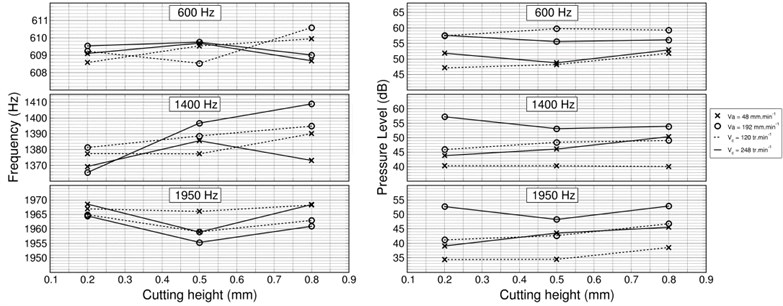
Similarly, the influence of the cutting depth is studied through the variation of the same parameters (see Fig. 7). The experimental conditions are: 48 mm.min-1 (cross), 192 mm.min-1 (round), 120 rpm (dashed) and 248 rpm (solid line).
For each of the three predominant frequency peaks, an increase in cutting depth results in an increase in the sound pressure level (Fig. 7). This is in line with the development of the overall sound pressure level, which also increases with the cutting depth. However, there are also some situations in which this is not the case.
The variation in the position of the frequency peaks does not show any general trends (Fig. 7). Indeed, we observe a distinct behaviour for each of the peaks. Nonetheless, we observe a clear increase of the barycentre frequency with the cutting height for all signals.
Fig. 6Evolution of frequencies and sound pressure levels as a function of the feed rate for each of the three predominant frequencies. The experimental conditions are: Vc= 120 rpm (cross), Vc= 248 rpm (round), ap= 0.2 mm (dash) and ap= 0.8 mm (solid line)
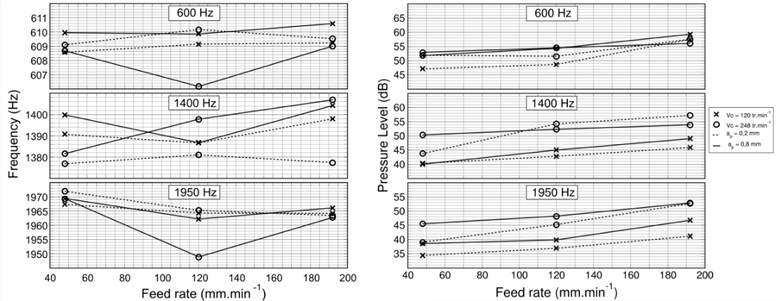
Fig. 7Evolution of frequencies and sound pressure levels as a function of the cutting height for each of the three predominant frequencies. The experimental conditions are: Va= 48 mm.min-1 (cross), Va= 192 mm.min-1 (round), Vc= 120 rpm (dashed) and Vc= 248 rpm (solid line)
4. Conclusions
This paper presents the design of a test bench for the acoustic measurements of a portable milling machine dynamic behaviour used for on-site machining. Thanks to this test bench, we successfully extracted the different operating phases of our machining operation. The frequency and time study allowed us to extract the most important operating frequencies of our on-site machining. The wide range of experimental conditions also allowed us to study the influence of feed rate, cutting speed and depth of cut on these frequencies. The acoustic signatures knowledge can be used to improve the quality of the machining process. In fact, the understanding of the dynamic behaviour of the frequency peaks will allow us to better follow their evolution upon different cutting conditions. This applies perfectly to on-site machining in which the cutting conditions differ at every operation. Unfortunately, we did not find any trends in the evolution of the frequency peaks except a clear increase in the barycentre frequency as a function of the feed rate, cutting speed and depth of cut for all the signals.
More detailed analysis will come later through the development of a dual-microphone analysis to suppress industrial noise. In addition, work on the detection of on-site machining defects using acoustics will be added. Finally, this approach of defaults detection through acoustic will play its full role for on-site machining activity once an active control system has been set up based on those results.
References
-
E. Budak and Y. Altintas, “Analytical prediction of chatter stability in milling-part I: general formulation,” Journal of Dynamic Systems, Measurement, and Control, Vol. 120, No. 1, pp. 22–30, Mar. 1998, https://doi.org/10.1115/1.2801317
-
G. Quintana and J. Ciurana, “Chatter in machining processes: A review,” International Journal of Machine Tools and Manufacture, Vol. 51, No. 5, pp. 363–376, May 2011, https://doi.org/10.1016/j.ijmachtools.2011.01.001
-
A. Maamar, T.-P. Le, V. Gagnol, and L. Sabourin, “Modal identification of a machine tool structure during machining operations,” The International Journal of Advanced Manufacturing Technology, Vol. 102, No. 1-4, pp. 253–264, May 2019, https://doi.org/10.1007/s00170-018-3172-6
-
X. Chen, S. Wang, B. Qiao, and Q. Chen, “Basic research on machinery fault diagnostics: Past, present, and future trends,” Frontiers of Mechanical Engineering, Vol. 13, No. 2, pp. 264–291, Jun. 2018, https://doi.org/10.1007/s11465-018-0472-3
-
S. Takata, J. H. Ahn, M. Miki, Y. Miyao, and T. Sata, “A sound monitoring system for fault detection of machine and machining states,” CIRP Annals, Vol. 35, No. 1, pp. 289–292, 1986, https://doi.org/10.1016/s0007-8506(07)61890-3
-
K. Cheng and D. Huo, Springer Series in Advanced Manufacturing. London: Springer London, 2009, pp. 7–20, https://doi.org/10.1007/978-1-84628-368-0_2
-
H. A. Kishawy, H. Hegab, U. Umer, and A. Mohany, “Application of acoustic emissions in machining processes: analysis and critical review,” The International Journal of Advanced Manufacturing Technology, Vol. 98, No. 5-8, pp. 1391–1407, Sep. 2018, https://doi.org/10.1007/s00170-018-2341-y
-
Faro, https://www.faro.com
About this article

