Abstract
Russia has the largest volume of natural gas reserves in the world. Recoverable natural gas reserves amount to about 67 trillion cubic meters, according to the Ministry of Natural Resources and Environment of the Russian Federation for 2023. In recent years, the development of the Unified Gas Supply System has been growing rapidly. Since 2021 the Government of the Russian Federation has been actively introducing draft laws and regulations related to the scaling of the country’s gasification. In June 2021 came out the Federal Law No. 184-FZ, which instructed the Government of the Russian Federation to adopt regulations aimed at implementation of provisions of free gasification of the country [1]. In September 2021 there was issued Decree No. 1547, [2] approving the new Rules for connecting gas-using equipment and capital construction facilities to gas distribution networks, which introduces the concept of pre-gasification. It is worth noting that new gas mains, compressor stations (CS) are put into operation, active reconstruction of the existing shops with exhausted gas compressor units (GCU) is carried out. One of the most urgent issues of the gas industry today is the efficient use of energy resources. Besides using the energy of flue gases from gas turbine drive of GPA, energy at gas throttling at gas distribution stations and other methods of energy saving, the significant role is played by the effective operation of air coolers of gas (ACG), the operation of which affects the reliable transportation of gas in the main gas pipeline (MG). The paper analyzes the methods of technical condition of gas air cooling devices of “Iceberg” type operated at the production site of the booster compressor station of “Gazprom Dobycha Nadym” LLC. The thermal efficiency of air coolers with all fans turned on and off was determined for the coldest and hottest months of the year. The electric energy savings of the frequency controlled drive (VFD) were calculated.
1. Introduction
Cooling the natural gas at the compressor station outlet before it enters the MG is the most important process for transporting the blue fuel. Up to 80 % of the compressor station electricity is consumed by the air cooler drives. Thermal capacity of air coolers must provide temperatures, the values of which do not violate the stable operation of gas pipelines, as well as prevent hydrate formation, which can lead to blockage of the pipe cross-section.
In this paper, we consider air-cooled gas coolers of “Iceberg” brand. This apparatus is designed for cooling natural gas at compressor stations, installed at MG, in conditions of the Extreme North, including sea climate. Today “Iceberg” is successfully used at the most important sites of gas industry, including such sites of Gazprom subsidiaries as Russkaya CS - the starting point of the export gas pipeline “Turkish Stream” (“Iceberg-32.0”), the Portovaya CS - the starting point for gas transportation to the offshore section of the Nord Stream gas pipeline (“Iceberg-25.0”), the Slavyanskaya CS - the head station of the Nord Stream-2 offshore gas pipeline (“Iceberg-25.0”). In particular, Icebergs are operated at the Cenomanian-Aptian deposits of the Bovanenkovo OGCF, as well as at the Bovanenkovo-Ukhta, Ukhta-Torzhok, Gryazovets-Vyborg, Sakhalin-Khabarovsk-Vladivostok trunk pipelines.
2. Нeat transfer efficiency
Air-cooled units use an outer finned tube made of rolled aluminium. The practice promotes an increase in the heat transfer coefficient, by increasing the outer surface area by up to 20 times. Unfortunately, in the process of operation, due to intensive contamination of tube bundles and deformation of pipes, heat exchange units change their characteristics. To investigate this issue, the heat transfer coefficient for all fans on and off was calculated for the coldest and hottest month of the year [3].
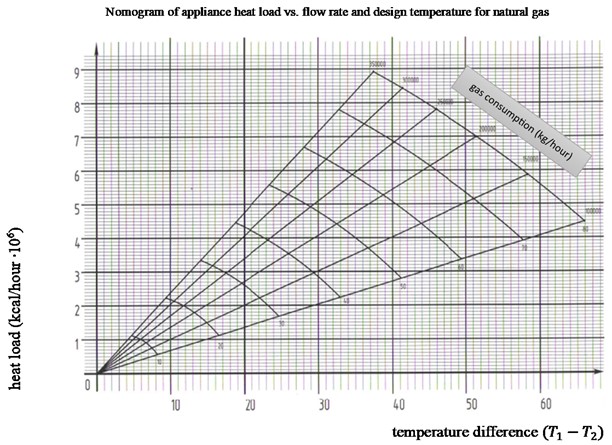
The heat transfer coefficient indicates how much heat is transferred per unit time from a heated to a less heated medium [4]. Heat transfer coefficient was determined by the ray characteristics of air handling unit of "Iceberg" type 12,5-B1(B3)-BT1/6-1-12 (Fig. 1). In the work one air-cooled gas apparatus of the first stage of the two-stage cooling of DCS of the second stage of the gas field is considered.
Fig. 1Radiation characteristics of air-cooled “Iceberg” units. T1 – temperature at the entrance to the air-cooled gas coolers, °C, T2 – temperature at the outlet of the air-cooled gas coolers, °C
The actual contamination of the heating surface of the AHE, is equal to the ratio of the actual heat transfer coefficient to the nameplate coefficient:
Calculation results are presented in Tables 1, 2.
As can be seen from tables 1 and 2, the thermal efficiency ranges from 0.61 to 0.68. For new units 1. On the in-service AHEs, which are kept in good condition, the coefficient is 0.9. Since 0.9, then the AHE needs cleaning.
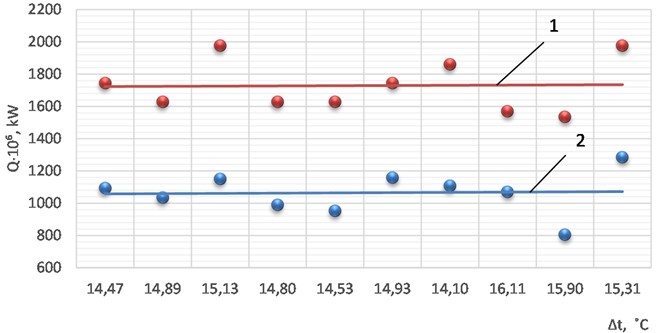
Figs. 2 and 3 show a comparison between actual and nameplate heat gains with all fans on in winter and summer. The significant difference between the actual and nameplate heat load characteristics also suggests the need for cleaning of the heat-exchange sections of the air cooler.
Table 1Winter period with fans fully switched on
Day | , gas consumption (kg/hour) | Temperature difference, °С | Heat transfer coefficient, | Heat transfer coefficient, | |
1 | 312537,1 | 10,17 | 11,39 | 17,64 | 0,65 |
2 | 314409,2 | 10,59 | 11,49 | 17,70 | 0,65 |
3 | 311169,8 | 10,83 | 11,38 | 17,42 | 0,65 |
4 | 311915,7 | 10,84 | 11,43 | 17,81 | 0,64 |
5 | 311894,2 | 10,31 | 11,46 | 17,56 | 0,65 |
6 | 311658,5 | 10,53 | 11,53 | 17,65 | 0,65 |
7 | 312379,6 | 10,10 | 11,54 | 17,23 | 0,67 |
8 | 311899,2 | 11,11 | 11,53 | 17,38 | 0,66 |
9 | 312611,1 | 11,76 | 11,93 | 17,61 | 0,68 |
10 | 312008,0 | 12,11 | 11,54 | 17,21 | 0,67 |
Table 2Summer period with fans fully switched on
Day | , gas consumption (kg/hour) | Temperature difference, °С | Heat transfer coefficient, | Heat transfer coefficient, | |
1 | 305960,2 | 15,5 | 10,60 | 16,78 | 0,63 |
2 | 313444,7 | 13,2 | 10,73 | 17,19 | 0,62 |
3 | 309422,3 | 16,1 | 10,66 | 16,66 | 0,64 |
4 | 308740,8 | 12,8 | 10,65 | 16,39 | 0,65 |
5 | 312196,7 | 13,2 | 10,71 | 16,49 | 0,65 |
6 | 315171,2 | 14,7 | 10,76 | 17,16 | 0,63 |
7 | 312273,3 | 15,4 | 10,71 | 17,46 | 0,61 |
8 | 315091,2 | 13,5 | 10,76 | 17,34 | 0,62 |
9 | 306857,9 | 13,1 | 10,60 | 17,19 | 0,62 |
10 | 306857,9 | 16,7 | 10,61 | 16,88 | 0,64 |
Fig. 2Comparison of actual and nameplate heat flows: 1, 2 – trend lines of the nameplate and actual heat input characteristic Q, kW at all switched on fans in the hottest month; Δt – gas temperature difference in the inlet collector and at the outlet of the air cooler, °С; Q∙106 – heat load of the air cooler, kW
Consider the heat transfer coefficient of the air handling unit with all fans switched off in summer and winter operation. According to VNIIGAZ calculation methodology, it was determined that gas cooling is more intensive in winter operation due to low ambient temperature [5].
As can be seen from Tables 3 and 4, the thermal efficiency varies from 0.61 to 0.67, which also indicates the need for timely cleaning of the heat exchange sections.
Fig. 3Comparison of actual and nameplate heat flows: 1, 2 – trend lines of the nameplate and actual heat input characteristic Q, kW at all switched on fans in the coldest month; Δt – difference between gas temperature in the inlet collector and at the outlet of AWO, °С; Q∙106 – heat load of the air cooler, kW
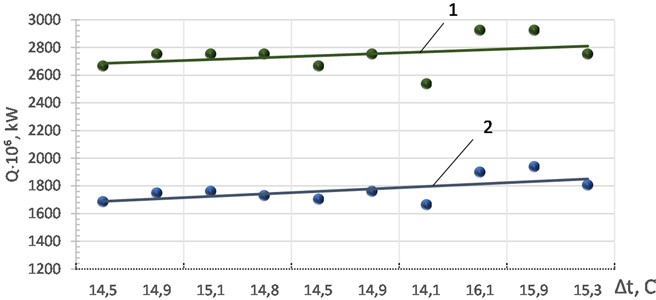
Table 3Summer period, fans completely off
Day | Atmospheric air temperature, ℃ | Heat transfer coefficient, | Heat transfer coefficient, | |
1 | 12,34 | 2,01 | 3,05 | 0,66 |
2 | 11,0 | 2,05 | 3,09 | 0,66 |
3 | 10,8 | 2,05 | 3,09 | 0,66 |
4 | 6,2 | 2,16 | 3,21 | 0,67 |
5 | 7,3 | 2,13 | 3,18 | 0,67 |
6 | 9,1 | 2,09 | 3,13 | 0,67 |
7 | 10,1 | 2,07 | 3,11 | 0,66 |
8 | 8,8 | 2,10 | 3,14 | 0,67 |
9 | 10,4 | 2,06 | 3,10 | 0,61 |
10 | 5,4 | 2,18 | 3,23 | 0,65 |
Table 4Winter period, fans completely off
Day | Atmospheric air temperature, ℃ | Heat transfer coefficient, | Heat transfer coefficient, | |
1 | –33,29 | 2,69 | 4,05 | 0,66 |
2 | –32,89 | 2,67 | 4,03 | 0,66 |
3 | –35,28 | 2,74 | 4,10 | 0,67 |
4 | –33,41 | 2,68 | 4,04 | 0,66 |
5 | –27,98 | 2,68 | 4,04 | 0,66 |
6 | –22,47 | 2,55 | 3,90 | 0,65 |
7 | –22,38 | 2,56 | 3,91 | 0,65 |
8 | –21,82 | 2,53 | 3,89 | 0,65 |
9 | –18,32 | 2,52 | 3,88 | 0,65 |
10 | –22,34 | 2,56 | 3,91 | 0,65 |
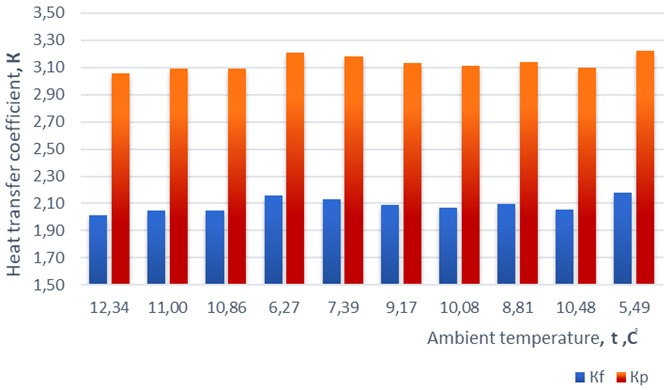
Figs. 4 and 5 show a significant difference between the actual heat transfer coefficient and the nameplate heat transfer coefficient for natural convection in winter and summer.
Due to different climatic conditions, different geographical locations, the operating mode of the air handling unit may differ. The cooling units mainly affect the thermal mode. The temperature of the pumped gas tends to follow the fluctuations of the outside air temperature.
Fig. 4Comparison of actual and nameplate heat transfer coefficient during the first 10 days of the coldest month: K – the heat transfer coefficient; t – the ambient temperature, °C
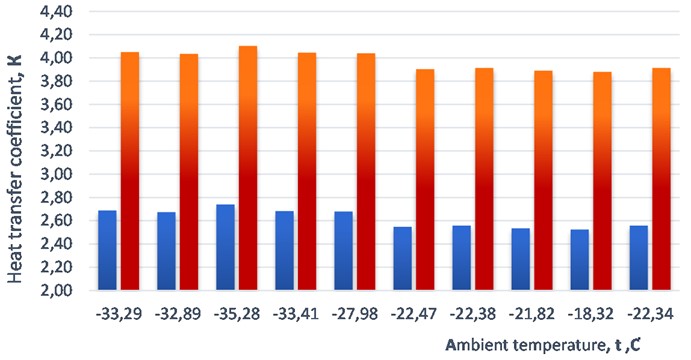
Fig. 5Comparison of actual and nameplate heat transfer coefficient during the first 10 days of the hottest month: K – the heat transfer coefficient; t – the ambient temperature, °C
3. Effective regulation of apparatuse
In the northern areas where the pipelines are laid, the ambient air temperature is low. It is worth noting that in winter, when the fans are fully switched on, the units are almost never used, as there is a risk of hydrate formation in the pipes. Moisture present in natural gas can form hydrates when reacting with the gas. This leads to an increase in thermal resistance and narrowing of the flow area. To solve this problem, recirculation systems are provided in the AHU.
On the other hand air temperatures in southern regions are much higher than in northern regions. As a result, it is necessary to increase the number of fans in operation, which increases the electricity and fuel gas costs. In these climatic conditions the fouling of the tube bundles is increased, which results in a reduction of the overall heat transfer coefficient , as mentioned earlier. The thermal efficiency of the apparatus decreases.
Technologies aimed at regulation of operation modes of cooling systems are applied, namely: change of blade angle, step-by-step regulation based on fans on/off, regulation of rotational speed of impellers. Frequency control together with reversing allows to eliminate the possibility of hydrates formation in the tube bundles of heat exchange sections, to maintain the required gas temperature with high accuracy [6].
Switching on or off a certain number of fans is one of the ways of operative regulation of gas temperature at the ACHE outlet. The fans in a section are positioned close to each other. Close arrangement of the units worsens the heat exchange process. In summer a great number of fans have to be switched on, which causes interaction of air flows at the impellers inlet.
If a single fan is running, the air is sucked in from all sides. In case of simultaneous operation of all fans the suction is limited to only two sides. Then the cross-sectional area at the impeller inlet decreases and the aerodynamic drag increases. As a consequence, the flow of each fan decreases .
The inclusion of one or the other fan is mainly taken as a function of the running hours of the electric motors.
If all fans are switched on, the overall thermal efficiency is increased by 50-65 %, but the energy costs are doubled.
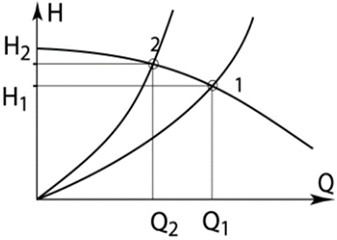
Fig. 6Combined fan and air path characteristic: 1 – air path characteristic at single fan operation; 2 – air path characteristic of a single fan at full load of air handling unit sections
Operation with one fan per staggered section has been considered. Fig. 7 shows a diagram of the airflows generated by the fans.
Fig. 7Diagram of air flows in the space below the air handling unit when the fans are switched on in staggered order
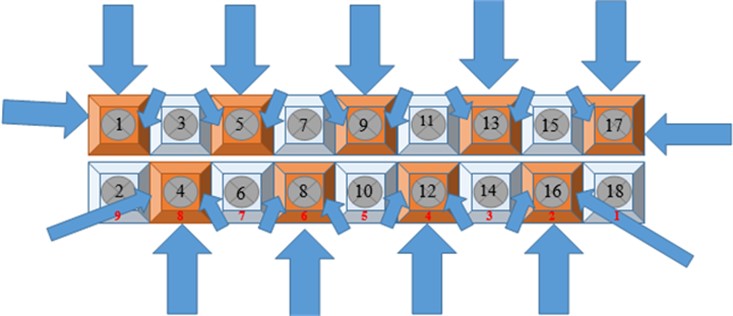
The fans must be switched on in the following order to obtain the required air flow: 1, 4, 5, 8, 9, 12, 13, 16, 17. Then switch on one fan per section in staggered order on the remaining sections.
Fan blade control is used to control the energy costs of compressor stations. The rotation of the blades causes a change in the amount of air flowing through the impellers of the fans. At the same time an increase in pitch angle results in an increase in air flow and a greater cooling depth [7].
The technology of fans impeller speed control becomes of great importance due to the necessity to maintain the temperature of the transported gas at the required level.
This technology makes it possible to save energy resources when operating at modes that do not require the maximum possible cooling of the gas for a given air temperature at that moment. Another advantage is the smooth start-up of the electric motor [8].
Table 5 shows the power consumption and performance of the fans, depending on the angle of the fan blades.
Using the data in Table 5, a graph is plotted as a function of the power input against the relative airflow for the various control methods. The relative flow rate can be found from the formula:
Table 5Measurement results
Installation angle | Power consumption, kW | Capacity, m3/s |
17 | 13 | 43,83 |
14 | 11,5 | 38,5 |
12 | 9,6 | 32 |
10 | 7,5 | 28,6 |
8 | 6,5 | 26,5 |
is the fan capacity at normal motor power. For the power consumption with frequency control, the following expression can be written:
Fig. 8Power consumption with different control methods
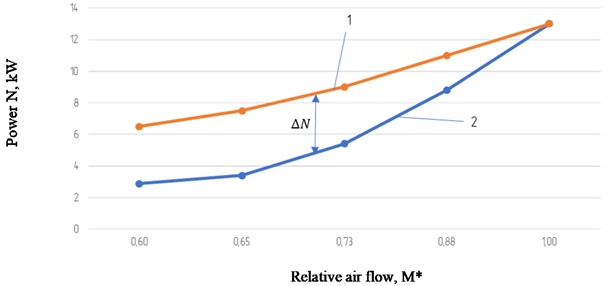
Line 1 corresponds to the graph of power input versus relative flow . Line 2 is the graph of power consumption with frequency control. The difference between curves 1 and 2 is the power savings when a variable speed drive is installed.
The angle of attack of the fan blades is changed twice a year – for winter and summer modes, so we divide the power saving calculation into two periods of 6 months.
In winter mode ( 5°), power saving will make 6.5 kW; in summer mode (12°) – 6 kW. The power saving coefficient is calculated according to the formulas:
An analysis of air-cooled gas utilisation by month, based on 12 months of operation, shows an average utilisation factor of 0.48:
Electricity savings are defined as the product of:
where is capacity of one electric motor, – number of electric motors; – number of calendar hours.
For the workshop consisting of 22 air-cooling units with 132 electric motors with power 13 kW each, we have the following value of energy saved
13∙132∙0,5∙0,48∙4380 = 1803859,2 kWh.
13∙132∙0,46∙0,48∙4380 = 1659550,464 kWh.
3463409,664 kWh.
4. Conclusions
The main way to keep the heat exchanger tubes in good condition is to clean them in good time. It is mainly the first few rows along the airflow that get dirty.
The interstitial space is usually contaminated by mechanical and organic particles and dust. Subsequently, the layers of dirt are compacted and the heat transfer process is impaired.
The pipe bundles are clogged internally with oil from the seals of the gas pumping units as well as grease from the seals of the shut-off valves. The fouling leads to a reduction in the overall heat transfer coefficient of the finned tubes.
For internal and external surface cleaning hydrodynamic cleaning has been suggested as the most effective, environmentally friendly and cheapest method.
Cleaning of internal surfaces of heat-exchange tubes contributes to reduction of hydraulic resistance, as well as to increase the coefficient of heat transfer from the product [9].
The hydrodynamic cleaning technology is based on the principle of a water jet that is forced onto the surface under high pressure, separating impurities from the surface.
One of the challenges in the development of the gas industry is optimal gas cooling in compressor stations.
The perpendicular flow of the staggered tube bundle with the air stream is a strategic area for improving energy efficiency. It is important to note the cleaning of the outer and inner surface of the tubes at optimum intervals, aimed at restoring the performance of the air handling unit [10].
Frequency control together with reversing allows to exclude the possibility of hydrates formation in the tube bundles of heat exchange sections, with high accuracy to maintain the required gas temperature. Together with the method of rotational speed control of impellers, the gas temperature after AVO provides not only the reliable operation of gas pipelines and GCUs, but also the effective use of all technological equipment of gas production and transportation.
The paper presents a methodology for experimental evaluation of thermal efficiency of gas automatic water shut-off valve (AWO) in a gas transmission system during different seasons of the year.
As a result of the conducted studies, it was revealed that the thermal efficiency of the AHE of “Iceberg” type of gas cooling is below the permissible value. Calculation of heat transfer coefficient and comparison with air-cooling unit passport indicators were calculated.
References
-
“On Amendments to the Federal Law On Gas Supply in the Russian Federation.” The federal Law of the Russian Federation of 01.06.2021 N 184-FZ. http://publication.pravo.gov.ru/document/view/0001202106110031
-
“On Approving the Rules for Connecting (Technological Connection) of Gas Using Equipment and Capital Construction Facilities to Gas Distribution Networks and Declaring Invalid Some Acts of the Government of the Russian Federation.” Decree of the RF Government dated 13 September 2021 N 1547. https://base.garant.ru/402805164/
-
Lyalin and V. E. V. E. Lyalin, “Automatic control of natural gas cooling process,” in Proceedings of International Symposium Reliability and Quality, 2016.
-
O. A. Stepanov, Thermal and hydraulic calculation of air-cooled heat exchange apparatuses: guidelines. Tyumen: RIO GOU VPO TyumGASU, 2009.
-
Methodology of Estimation of Technical Condition of Air-Cooled Gas Apparatuses. Ufa: OOO Gazprom transgaz Ufa, 2009.
-
M. M. Shpotakovsky, “One of the ways of energy saving at the pipeline transport of natural gas,” Technology of oil and gas, Vol. 6, pp. 59–64, 2012.
-
A. V. Krupnikov, “Analysis of operating regimes regulation efficiency for gas air cooling units at compressor stations,” Chemical and Petroleum Engineering, pp. 19–23, 2010.
-
I. A. Yanvarev, A. D. Vanyashov, and A. V. Krupnikov, “Thermal Management Technologies Development for the Gas Transport on the Gas-main Pipeline,” Procedia Engineering, Vol. 113, pp. 237–243, 2015, https://doi.org/10.1016/j.proeng.2015.07.327
-
A. M. Nevolin, “Improving the efficiency of air cooling devices for gas turbine oil installations,” Ekaterinburg, 2016.
-
I. A. Yanvarev, “Increasing the efficiency of the gas cooling units of booster station with a decrease in the volume of compression,” Compressor Equipment and Pneumatics, Vol. 8, pp. 22–27, 2015.
About this article

The reported study was funded by the Russian Science Foundation according to the research project No. 22-29-00970, https://rscf.ru/project/22-29-00970/.
The datasets generated during and/or analyzed during the current study are available from the corresponding author on reasonable request.
Alsu Arslanova: conceptualization, data curation, formal analysis. Regina Faruhshina: conceptualization, supervision. Rimma Khatmullina: writing – original draft preparation.
The authors declare that they have no conflict of interest.
