Abstract
Signal detection has a wide range of practical applications. Compared with traditional weak signal detection, the nonlinear effect of noise in the bistable system is typical and easy to extend, so bistable stochastic resonance detection technique has a wider applicability. In this paper, the multi-frequency weak signals detection based on under-sampling bistable stochastic resonance is studied. Based on the theory of bistable stochastic resonance, a simulation model is established to simultaneously detect multiple low-frequency weak signals. The spectrum of input and output signals is obtained through numerical simulation calculation, and the system characteristics are analyzed. When the large parameter signal does not meet the adiabatic approximation theory, the appropriate sampling coefficient can be selected to directly under-sample the input signal to make it conform to the conditions, and then the scale inverse transformation can be carried out. Finally, combined with the simulation analysis, the correctness of the under-sampling bistable stochastic resonance system to detect the multi-frequency weak signals is verified, the sampling rate is reduced, and the complexity is effectively decreased.
Highlights
- SNR with noise intensity D under different signal amplitudes
- Time domain/spectrum diagram of the output of three signals
- Time domain/spectrum diagram of the output signal after under-sampling
1. Research background
Noise interferes with digital signal systems, such as communications, control, autopilot and other electronic systems. In the field of signal detection, researchers have been looking for new techniques to separate signal from noise, to overcome the negative impact of noise on the system, so as to extract signal. It is relatively difficult to detect the weak signal submerged by noise, which generally requires the use of electronic information theory and related mathematical methods. In the field of digital signal processing, the main detection methods include time domain average method, filtering technology, wavelet transform, chaos theory and Wiener filter etc. In the previous research, almost all weak signal detection techniques were studied under the premise of how to eliminate noise, but the stochastic resonance theory provides a new research idea and method.
Stochastic resonance theory was first proposed by Benzi [1] etc. in the study of paleo-meteorological glaciers that occur periodically, which was used to explain the periodic alternation between ice ages and warm periods in the Earth's climate. In 1983, Fauve and Heslot [2] confirmed the existence of stochastic resonance in the study of Schmitt flip-flop circuit with bistable characteristics. Subsequently, McNamara and Wiesenfeld [3] confirmed the existence of stochastic resonance again in ring lasers and calculated the output SNR of the system. The results showed that stochastic resonance could improve the output SNR of the system. There are many measures of stochastic resonance, such as the signal-to-noise ratio (SNR), signal-to-noise ratio improvement (SNRI) and dwell time distribution of periodic stochastic resonance, the coherence function and correlation coefficient of aperiodic stochastic resonance, among which SNR and SNRI are the most commonly used measurement indicators. Classical bistable stochastic resonance systems include adiabatic approximation theory, dwell time distribution theory and linear response theory. Non-classical ones include linear response theory proposed by Dykman [4], Hu Gang [5] put forward to perturbation theory of eigenvalues, and stochastic resonance theory under the condition of non-adiabatic approximation [6-7].
It is a new technique to apply stochastic resonance to weak signal enhancement detection. In the 1990s, the principle of stochastic resonance was first applied to detect weak signals. At the beginning, people mainly extracted the characteristic information of weak periodic signals by adjusting the noise intensity to produce stochastic resonance in the system. In 1996, Bulsara and Gammaitoni [8] proposed adaptive stochastic resonance, emphasizing the idea of adjusting system parameters to generate stochastic resonance and its importance in signal processing.
With the rise of artificial intelligence, various intelligent algorithms and stochastic resonance have been combined to detect weak signals, such as Sparrow Search Algorithm [9]; Artificial-Fish Swarm Algorithm [10]; Adaptive stochastic resonance [11-12]; Adaptive scaling method [13], etc. which have achieved good results and realized weak signal enhancement. Chen Liang and Wang Xun [14] proposed an algorithm combining DBZP method and adaptive stochastic resonance, which significantly improved the SNR, eliminated the influence of bit and NH code hopping of the Beidou II navigation data, and realized the acquisition sensitivity of the Beidou II satellite under weak signals.
Weak feature signal detection under noise background is a common problem in many engineering application fields [15-17]. In this article, the theoretical model of bistable stochastic resonance is analyzed, and a stochastic resonance model for detecting multi-frequency weak signals is constructed. The correctness of under-sampled multi-frequency weak signals detection method of bistable stochastic resonance is verified by Matlab simulation experiments.
1.1. Stochastic resonance model
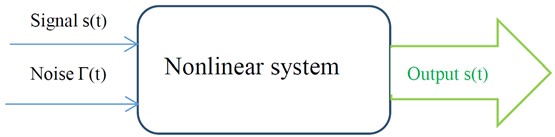
In general, stochastic resonance model can be divided into three parts: input signal; noise; nonlinear system. When the nonlinear system is subjected to the synergistic effect of the input signal and noise , reach or exceed a certain threshold system, the noise energy can enhance the signal energy, and stochastic resonance phenomenon appears.
Fig. 1Stochastic resonance model diagram
1.2. Bistable system
The common nonlinear systems include heterodyne stochastic resonance model, multi-scale noise regulation model, bistable stochastic system model and adaptive stochastic resonance model, among which the bistable stochastic system model is widely used in many research fields, such as physics, chemistry and communication, etc. Secondly, the research results of bistable system are still suitable for multi-stable system such as three-stable and four-stable. When the system inputs signals and noise, neither energy is generated nor consumed. It is only transmitted between the input signal and noise, and ultimately between the output signals. The bistable stochastic resonance model can easily improve the SNR by adjusting intensity and system parameters.
Given a bistable system affected by white noise and external periodic driving forces , the Langevin equation is following:
where, the statistical properties of white noise are , and , is the external periodic driving force. The nonlinear external force field is introduced into the above equation, and the potential function is Eq. (2):
where, respectively, are the two stable equilibrium points of Eq. (2), which are separated by a barrier of high . The analysis shows that when the amplitude of the input signal is greater than the threshold value , the particle can cross the barrier.
It is difficult to calculate the macro equation of this formula by statistical averaging of nonlinear systems. Considering that the noise has a certain energy, under appropriate conditions, the active Brown particles will break through the binding of the potential barrier under the effect of the noise energy, realize the energy transfer, increase the output SNR, and appear Stochastic resonance phenomenon. When a bistable system is subjected to both signal and random noise, the output SNR can be improved by adjusting the system parameters.
The probability distribution function in Eq. (1) is , and the FPE equation of the probability distribution function is as below:
Eq. (3) is a second-order partial differential equation, here is a Markov process, and the initial condition in the equation is , on the right side, there are terms , so the analytical results of the system cannot be found, and the following research will carry out numerical simulation.
1.3. SNR and SNRI
In order to quantitatively characterize the relationship between input signal and noise in the detection system, SNR and SNRI are important indicators to study the detection system. The SNR refers to the ratio of the effective value S of a signal to the effective value N of noise, reflecting a ratio relationship between signal components and noise components. The expression is:
where is power spectral density, is the noise intensity. Usually, the output SNR is a local value, it can be maximized by adjusting the system parameters and noise intensity. Therefore, how to improve SNR is the key to signal detection. The ability of a system to suppress noise is usually measured by SNRI, which is an expression for SNRI. is the SNR of the output signal. The larger SNRI of the input signal, the stronger the system's ability to suppress noise. In this paper, the SNR is used to describe the Stochastic resonance phenomenon. Based on the adiabatic approximation theory and the output power spectrum of the system, the approximate expression of the output SNR of Eq. (1) is as below [18]:
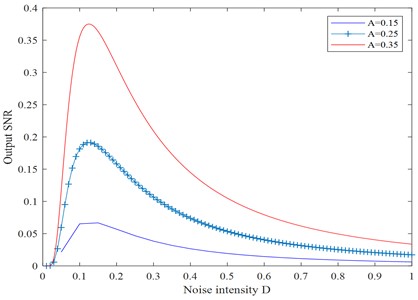
Here, we take , the potential barrier . Fig. 2 shows the numerical calculation results of Eq. (5). It can be seen that when other parameters and noise intensity of are constant, an increase in signal amplitude can bring about a higher output SNR; When other system parameters and signal amplitude are fixed, as the noise intensity increases, the SNR in Fig. 2 shows a trend of first rapidly increasing and then gradually decreasing.
Fig. 2SNR with noise intensity D under different signal amplitudes
2. Numerical analysis of multi frequency weak signal detection based on bistable Stochastic resonance
2.1. Power spectrum of noise response
According to the adiabatic approximation theory, the power spectrum of pure noise response in a bistable system is as follows [19]:
where is the average first-pass frequency, substitute into Eq. (6), and simplify:
The power spectrum of the noise response decreases with the increase of frequency in a hyperbolic function curve, indicating that the noise spectrum energy is concentrated in the low-frequency band. In this paper, Matlab software is used to calculate and analyze the detection of multi frequency weak signals according to the fourth-order Runge-Kutta algorithm.
2.2. Stochastic resonance of multi frequency weak signal superposition
The simulation model of the single-frequency weak signal system is improved, and the signals are extended to three signals, and then the appropriate system parameters , and noise intensity are selected for simulation experiments, where , , 0.5, sampling frequency is 10 Hz, the threshold of the system is , take the input multi-frequency cosine signal amplitude , .The frequencies are = 0.01 Hz, = 0.03 Hz, and = 0.05 Hz in turn. The spectrum diagrams of signal input and output are shown in Fig. 3 and Fig. 4.
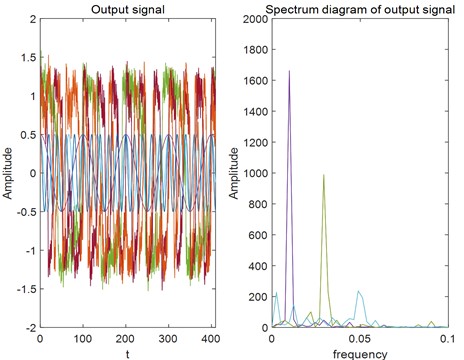
As can be seen from time domain/spectrum diagram of the output of three signals in Fig. 4, stochastic resonance phenomenon appears in the system. Signals in the low-frequency concentrated region are significantly amplified when passing through the bistable stochastic resonance system, while signals in the relatively high frequency region are relatively weak, and the energy of noise spectrum is concentrated in the low-frequency signal section, which further verifies the rule given by Eq. (7).
Fig. 3Time domain/spectrum diagram of three input signals
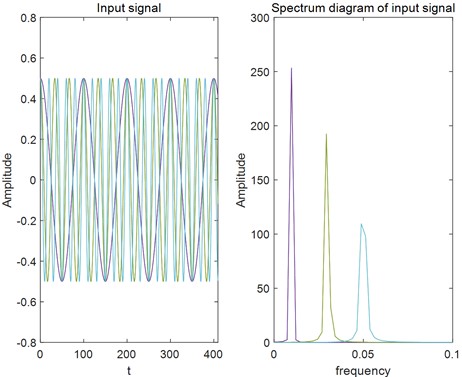
Fig. 4Time domain/spectrum diagram of the output of three signals
3. Multi frequency weak signal detection model
3.1. The theoretical principle of under-sampling stochastic resonance
The premise of application of adiabatic approximation theory is low frequency weak signal. When large parameter signal is encountered in signal detection, it cannot meet the requirements of adiabatic approximation theory. To overcome this limitation, a weak signal detection model based on under-sampling stochastic resonance is proposed in this paper.
According to the weak signal detection method principle of under-sampling stochastic resonance, the large parameter signal is under-sampled by appropriate scale coefficients, so that the under-sampling signal is still a periodic signal, and its frequency conforms to the adiabatic approximation theory. Then, the weak sampled signal is detected through stochastic resonance effect. in the end, the scale inverse transformation of the under-sampled signal is carried out to realize the recovery of the large parameter signal. Different from other scaling methods, this algorithm directly under-samples the input signal, which will reduce the sampling rate and complexity. which is widely applied and easy to implement.
3.2. Weak signal detection algorithm based on under-sampling stochastic resonance
The frequency of the input signal with a large parameter of single is , the initial phase is , the under-sampling scaling coefficient is , the corresponding sampling interval is defined as , and the under-sampling sequence is Eq. (8):
where . This is obvious that the under-sampled signal in Eq. (8) is still a periodic signal. When the frequency of the input signal does not meet the constraints of the adiabatic approximation theory, an appropriate under-sampling scale factor can be selected to transform high-frequency input signal into a smaller parameter. According to stochastic resonance theory, when the input signal and noise synergize to produce stochastic resonance, the output signal is a similar cosine signal . For the under-sampled signal, the output signal is solved numerically using a fourth-order Runge-Kutta discretization method. The approximate expression is given in Eq. (9) [20]:
where is the amplitude of the output signal, and is the additional phase difference generated by the nonlinear processing time delay. Therefore, according to the previous method, frequency spectrum can be analyzed to extract the under-sampling signal frequency . The frequency of the original input signal can be restored by formula .
3.3. Simulation result
Based on the previous weak signal detection method and principle analysis of under-sampling stochastic resonance, the signals with large parameters are first under-sampled at an appropriate sampling rate, So that they are still periodic and meet the theoretical conditions of adiabatic approximation. Now select the input signals.
, system parameter 1, 3, 0.5, 5 Hz, 25 Hz, 45 Hz, 0.6, sampling frequency 10 Hz, 500.
Fig. 5Noiseless/noise signals with mixed frequency input
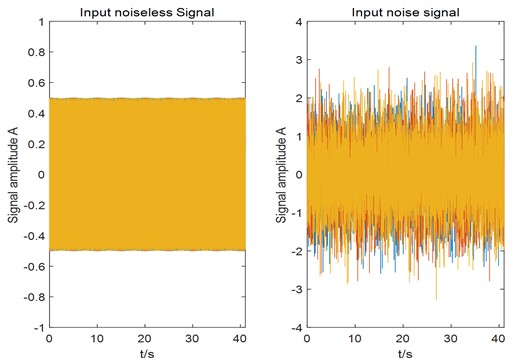
Fig. 6Spectrum of the input under-sampling and noisy mixed frequency signal
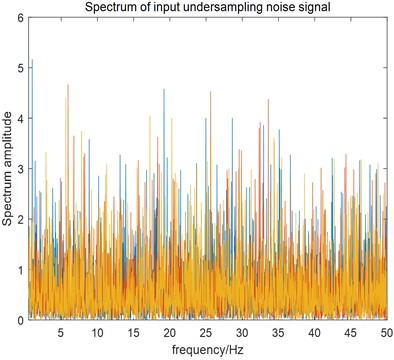
According to the requirements of the sampling interval of under-sampling, select scale transform coefficient 500, and then the under-sampling signal is analyzed by FFT spectrum. It is found that the useful signal is almost completely drowned out by noise, and the multi-frequency mixed signal cannot be recognized.
Fig. 7Time domain/spectrum diagram of the output signal after under-sampling
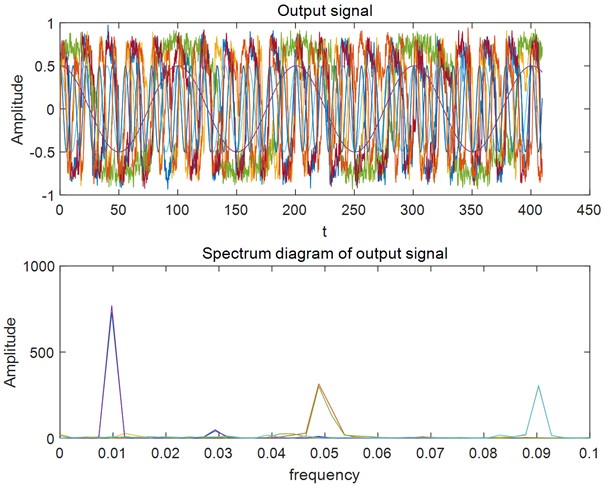
As can be seen in Fig. 7, the stochastic resonance phenomenon appears in the nonlinear bistable system. Within the allowable error range, the amplitude of the output signal has obvious spectral peaks at the three frequencies, which are 0.0098 Hz, 0.049 Hz, 0.09 Hz in turn, and the signals to be detected can be successively restored by using the formula , so that the multi-frequency 4.91 Hz, 24.55 Hz, 45.09 Hz, mixed signals submerged in high noise at the input can be detected and identified one by one. Then it is verified that the high multi-frequency weak periodic signal in the white noise is detected based on under-sampled stochastic resonance.
4. Conclusions
The above simulation experiments show that the low frequency weak signals satisfying the adiabatic approximation theory can be detected by choosing the appropriate parameters of the bistable nonlinear system. For high frequency weak signals, multi-frequency weak signals can also be detected based on the under-sampled stochastic resonance method, which reduces the sampling rate and complexity.
References
-
R. Benzi, G. Parisi, A. Sutera, and A. Vulpiani, “A theory of stochastic resonance in climatic change,” SIAM Journal on Applied Mathematics, Vol. 43, No. 3, pp. 565–578, Jun. 1983, https://doi.org/10.1137/0143037
-
S. Fauve and F. Heslot, “Stochastic resonance in a bistable system,” Physics Letters A, Vol. 97, No. 1-2, pp. 5–7, Aug. 1983, https://doi.org/10.1016/0375-9601(83)90086-5
-
B. Mcnamara and K. Wiesenfeld, “Theory of stochastic resonance,” Physical Review A, Vol. 39, No. 9, pp. 4854–4869, May 1989, https://doi.org/10.1103/physreva.39.4854
-
M. I. Dykman, D. G. Luchinsky, R. Mannella, P. V. E. McClintock, N. D. Stein, and N. G. Stocks, “Stochastic resonance: Linear response and giant nonlinearity,” Journal of Statistical Physics, Vol. 70, No. 1-2, pp. 463–478, Jan. 1993, https://doi.org/10.1007/bf01053982
-
G. Hu, G. Nicolis, and C. Nicolis, “Periodically forced Fokker-Planck equation and stochastic resonance,” Physical Review A, Vol. 42, No. 4, pp. 2030–2041, Aug. 1990, https://doi.org/10.1103/physreva.42.2030
-
P. Jung and P. Hänggi, “Resonantly driven Brownian motion: Basic concepts and exact results,” Physical Review A, Vol. 41, No. 6, pp. 2977–2988, Mar. 1990, https://doi.org/10.1103/physreva.41.2977
-
P. Jung and P. Hänggi, “Amplification of small signals via stochastic resonance,” Physical Review A, Vol. 44, No. 12, pp. 8032–8042, Dec. 1991, https://doi.org/10.1103/physreva.44.8032
-
A. R. Bulsara and L. Gammaitoni, “Tuning into noise,” Physics Today, Vol. 49, No. 3, pp. 39–45, 1996.
-
Gao Kang-Ping, “Research on Weak Signal Extraction of Rotating Machinery Based on SSA and Stochastic Resonance,” Noise and Vibration Control, Vol. 42, No. 1, p. 112, Feb. 2022.
-
Kong De-Yang et al., “Adaptive stochastic resonance method based on artificial-fish swarm optimization,” (in Chinese), Acta Electronica Sinica, Vol. 45, No. 8, pp. 1864–1872, 2017.
-
Yang Bo et al., “Application of adaptive stochastic resonance in signal feature extraction (in Chinese),” (in Chinese), Journal of Harbin Engineering University, Vol. 43, No. 12, pp. 1750–1758, 2022.
-
Jianlei Zhang, Xiang Lan, and Yi Yang Etc., “Adaptive stochastic resonance detection of weak light signal in underwater laser communication (in Chinese),” (in Chinese), Optics and Precision Engineering, Vol. 30, No. 12, pp. 1383–1393, 2022.
-
B. Liu et al., “Detection algorithm of BPSK signal based on adaptive scale change-bistable stochastic resonance model,” (in Chinese), Systems Engineering and Electronics, Vol. 44, No. 7, pp. 2084–2095, Jun. 2022, https://doi.org/10.12305/j.issn.1001-506x.2022.07.03
-
Chen Liang and Wang Xun, “Application of stochastic resonance algorithm in weak signal acquisition of Beidou,” Journal of Wuhan University, Vol. 43, No. 4, pp. 605–612, 2018, https://doi.org/10.13203/j
-
S. Wang, F. Wang, S. Wang, and G. Li, “Detection of multi-frequency weak signals with adaptive stochastic resonance system,” Chinese Journal of Physics, Vol. 56, No. 3, pp. 994–1000, Jun. 2018, https://doi.org/10.1016/j.cjph.2018.04.001
-
J. Tang, “Research on weak signal Detection model based on stochastic resonance and its application,” (in Chinese), Beijing University of Science and Technology, 2021.
-
S. Liu, Y. Sun, and Y. Kang, “A novel e-exponential stochastic resonance model and weak signal detection method for steel wire rope,” IEEE Transactions on Industrial Electronics, Vol. 69, No. 7, pp. 7428–7440, Jul. 2022, https://doi.org/10.1109/tie.2021.3095802
-
S. Jiao, R. Gao, Q. Xue, and J. Shi, “Weak signal detection method based on novel composite multistable stochastic resonance,” (in Chinese), Chinese Physics B, Vol. 32, No. 5, p. 050202, May 2023, https://doi.org/10.1088/1674-1056/aca4bd
-
Hu Niao Qing, Theory and Method for Detecting Weak Characteristic Signals in Stochastic Resonance. (in Chinese), Beijing: National Defense Industry Press, 2012.
-
Shi Sheng Chao et al., “A novel weak single frequency signal detection method based on under-sampling stochastic resonance (in Chinese),” (in Chinese), Telecommunication Engineering, Vol. 54, No. 5, pp. 605–610, 2014, https://doi.org/10.3969/j.issn.1001-893x.2014.05.015
About this article

The authors have not disclosed any funding.
The datasets generated during and/or analyzed during the current study are available from the corresponding author on reasonable request.
The authors declare that they have no conflict of interest.
