Abstract
In order to analyze the performance of large-span spatial structures made of new building materials, improve the seismic resistance of large-span spatial structures made of new building materials, analyze the random vibration of large-span spatial structures made of new building materials, and determine the mechanical properties of large-span spatial structures made of new building materials. The paper takes carbon fiber reinforced polymer (CFRP) as an example, and prepares CFRP large-span structural specimens through surface coating treatment of carbon fiber and composite material preparation process; Enhancement effect of interfacial bonding strength of CFRP large-span spatial structures through bidirectional shear experiments; Design large-span spatial structures of carbon fiber composite buildings and establish multi-scale finite element models of vibration reduction systems; Analyze the random vibration of large-span spatial structures, improve the Kanai Tajimi model through the random vibration power spectral density function, calculate the structural response power spectrum, analyze the response of CFRP large-span spatial structures through the H-V coherence function model, and verify the mechanical properties of CFRP material large-span spatial structure specimens through experiments. The test results show that after the tensile test, the CFRP specimen connecting plate did not fail, indicating that the CFRP specimen has a significant impact on its connection strength in this situation. However, the compression and shear failure of the CFRP large-span spatial structure specimen will occur in local areas due to the compressive action of the specimen.
1. Introduction
With the rapid development of modern architectural technology, large-span spatial structures have been widely used in sports venues, transportation hubs, exhibition centers, and industrial plants due to their unique design, vast functional space, and efficient load-bearing capacity. This type of structure usually has the characteristics of large span, complex stress, and diverse spatial forms. Its design needs to take into account functional requirements, economy, and safety. In recent years, with the acceleration of urbanization and the increasing demand for public buildings, the span and complexity of large-span spatial structures have continued to increase [1, 2]. The limitations of traditional building materials (such as steel and concrete) in terms of lightweight, durability, and dynamic response control have gradually emerged. In this context, the emergence of new building materials represented by fiber-reinforced composites (FRP), high-performance concrete (UHPC), smart materials (such as shape memory alloys), and 3D printed structures provides new possibilities for innovative design of large-span spatial structures [3]. However, the mechanical properties of new materials are significantly different from traditional materials, and their dynamic behavior in large-span structures, especially their random vibration response and long-term mechanical properties, still need to be further explored. In the actual service process, large-span spatial structures are inevitably affected by random excitations such as wind loads, seismic effects, crowd activities, and mechanical vibrations. These excitations have significant non stationarity and uncertainty, which may lead to complex dynamic responses of the structure, and even cause fatigue damage, local instability, or overall failure. Although scholars at home and abroad have achieved fruitful results in the static and dynamic analysis of large-span structures under deterministic loads, there are still many challenges in the systematic research of new material large-span structures under random vibration environments [4]. Firstly, the constitutive relationship, nonlinear mechanical behavior, and multi-scale damage evolution mechanism of new materials are not fully understood, and traditional theoretical models are difficult to accurately describe their dynamic characteristics; Secondly, random vibration analysis involves multi physics field coupling (such as wind structure interaction, material environment synergistic effect) and nonlinear stochastic dynamics modeling [5], and existing methods have a contradiction between computational efficiency and accuracy; Thirdly, the application of new materials has raised higher requirements for the connection nodes, boundary conditions, and overall stability of large-span structures, and there is an urgent need to establish design criteria and evaluation systems that are suitable for their characteristics.
Xiao Xiang et al. proposed a wind-induced random vibration control method for long-span cable-stayed bridges based on TMD [6]. Based on virtual excitation method and Davenport wind speed spectrum, a bridge wind coupled random vibration model considering the spatial non-uniformity of wind field and aerodynamic admittance effect was established; Using finite element method to extract the first 10 modal parameters of the bridge, identify the key resonance frequencies of the main beam's vertical/torsional and inclined cable's in-plane/out of plane. Aiming at multi-objective control requirements, an improved TMD parameter collaborative optimization strategy is proposed: using genetic algorithm to minimize the variance of the main beam displacement as the objective function, jointly constraining the TMD mass ratio, frequency bandwidth, and damping ratio, and optimizing the distributed placement position and quantity of stay cable TMDs based on energy equivalence criteria. Finally, the damping effect of TMD was verified through Monte Carlo random simulation and time history analysis. The TMD control method based on multi-objective optimization can effectively suppress the multimodal wind-induced random vibration of long-span cable-stayed bridges, significantly reducing the dynamic response amplitude and fatigue damage risk of key components. Expanding frequency band coverage through multiple TMD arrangements, using Coulomb friction damping instead of viscous damping to enhance temperature stability and energy robustness, and introducing a rotating inertia device instead of physical mass. By amplifying the inertia effect through a gear mechanism, spatial limitations are overcome and low-frequency control efficiency is enhanced. The collaborative optimization of the three significantly improves the frequency band adaptability, energy efficiency, and space utilization of TMD, reducing the structural resonance response and fatigue damage risk. However, the goals of minimizing the displacement of the main beam and suppressing the vibration of the inclined cable may contradict each other (such as avoiding the fundamental frequency of the cable in the TMD frequency of the main beam), and genetic algorithms are prone to getting stuck in local optimal solutions. Zhao Yan et al. proposed a non-stationary random vibration analysis method for large-span bridges based on virtual excitation method [7]. Based on the time-varying power spectral density theory of non-stationary random processes, a non-stationary excitation model of wind speed field and seismic motion was established. The virtual excitation method was combined with the traditional modal superposition method, and by constructing a virtual harmonic excitation sequence, the non-stationary random vibration problem was transformed into a deterministic time history analysis problem, significantly reducing the computational dimension. The fast Fourier transform (FFT) algorithm and fine integration method were introduced to efficiently solve the time-varying statistical characteristics of structural response. In addition, an improved virtual excitation incremental iterative coupling algorithm is proposed for the geometric nonlinear behavior of bridges, achieving high-precision solution of nonlinear systems. This method can accurately capture the time-frequency evolution law and non Gaussian characteristics of structural response, providing quantitative basis for bridge wind and seismic design, vibration control, and life prediction. However, the coupling effect of wind earthquake vehicle load can introduce asymmetric power spectra or non Gaussian characteristics, and the existing methods for joint probability characterization of multi physical field coupling responses are not yet perfect. Xiao Xiang et al. proposed a vibration analysis of long-span cable-stayed bridges under wind loads [8]. Based on computational fluid dynamics simulation and harmonic superposition method, a three-dimensional pulsating wind speed field considering spatial correlation and non-stationary characteristics was constructed; A refined model of a cable-stayed bridge is established using the finite element method, incorporating the sag effect of the cables, the aerodynamic admittance function of the main beam, and the aerodynamic interference coefficient of the bridge tower to characterize the fluid structure coupling effect of the structure wind field. By combining time-domain analysis with frequency-domain virtual excitation method, the time history response of structural displacement, acceleration, and cable tension can be solved; Based on an improved equivalent linearization method, quantify the flutter critical wind speed and vortex locking zone range, and verify the reliability of the model through wind tunnel test data. The refined fluid structure coupling model constructed by integrating the advantages of time-domain and frequency-domain analysis can accurately predict the wind-induced vibration response and aerodynamic instability threshold of long-span cable-stayed bridges. The scaling effect of Reynolds number in wind tunnel tests leads to distortion of wind pressure distribution on the surface of inclined cables, and it is difficult to reproduce the geometric roughness and atmospheric boundary layer characteristics of actual bridges, which affects the reliability of aerodynamic parameter calibration.
In response to the above issues, the paper analyzed the random vibration of large-span spatial structures made of new building materials and studied their mechanical properties. This study focuses on the random vibration analysis and mechanical performance research of new materials for large-span spatial structures.
2. Materials and methods
2.1. Experimental materials and equipment
2.1.1. Experimental raw materials and chemical reagents
PAN (polyacrylonitrile) is the main precursor material for manufacturing carbon fibers. The fibers are treated with high-temperature oxidation, carbonization and other processes to form high-performance carbon fibers. The original PAN based carbon fiber mesh was provided by Kaben Technology Group Co., Ltd., with a fiber diameter of 7 μm and a density of 1.8 g/cm3. Silane coupling agent (SCA) is provided by Hubei Lantian New Materials Co., Ltd. Hydroxymethylcellulose (HMC) was purchased from Shanghai Yuanye Biotechnology Co., Ltd. The self-made epoxy resin coating in the laboratory consists of two parts: bisphenol A-type epoxy resin (component A) as the matrix material, and cyclic amine and polyetheramine modified materials as curing agents (component B). Wet jet polymer mortar is provided by Kaben Technology Group Co., Ltd. The bidirectional shear specimen refers to a specimen with a sandwich structure of mortar carbon fiber mesh mortar made of carbon fiber mesh and polymer mortar on both sides of the concrete brick. The detailed performance parameters of all materials required for the experiment are shown in Table 1.
Table 1Performance parameters of materials required for the experiment
Material | Basic performance | Parameter |
Carbon fiber mesh | Ultimate destructive load | 3200 N |
Design tensile strength | 101.2 MPa | |
Elastic modulus | 230 kN/mm2 | |
Carbon fiber mesh weight (direction of force) | 80 g/m2 | |
Spacing | 2 mm | |
Wet jet polymerization | Compressive strength (28 d) | 55 MPa |
Material mortar | Flexural Strength | 12 MPa |
splitting tensile strength | 7 MPa | |
density | 2.05 g/cm3 | |
Concrete block | compressive strength | 19.8 N/mm2 |
Flexural Strength | 3.66 N/mm2 | |
splitting tensile strength | 2.46 N/mm2 | |
Young's modulus | 5760 N/mm2 | |
Silane coupling agent | density | 1.06 g/cm3 |
refractive index | 1.43 nD25 | |
content | 98.4 % | |
hydroxymethyl cellulose | viscosity | 100000 |
2.1.2. Experimental equipment
Table 2Equipment required for the experiment
Device | Origin |
DZF series vacuum drying oven | Shanghai Jinghong Experimental Equipment Co., Ltd |
Anti-bending model vibration equipment | Kaben Composite Materials (Tianjin) Co., Ltd |
CSS-44100 universal testing machine | Changchun Experimental Machinery Research Institute |
NewClassicML104 electronic balance | Mettler Toledo Instruments (Shanghai) Co., Ltd |
PHILIPS XL30 electron scanning microscope | Beijing Haifuda Technology Co., Ltd |
Thermo ESCALAB 250XI | ThermoFisher VG Scientific Company in the United States |
2.1.3. Experimental preparation process
2.1.3.1. Surface coating treatment of carbon fiber
Cut three different sizes of carbon fiber grids with a length of 98 cm: single (2 cm), double (4 cm), and three (6 cm). Fix the two ends of the cut grid to the iron fixing table, and apply epoxy coating according to A:B = 3:1. Prepare and stir thoroughly with a glass rod. Apply a uniformly configured epoxy coating onto the surface of the carbon fiber mesh, let it stand for 5 minutes to extrude excess resin, and then cure at 80 ℃ for 2 hours. The purpose of adding SCA is to enhance the chemical activity of the fabric surface [9-12]. When adding SCA (1 %) to epoxy resin, the carbon fiber mesh was processed using the same steps to obtain a carbon fiber mesh treated with both SCA and epoxy coating. Cut the above grid into a size of 40 mm×160 mm to prepare carbon fiber mesh reinforced concrete beam flexural test blocks.
2.1.3.2. Preparation process of composite materials
As a cement-based composite material, two different polymer mortars (I/II) are used, where I represents wet jet polymer mortar and II represents wet jet polymer mortar with added HMC [13]. To increase the surface roughness, the surface of the concrete brick is polished and cleaned. Apply a layer of epoxy based interface agent on the surface of concrete to wet the brick surface and increase the interfacial bonding strength between the concrete brick surface and the polymer mortar. Firstly, apply a 5 mm thick polymer mortar layer onto the surface of the concrete brick, and then lay the carbon fiber mesh flat on the surface of the mortar layer, with a bonding length of 150 mm between the two. The thickness of the top polymer mortar is 10 mm. Place the completed sample under suitable laboratory conditions for curing for 28 days. The composite material samples made of carbon fiber mesh before and after surface treatment with mortar I, epoxy resin, and surface treatment with epoxy resin and SCA coating are respectively represented as I-CF, I-CF/EP, and I-CF/EP-SCA [14]. In addition, the composite material sample made of carbon fiber mesh treated with mortar II, epoxy resin, and SCA coating surface is represented as II-HMC&CF/EP-SCA.
In order to verify the shear strength enhancement effect between carbon fiber mesh and mortar layer from multiple angles, three-point bending performance tests were conducted. The concrete beam sample without carbon fiber mesh reinforcement is defined as I-(F). The mold size is 40 mm×40 mm×160 mm. Add the evenly mixed mortar into the installed mold, and place the mold on a vibration table to expel any air bubbles that have been poured into the mortar. When the mold is not removed, wet cure the prepared sample for 3 days, and then wet cure for 25 days with only the bottom mold remaining. Carbon fiber mesh is placed as a reinforcing material at a distance of 10 mm from the bottom surface of the concrete beam. The composite material samples made of carbon fiber mesh before and after surface treatment with mortar I, epoxy resin, and surface treatment with epoxy resin and SCA coating are respectively represented as I-CF (F), I-CF/EP (F), and I-CF/EP-SCA (F). In addition, the composite material sample made of carbon fiber mesh treated with mortar II, epoxy resin, and SCA coating surface is represented as II-HMC&CF/EP-SCA (F).
2.2. Testing and characterization methods
2.2.1. Mechanical properties
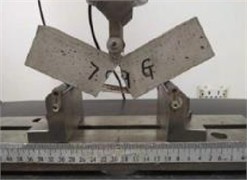
Verify the enhancement effect of interfacial bonding strength of CMCCs through bidirectional shear experiment results. The shear test is conducted according to standard Q/12CFN003, using CSS-44100 electronic universal testing machine as the testing instrument. Fig. 1 shows the schematic diagram of the bidirectional shear experimental device. The load is transmitted to the mortar matrix through the fabric. In order to ensure that the direction in which the carbon fiber fabric bears the load is parallel to the surface of the concrete, the diameter of the circular tube of the testing fixture is equal to the thickness of the concrete brick and twice the thickness of the first layer of mortar. The loading rate is 2 mm/min. Four sets of double shear test samples were prepared, namely I-CF, I-CF/EP, I-CF/EP-SCA, and II-HM&CF/EP-SCA. Five samples were tested in each set, and the average and standard error were calculated.
Fig. 1Double shear test sample and test fixture
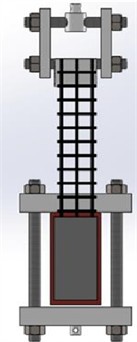
a) S
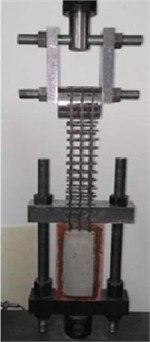
b) D
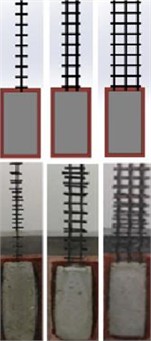
c) T
Among them, S, D, and T represent the bidirectional shear specimens prepared from cement-based composite materials reinforced with single, double, and triple carbon fiber grids, respectively. The calculation formula for bidirectional shear strength is as follows:
where, is the tensile strength (MPa); is the maximum load that the sample can bear (kN); is the theoretical cross-sectional area of three carbon fiber grids (mm2/mm); Characterize the bending performance of composite materials using the results of three-point bending tests. The three-point bending test is conducted according to the standard GB/T 17671-1999, and the testing instrument is the CSS-44100 electronic universal testing machine. Place the sample in the testing fixture at a testing speed of 0.05 kN/min. The maximum range is 100 kN. The calculation formula for flexural strength is as follows:
where, is the flexural strength (MPa); is the load applied to the middle of the prism when it breaks (N); is the distance between the supporting cylinders (mm); is the side length (mm) of a square cross-section of a prism.
3. Random vibration analysis of large-span spatial structures
3.1. Design of large-span spatial structures using new building materials
A key issue in establishing multi-scale models is the problem of cross scale connections, and the most essential relationship between models of different scales at the connection interface is displacement [15]. Constraint equations are established for displacement coupling between nodes of macroscopic units and nodes of fine solid units. Under the axial force of the cable dome strut and the truss diagonal web member, the connection interface between the damper and the member will undergo certain deformation. At this time, the node displacement of the connecting member, the node displacement of the damper, and the cross-sectional size of the coupling interface have the following coordination relationship:
where, , , , , and represent the displacements of the truss elements of the members in six directions at the connection interface, , and represent the axial and tangential displacements of the damper solid elements at the connection interface, and represents the radius of the flange in the damper.
The displacement coordination equation listed in Eq. (1) can be implemented in ABAQUS software through “Kinematic” [16]. When using “motion coupling” to connect dampers with cable dome structure struts and truss structure diagonal web members, the damper flange and members complete rigid connections between different scales, that is, the relative distance between the member element nodes at the coupling interface and the nodes of the damper solid element model remains unchanged. The multi-scale models of the cable dome structure and truss structure vibration reduction system established using the above method are shown in Fig. 2.
Among them, in the cable dome and truss vibration reduction system, viscous fluid dampers are used as dampers, whose core characteristics are: damping coefficient C: typical range of 150 kN s/m, providing velocity related energy dissipation; Nonlinear index : takes a value of 1.0 (linear damping); Frequency adaptability: Targeting the optimization of the main vibration mode of the structure, suppressing the random vibration response of wind/earthquake. The random vibration method is mainly based on the statistical characteristics of the excitation received by the support to solve the structural response. Usually, all support movements are represented by a stationary self power spectral density function matrix and a mutual power spectral density function matrix. The mutual power spectral density function is calculated from the corresponding self power spectral density function and coherence function, and it can represent the spatially varying seismic motion field in the frequency domain [17]. The main advantage of the random vibration method is that it can provide a statistical method for solving structural response, rather than being limited by the selected fixed ground vibration records like the time history analysis method.
Fig. 2Multi scale finite element model of vibration reduction system
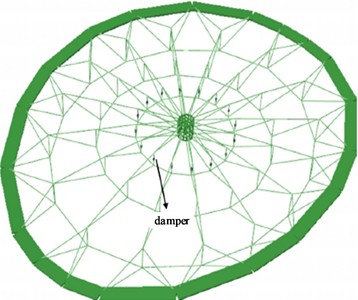
a) Cable dome structure
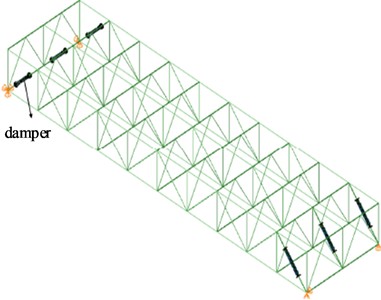
b) Truss structure
3.2. Random vibration analysis model for large-span spatial structures
In the random vibration method, the motion of each support is represented by a power spectral density matrix consisting of a self power spectral density function and a mutual power spectral density function , as well as a corresponding coherence function . , represents different support numbers, as shown in the following equation. Assuming that the structure has supports:
Among them, is the circular frequency, and , represents the random process of seismic motion at two points , ; is the coherence function between the th and th supports, which can be expressed by Eq. (5):
3.3. Random vibration power spectral density function
The most commonly used power spectrum models currently are the Kanai Tajimi model and its improved models. The Kanai Tajimi model is a white noise analysis model based on soil layer filtering. The following is the expression of its acceleration power spectrum model:
Among them, represents the amplitude of white noise excitation in the bedrock, while and represent the frequency and damping factor of the filtered soil layer, respectively. For stationary stochastic processes, the velocity power spectral density function and displacement power spectral density function can be solved using the following formulas:
It is easy to see from Eqs. (9) and (10) that the Kanai Tajimi model has its own limitations as the velocity and displacement power spectra tend to infinity at , which is inconsistent with reality.
On the basis of this model, a filter controlled by parameters and was added, and the original power spectrum model was improved to the following form:
This improved model effectively solves the problem of infinite variance between velocity power spectrum and displacement power spectrum. Different site conditions can be achieved by changing the four parameters of the model. Referring to the Kanai Tajimi model, the value of is 1.5-6.3 rad/s, and the value of is 0.5. The value of is obtained by inverting the peak ground acceleration; The value of is 1.5 rad/s, effectively suppressing low-frequency divergence; 0.6, ensure the convergence of displacement spectrum. The parameters need to be determined by fitting seismic records based on the site category (I-IV), such as a height of for hard soil and a height of for soft soil.
The power spectrum model mentioned earlier only includes the influence of local sites, as the model assumes that seismic motion propagates in the form of white noise in bedrock. However, in reality, seismic motion is caused by the energy of fault fractures being transmitted in the form of waves from the fault to the surface. In order to consider these factors, the following improvement forms have been proposed:
Among them, is a function representing the radiation type, free surface effect, soil density, and shear wave velocity in the near seismic source area; represents the seismic source influence factor, which mainly depends on factors such as moment magnitude and fault characteristics; is the amplification factor; represents attenuation factor; is a filter used to describe the response spectrum.
In order to better integrate with practical engineering, many researchers directly generate corresponding seismic power spectra through iterative generation of design response spectra in the specifications for calculation. Compared with the analytical power spectrum, using this seismic power spectrum as input is more practical, and the calculated structural response power spectrum is also easier to apply to practical engineering seismic design. Therefore, this article tends to use this seismic power spectrum as the input for calculation and analysis of structural response under multi-point excitation.
3.4. Response analysis of spatially varying seismic effects based on hysteresis coherence function
Until the widespread application of array recording devices (especially SMART-1 array recording), researchers began to slowly study the multi-point excitation response problem of large-span structures from a statistical perspective. As shown in Eq. (13), the coherence function of seismic motion is obtained by normalizing the mutual power spectrum between two points through the corresponding self power spectrum. is a complex number, and the square of its absolute value is:
Among them, is a real number and satisfies . The coherence function is usually written in the following form, where :
Among them, is called the hysteresis coherence function, which reflects the partial coherence effect in the spatial effect of seismic motion. The hysteresis coherence model in earthquake engineering is mainly based on wind resistance theory, and the expression is as follows:
Among them, and are constants, and represents the shear wave velocity.
The hysteresis coherence function is corrected by fractional derivative as follows:
Among them, represents the spatial fractional Laplacian operator, which describes the non local decay of coherence; represents the attenuation index, usually , reflecting the sub diffusion effect.
Then, a fractional order memory kernel coherence model is constructed as follows:
Among them, represents the Mittag Leffler function, which is used to characterize the decay rate of memory effects; represents the attenuation coefficient, which is related to the viscoelastic energy dissipation of the soil.The fractional order model flexibly regulates the attenuation rate through the order , , , and , breaking through the limitations of integer order calculus in describing the long-range correlation and memory effect of seismic motion, and is more in line with actual site data.
3.5. Response analysis of large-span spatial structures using new building materials based on H-V coherence function model
With the deepening of research on coherence functions, more and more hysteresis coherence models have been proposed, which can be mainly divided into empirical coherence models and semi theoretical semi empirical coherence models. The former is suitable for two-point coherence effects at short distances, while the latter coherence model is suitable for two-point coherence effects at longer distances. Considering that the total length of large-span spatial structures is at most in the range of hundreds of meters, which belongs to the short distance category, this paper selects the first Harichandran Vanmarcke (H-V) coherence function model for subsequent structural response analysis calculations.
According to the EVENT 5 recorded by the SMART-1 array, the following coherence function is obtained:
Among them, is a function about , which can be obtained from the corresponding seismic records.
According to the EVENT 39 and 40 recorded by the SMART-1 array, the following coherence functions are obtained:
At this moment:
Among them, represents the angle between the direction of seismic wave propagation and the straight line between two points on the ground, and the remaining parameters are recorded by the SMART-1 array. Based on the above results, it can be concluded that:
Among them, and respectively represent the projection distance of the straight line between two points in the direction of earthquake motion propagation and its normal direction, and other parameters in the formula are obtained through regression analysis of the data recorded by the array:
The parameters were obtained from 15 LSST array records using nonlinear regression analysis, and the above formula is only applicable when the straight-line distance between two points is less than 100 m. Based on this, the Harichandran Vanmarcke coherence function model is obtained, as shown in Eqs. (24) to (26):
Among them, the parameters are calculated from Event 20 recorded by the SMART-1 array. Fig. 5 shows the values of the H-V coherence function model for common structural spans of 50 m, 100 m, and 200 m.
Fig. 3H-V coherence function
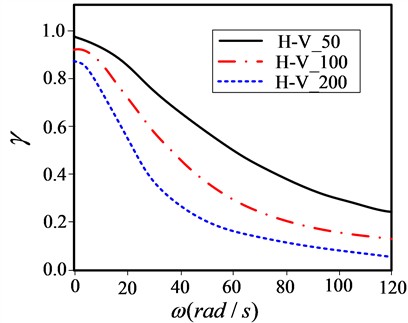
From Fig. 3, it can be seen that the larger the span of the structure, the lower the degree of coherence between the two points of the support, and the smaller the value of the coherence function. Based on this, the random vibration analysis of large-span spatial structures using new building materials has been completed.
4. Mechanical properties
4.1. Failure mode and crack propagation analysis
Fig. 4 illustrates the relationship between the failure mode of carbon fiber mesh reinforced mortar flexural specimens and the reinforcement parameters. Fig. 4(a) illustrates the occurrence of slip failure due to the low bonding strength between high-strength steel wire cloth and mortar. Fig. 4(b) shows that the failure mode of the C-28 specimen is vertical crack propagation with a flat fracture surface.
Fig. 4(c) illustrates that carbon fiber mesh can effectively suppress crack propagation after single-layer bottom reinforcement of mortar. Cracks propagate along both the vertical direction and the direction in which the carbon fiber mesh is laid. Therefore, transverse cracks appear at the carbon fiber reinforcement position of the failed specimen. Fig. 4(d) shows the failure photo of the B&T-CFGs-28 specimen, indicating that the top reinforcement of the mortar does not have a significant effect on suppressing crack propagation. Transverse cracks appear around the carbon fiber reinforced at the bottom, and only vertical cracks appear around the carbon fiber mesh reinforced at the top. Compared with the specimens reinforced with single-layer carbon fiber mesh, the mortar specimens reinforced with double-layer carbon fiber mesh will exhibit oblique section fractures, which are the main cause of specimen failure. The appearance of oblique section fractures indicates that the specimen is mainly subjected to shear force. Fig. 4(e) illustrates that anchoring the mortar test block at the end can effectively reduce the probability of oblique section fractures appearing at the end. The main failure modes at this time are vertical cracks and fracture of carbon fiber mesh.
Fig. 4Failure modes of test specimens
a) Enhance material slip
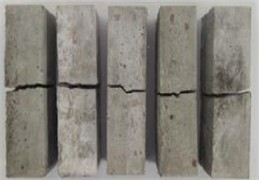
b) Mortar fracture
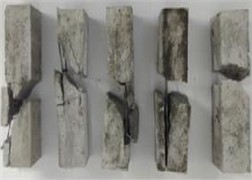
c) Transverse crack
d) Longitudinal crack
e) Grid fracture
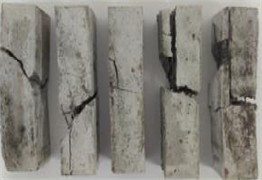
Fig. 5Failure modes of reinforced concrete beams with carbon fiber cloth

a) Carbon fiber cloth is broken and peeled off

b) Concrete crushing+peeling

c) Boundary+Stripping
Comparing the flexural failure modes of concrete beams reinforced with carbon fiber cloth with those reinforced with carbon fiber mesh in this experiment, the failure modes of concrete beams reinforced with carbon fiber cloth have two characteristics: both are accompanied by the peeling of carbon fiber cloth; The distribution range of cracks is wide. The main reason for the widespread distribution of cracks is that the concrete beam is reinforced with steel bars inside, while the carbon fiber mesh reinforced concrete beam specimens do not add steel bars as reinforcing phases, which has the advantage of preventing steel bar corrosion. Compared with strengthening concrete beams with carbon fiber mesh, carbon fiber cloth has higher requirements for the reinforcement base surface. If there are protrusions or depressions on the base surface, it will directly cause the carbon fiber cloth to bulge or even fall off at the corresponding position. The combination of carbon fiber mesh and polymer mortar reinforcement system can completely avoid the occurrence of the above situation. Therefore, the application prospects of carbon fiber mesh reinforcement are broader.
4.2. Node connection strength verification
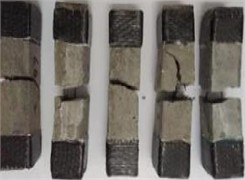
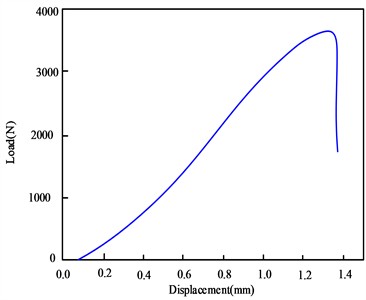
In order to verify the connection strength of large-span spatial structural nodes of carbon fiber composite materials, tensile failure tests were conducted on carbon fiber material connection specimens. The results are shown in Table 3, and the tensile failures were all shear failures of the carbon fiber specimens. The fracture surface is flat and the fracture location is entirely at the intersection of the upper and lower plates and the specimen. The bolt rod undergoes brittle fracture without yielding process, and its bearing capacity is relatively low, with an average of 3.44 KN. The typical load displacement curve during the stretching process is shown in Fig. 6. The increase in displacement at the beginning of the load displacement curve is always small due to the gap between the bolt rod and the specimen opening during the test. After the tensile test, there was no damage to the connecting plate, indicating that the carbon fiber specimen had a significant impact on its connection strength in this situation.
Table 3Tensile test results of carbon fiber composite specimens
Test piece number | SS-C-1 | SS-C-2 | SS-C-3 | SS-C-4 | SS-C-5 | Average |
Destructive load (KN) | 3.31 | 3.57 | 2.93 | 3.05 | 3.66 | 3.44 |
Fig. 6Load displacement curve of single hole connection specimen tensile test of carbon fiber bolt
In order to further test the connection strength of the carbon fiber composite material connecting plate, the carbon fiber bolts were replaced with steel bolts, and the connection structure was subjected to tensile failure tests. The results are shown in Table 4, and the load displacement curves are shown in Fig. 7.
From the above experimental results, it can be seen that the experiment was relatively successful, and the failure mode was a mixed failure, including compression failure, as well as shear and tensile failure, with complex failure modes. Furthermore, it can be observed that the cross-section of the specimen occurs at the center of the opening, as the cross-sectional area of the specimen in the opening area decreases and the stress in the cross-section increases under the same tension, and there is stress concentration in the opening area. At the same time, due to the squeezing effect on the large-span spatial structure specimen, the specimen will undergo compression and shear failure in local areas, and the compression failure is not in the entire thickness direction, but only in a part, which is the result of being subjected to a torsional force.
Fig. 7Load displacement curve of single hole connection specimen tensile test of steel bolt
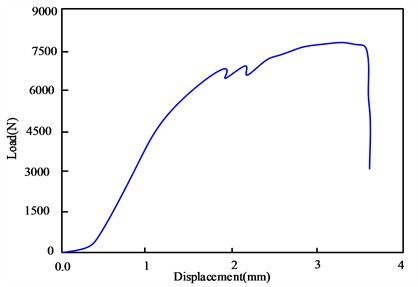
a) SS-S-1
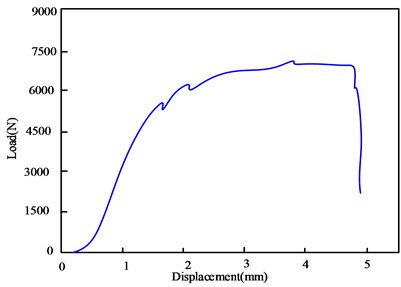
b) SS-S-2
Table 4Tensile test results of single hole connection specimens of steel bolts
Test piece number | Experimental failure phenomenon | Failure load |
SS-S-1 | One of the specimens exhibited a mixed tensile and compressive failure mode. The tensile fracture deviates from the middle position of the circular hole, while the fracture is in a straight line along the -axis. A small amount of carbon fiber debris appeared at the extrusion site. There is an indentation on one end of the contact position between the nut and the specimen, and the surface fibers on the other end are raised. The other specimen was compressed and damaged, with a significantly smaller damaged area and a tendency to break along the hole, but without obvious damage | 7.95 KN |
SS-S-2 | One of the specimens exhibited a mixed tensile and compressive failure mode. The tensile fracture deviates from the middle position of the circular hole, while the fracture is in a straight line along the -axis. A small amount of fiber debris is raised at the compression point. There is an indentation on one end of the contact position between the nut and the specimen, and the surface fibers on the other end are raised | 7.45 KN |
5. Conclusions
The paper takes carbon fiber reinforced polymer (CFRP) as an example, and prepares CFRP large-span structural specimens through surface coating treatment of carbon fiber and composite material preparation process; Enhancement effect of interfacial bonding strength of CFRP large-span spatial structures through bidirectional shear experiments; Design large-span spatial structures using new building materials and establish multi-scale finite element models for vibration reduction systems; Analyze the random vibration of large-span spatial structures, improve the Kanai Tajimi model using the random vibration power spectral density function, and calculate the structural response power spectrum for response analysis of CFRP large-span spatial structures. The following conclusions were drawn through experiments:
1) Carbon fiber cloth has high requirements for reinforcing the base surface. If there are protrusions or depressions on the base surface, it will directly cause the carbon fiber cloth to bulge or even fall off at the corresponding position. The combination of carbon fiber mesh and polymer mortar reinforcement system can completely avoid the occurrence of the above situation. Therefore, the application prospects of carbon fiber mesh reinforcement are broader.
2) Tensile failure is caused by shear failure of carbon fiber bolts. The fracture surface is flat and the fracture location is entirely at the intersection of the upper and lower plates and the specimen. The specimen undergoes brittle fracture without yielding process, and its bearing capacity is relatively low, with an average of 3.44 KN. After the tensile test, there was no damage to the connecting plate of the specimen, indicating that the carbon fiber specimen had a significant impact on its connection strength in this situation.
3) The failure mode is a mixed failure, which includes compression failure, shear and tensile failure, and the failure mode is complex. Furthermore, it can be observed that the cross-section of the specimen occurs at the center of the opening, as the cross-sectional area of the specimen in the opening area decreases and the stress in the cross-section increases under the same tension, and there is stress concentration in the opening area. At the same time, due to the squeezing effect with the large-span spatial structure specimen, the specimen will undergo compression and shear failure in local areas.
References
-
J. Zeng, Z. Zhu, H. Lv, and D. Wang., “Progress in seismic research of large-span spatial structures considering soil structure interaction.,” Journal of Building Science and Engineering, Vol. 41, No. 1, pp. 69–82, 2024, https://doi.org/10.19815/j.jace.2023.06003
-
W. Zhong, “Design and analysis of large-span steel structure corridor structure in a certain exhibition center,” Guangzhou Architecture, Vol. 52, No. 8, pp. 34–38, 2024.
-
Feng et al., “Key points and analysis of structural design for a high area large-span connecting bridge in a project in Qianhai Cooperation Zone, Shenzhen.,” Building Structure, Vol. 53, No. 23, pp. 11–17, 2023, https://doi.org/10.19701/j.jzjg.zj230071
-
C. Cao, “Vibration performance analysis of large-span streamlined steel box girder suspension bridge based on frequency domain analysis,” Sichuan Architecture, Vol. 43, No. 4, pp. 201–203, 2023.
-
N. U. Islam and R. S. Jangid, “Optimum parameters of tuned inerter damper for damped structures,” Journal of Sound and Vibration, Vol. 537, p. 117218, Oct. 2022, https://doi.org/10.1016/j.jsv.2022.117218
-
X. Xiao and Z. Xue, “Research on wind-induced random vibration control of long-span cable-stayed bridges based on TMD.,” Journal of Wuhan University of Technology (Transportation Science and Engineering Edition), Vol. 48, No. 4, pp. 732–736, 2024.
-
Y. Zhao, Y. Zhang, and J. Lin, “Closed-form solution for non-stationary stochastic vibration analysis of long-span bridges based on the virtual incentive method,” Chinese Journal of Computational Mechanics, Vol. 41, No. 1, pp. 202–208, 2024.
-
X. Xiao and J. Liu, “Vibration analysis of long-span cable-stayed bridges under wind load,” Engineering and Construction, Vol. 38, No. 4, pp. 951–954, 2024.
-
T. Fan, Y. Lv, C. Zhang, and J. Deng, “Analysis of large suspended steel trusses and large span corridor structures in Zhongjiaocheng, Central China,” Building Structure, Vol. 54, No. 7, pp. 93–99, 2024, https://doi.org/10.19701/j.jzjg.ls220223
-
Y. Ding, Q. Liu, L. Zong, and J. Liu, “Analysis of the influence of site soil on the seismic response of the roof space structure of hub stations,” Earthquake Engineering and Engineering Dynamics, Vol. 43, No. 2, pp. 34–41, 2023, https://doi.org/10.13197/j.eeed.2023.0204
-
X. Li, “Vibration reduction analysis of large-span steel structure connected floor in a certain project,” Guangdong Architecture Civil Engineering, Vol. 30, No. 6, pp. 87–89, 2023, https://doi.org/10.19731/j.gdtmyjz.2023.06.023
-
Q. Pan et al., “Seismic performance analysis of a large-span cantilever structure,” Building Structure, Vol. 53, pp. 631–637, 2023, https://doi.org/10.19701/j.jzjg.23s1709
-
Y. Zhang, “Performance analysis of large-span spatial structures with tension damping cables,” Journal of Building Structures, Vol. 44, No. 4, pp. 32–41, 2023.
-
H. Ding et al., “Vibration comfort analysis and control of a certain engineering corridor and irregular cantilever structure,” Building Structure, Vol. 54, No. 13, pp. 99–104, 2024, https://doi.org/10.19701/j.jzjg.20220167
-
Q. Hua, “Analysis of continuous collapse and construction process monitoring of large span open-close structures,” Industrial Architecture, Vol. 54, No. 4, pp. 90–98, 2024.
-
Q. Tan et al., “Analysis of human induced vibration comfort and TMD vibration reduction control of large-span and long cantilever steel structures,” Building Structure, Vol. 53, pp. 894–900, 2023, https://doi.org/10.19701/j.jzjg.23s2683
-
S. Wang, S. Ma, and H. Qiao, “Vibration response analysis of long-span suspension bridges under wind and CRH2 train loads,” Journal of Beijing University of Civil Engineering and Architecture, Vol. 40, No. 3, pp. 86–93, 2024, https://doi.org/10.19740/j.2096-9872.2024.03.10
About this article

This article is supported by the Science and Technology Research Program of Chongqing Municipal Education Commission (Grant No. KJZD-M202502001).
The datasets generated during and/or analyzed during the current study are available from the corresponding author on reasonable request.
Xi Zhang: conceptualization, data curation, formal analysis, investigation, methodology, software, visualization, writing-original draft, writing-review and editing. Jian Yin: conceptualization, software, visualization, methodology, writing-original draft, writing-review and editing, validation. Baiying Yang: data curation, investigation, validation, writing-review and editing, supervision.
The authors declare that they have no conflict of interest.
