Abstract
At present, most of the damage detection techniques based on global vibration and local guided wave have obvious limitations, which brings difficulties to the safety assessment of structures. To solve this problem, a damage location identification method based on micro-dynamic balance and inverse finite element is proposed. Firstly, the vibration frequency, measuring point density and damage magnitude were determined by using finite simulation composite plate structure. Secondly, a fiber grating sensor is attached to the surface of the laminate to receive the strain response signal of the structure under steady-state vibration, and the global displacement of the structure is constructed by inverse finite element method. Finally, the inverse finite element listing is introduced into the theoretical framework of the dynamic response of the micro-element, and the structural damage identification experiment based on the measured strain data is realized. The experimental results show that this method can effectively identify the structural damage area and has a special sensitivity to structural damage, and the identification accuracy and efficiency are high.
1. Introduction
Large-scale composite structures are facing complex chemical and physical environmental challenges (such as chemical corrosion, severe loads, etc.) during their service conditions, where the safety and integrity of the composite structures are seriously threatened [1, 2]. The forms of damage occurring in composite structures are complex and not easy to be detected, which makes it difficult to obtain the damage information in early stages and perform effective warning of structural failures. Vibration-based structural health monitoring (SHM) methods have shown potentials in the detection and localization of various damage in composite structures. However, most existing vibration-based methods are highly dependent on the prior information from benchmark models or baseline signals. For example, frequency-based methods [3-5] normally require eigen-frequencies of structures under their intact state, and various mode shape-based methods [6, 7] in detecting damage in structures also rely on baseline signals from the intact counterparts of damaged structures.
The damage identification method based on the examination of locally perturbed dynamic equilibrium of structures, also called pseudo excitation (PE) approach, has been rapidly developed in recent years [8-11]. The merit of the approach is that no baseline signals are needed to construct damage indices, since only the theoretical model (equation of motion) of the target structure is needed. In addition, damage sizes (with clear boundaries) can be accurately identified using this method due to the high-order derivatives of displacements included in the damage index. Ablitzera et al. [12] applied the method to identify dynamic loads in structures and verified the identification accuracy of the method in noisy environments; Xu Hao et al. used the approach to realize structural damage identification for the first time, with applications in beams [13, 14], plates [15], and typical civil engineering structures [16]. Moreover, the weak formulation of the damage index was derived [8]; Zhang et al. [17] used the PE approach to detect crack in isotropic beam structures based on the weak formulation of the damage index; Cao et al. [13]used the approach to identify damages in composite plate structures; Ablitzer et al. [12] applied the approach for structural/material parameter identification and successfully predicted the flexural stiffness coefficients of orthotropic anisotropic plate structures; Xu et al. [8] realized joint identification of material parameters and damage in beam structures using the PE approach.
However, the PE approach is restricted in several aspects. First, simultaneous and dense displacement measurements are difficult during the service conditions of composite structures, which makes the method hard to be applied in engineering practice. Second, relying on high-order derivatives of dynamic displacements, the method is highly vulnerable to measurement noise, which cannot be avoided in real applications. This causes degradation of the accuracy and reliability of the approach [8, 12, 18].
Compared with dynamic displacement measurement, online monitoring of dynamic strain data is more practical and efficient, and has been widely applied in engineering [19-21]. And based on measured strains, displacement field can be reconstructed using different methods. The inverse finite element method (iFEM), first proposed by Tessler et al. [18], has proven to be promising in reconstructing the full-field displacements of structures [22-24]. Among different reconstruction methods, the iFEM constructed inverse elements analogous to those used in traditional FEM [25, 26]. The transfer function between the structural strain field and the displacement field can be obtained based on the least-squares variational equations integrating the theoretical and measured structural surface strains. Recently, iFEM was combined with the PE approach to identify damage in the numerical models of composite plates [27, 28]. It is shown that small damage can be accurately identified. However, there is lacking of experimental evidence for this method because of the restrictions in sensor technology.
In this study, FBG array was applied to capture dense dynamic strains on the surface of a composite plate, and the dynamic strains were used as inputs to the iFEM to generate dynamic displacements of the structure. The damage index of PE approach was then constructed using the reconstructed dynamic displacements. Based on FBG arrays, the dynamic structural strains can be captured simultaneously, which implies that the PE approach can be applied in a real-time manner. The experimental results shows the potential of PE approach to be applied in various engineering practices.
2. Methodology
2.1. Inverse finite element method (iFEM)
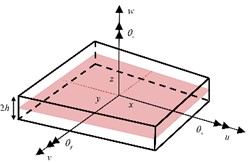
The iFEM was developed to reconstruct the deformation state of structures based on discretely measured strains at the structural surface. And several inverse elements were proposed to address the deformation reconstruction problem of different structures. Among them, the four-node quadrilateral element (iQS4), developed for plate and shell structures, has been widely used due to its excellent performance. Therefore, without any loss of generality, this work adopted the iQS4 (shown in Fig. 1) element to perform the iFEM analysis. A local coordinate system is built for convenience, with the plane coincident with the element's midplane and the thickness direction as the -axis.
According to the first-order shear deformation theory, the displacement at an arbitrary point of the element can be represented by three components, i.e.:
where and are the mid-plane displacements in the and directions, respectively. and are the rotation around the and axes, respectively, and is the weighted average of the deflection, that is, the displacement of over the thickness of the plate.
Fig. 1The iQS4 inverse element
According to the strain-displacement relation of linear elasticity theory, the strain expression can be obtained from:
where:
and where the matrices [17], and contain derivatives of the shape functionals, as detailedin [8]. For an iQS4 element, the functional, is defined as [8]:
where:
where represents the mid-plane area of the element. The positive coefficients , , and are associated with the membrane, bending, and shear strain components, respectively; they determine the extent of constraint between the analytical strains and their experimental counterparts. These coefficients are usually set to 1 at the elements with experimental strain measures. Otherwise, they are adjusted to a small value such as 10-5 to maintain the necessary interpolation connectivity among elements.
Minimizing Eq. (7) with respect to the nodal DOFs yields:
where is a stiffness-like matrix determined by the element and sensor network topology and is a vector function of the measured strain values. The global equation system can be assembled by the element contributions shown in Eq. (8), which allows the full-field displacements determining the deformed shapes of structures to be solved.
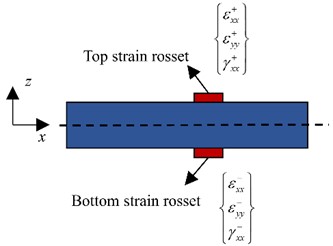
In experiments, strains are measured on the upper (+) and lower (-) surfaces of a plate, respectively, as illustrated in Fig. 2. At a particular in-plane position, the membrane strains and bending curvatures can be constructed according:
where the measured surface strains are denoted by and the superscript implies the existence of errors involved in strain measurement. In applications, the surface strains can be measured by sensors such as conventional strain gauges or embedded fiber optic networks. The measurement of the transverse shear strains often non-trivial, where multi-layer of sensors along the plate thickness are often required. However, the magnitudes of transverse shear strains are normally insignificant particularly in thin-walled structures. Thus, the experimental part of the transverse shear strains can be omitted. Moreover, the in-plane shear strain, i.e. and in Eqs. (9) and (10) are also omitted due to their insignificant magnitudes in the present work. Therefore, only linear strains are utilized for displacement reconstruction in the following study.
Fig. 2Discrete strains measured on structural surface
2.2. PE approach
The DI of the PE approach is directly established based on the equation of motion, which has a concise and clear physical meaning. The general expression of DI under steady vibration state is:
where is the damage index; are the moment and torque; is the vibration displacement; , and are the density, thickness and angular vibration frequency, respectively. For symmetry laminates, the moments can be calculated according to:
where is the bending stiffness matrix of laminated plates defined by:
In theory, this method is suitable for complex systems composed of various structural components such as beams, plates, and shells. As observed, DI is highly sensitive to external load and damage, which can be constructed by displacement. Since composite laminates are investigated in this study, the DI is constructed according to laminate vibration theory. The damage index DI was established according to Eqs. (11), (12), and (13). As shown in Eq. (14):
where “,” are used to represent the differentiation of subscripts is the deflection. In the equation, it can be found that when equilibrium conditions are considered, the right side is the combination of internal force and inertial force, and the left side is the external excitation. In the region without external excitation but containing damage, DI will show obvious singularity. In the region without damage and excitation, the DI value is zero because equilibrium condition is satisfied.
2.3. Damage identification methods
The flow chart of the damage identification method integrating iFEM method and PE approach, relying on strain measurement based on FBG arrays, is shown in Fig. 3. The iFEM is able to rapidly convert the measured discretized dynamic strains into vibration displacements, which are then used as inputs to the PE approach, and finally the damage indices can be constructed to indicate the damage areas in the structure. It is worth noting that this method is a model-free approach, relying only on data that can be obtained from experimental tests. By using dynamic strain input other than dynamic displacements, the engineering applicability of the method is substantially improved. At last, since strain measurement indirectly reduces the derivation order, the noise immunity of the method is significantly improved, which in turn improves the identification accuracy and robustness.
3. Numerical validation
The laminate plate is 450 mm in length, 360 mm in width and 2.4 mm in thickness, and there are 16 unidirectional layers across the thickness. The structure is made of T300 carbon fiber composite material, and the material properties are shown in Table 1. The preset crack is 30 mm in length and 2 mm width, and the crack is penetrating the first three layers. The plate containing the crack is shown in Fig. 4(a), and the orthogonal symmetrical ply is shown in Fig. 4(b). Considering that it is difficult to use 2D shell element to model cracks that partially penetrates the plate thickness, we adopted 3D solid elements to simulate the crack.
Fig. 3Overall flowchart of the damage identification method
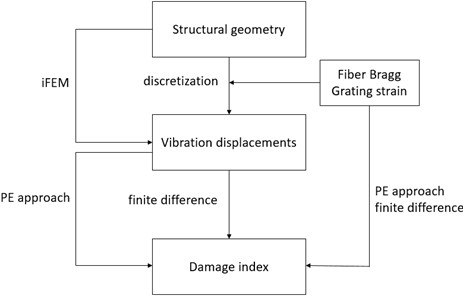
Fig. 4The composite laminate plate

a) The plate with a partially penetrated crack
b) FE model of the composite layup
Table 1Material properties of T300
E11 | E22 | μ12 | μ23 | G12 |
157900 | 9584 | 0.32 | 5930 | 5930 |
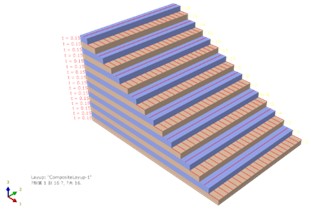
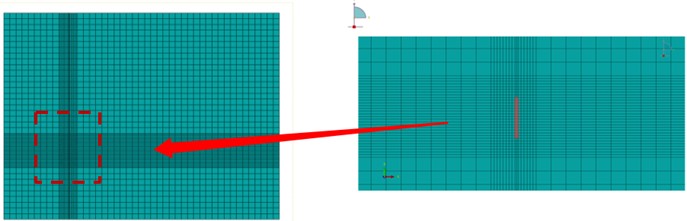
FE analysis was carried out using ABAQUS commercial software. Cohesive interfacial elements were inserted between the two crack surfaces to simulate the opening behavior of the crack. The cantilevered laminate was non-uniformly meshed using SC8R eight-node quadrilateral elements. For the consideration of simulation accuracy and the subsequent grating selection for strain extraction, the overall element size is 2 mm, and the mesh density was increased around the crack only. The FE meshes was shown in Figs. 5.
Fig. 5The FE mesh in the laminate plate and around the crack
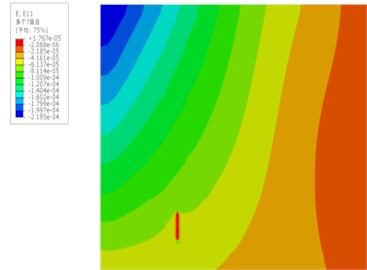
It should be noted that, to be consistent with experimental conditions, strains were only extracted from the first surface layer of the plate to mimic strain measurement using FBG sensors. Eighty strain measurement points were arranged on the plate surface, where 10 points were along the length and 8 points were along the width of the plate. A harmonic excitation was applied perpendicular to the plate. The excitation frequency was chosen to be 200 Hz. The extracted strain data was then inputted into the iFEM, and the PE approach was then used to identify the damaged area. The strain contour and damage identification results obtained through finite FE simulation are shown in Fig. 6. It can be observed that the crack location can be precisely identified relying on the integrated utilization of iFEM and PE approach.
Fig. 6a) The dynamic strain distribution and b) damage identification results along the plate surface
a)
b)
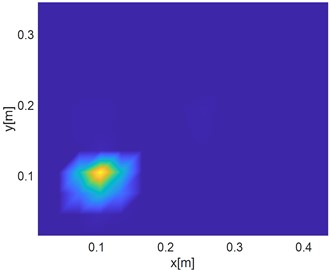
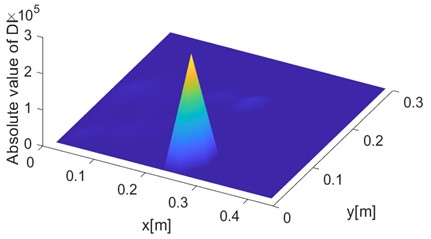
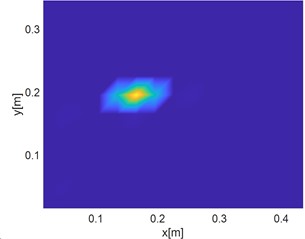
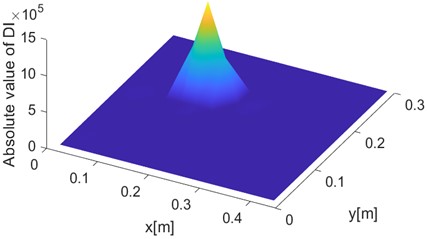
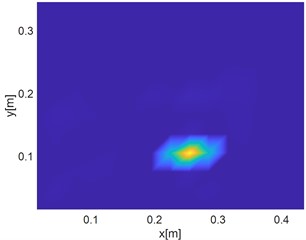
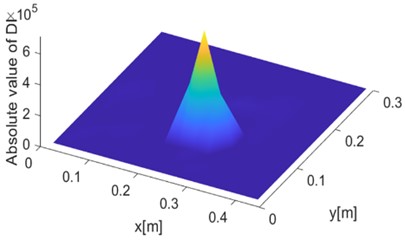
The performance of the proposed algorithm in damage localization were examined by identifying cracks located at other three different locations, i.e., crack centers of being (255 mm, 105 mm), (165 mm, 195 mm) and (285 mm, 45 mm), respectively. The identification results are shown in Fig. 7. In the FE simulation results, it can be seen that crack locations can be well detected by the DI. In the 2D view, as shown in Fig. 7(a), (c) and (e), the crack is indicated by the yellow bright spot. In the 3D representation , on the other hand, the crack location is consistent with the peak of the DI value, as shown in Fig. 7(b), (d) and (f). Further analysis will be performed in the following study to estimate the damage localization error.
4. Experimental validation
4.1. Set-up
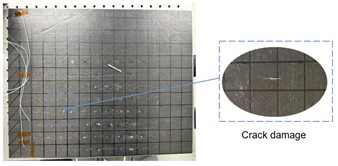
In order to further verify the feasibility of the method applied in practical engineering applications, a crack damage was identified experimentally in a carbon fiber reinforced laminate. The homemade vacuum-cured laminate (450 mm×360 mm) used in this paper is made of 16 layers of carbon fiber, which is consistent with the simulation model. The composite laminate was fabricated by firstly selecting the required carbon fiber/epoxy prepregs, which were cut and separated into 16 pieces according to 0° and 90° alternating layups. The laminated prepregs were stacked and covered using release cloth and then coverd into a vacuum bag. An air pump was used to generate vacuum environment. The prepregs were heated using a heating table. The cured plate was cut to be consistent with the required size.
A partially penetrated crack was cut at the surface of the plate. The depth of the crack is through the first three layers of the laminate, as shown in Fig. 8(a). The experimental specimen is consistent with the finite element model. One end of the plate was clamped by a fixture.
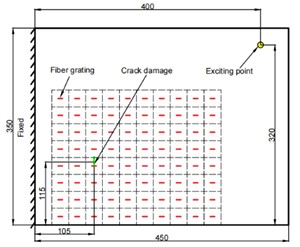
Due to the limitation of sensor amount, only a sub-region along the entire plate surface, measured 300 mm×240 mm, was selected for damage identification. At the same time, the FBG grating mesh is drawn on the plate surface, as shown in Fig. 8(b). There are in total 80 FBG sensors pasted on the plate surface, with 10 along the length and 8 along the width. The excitation point of a shaker is located in the upper right corner of the plate, outside the area of the monitoring zone.
Fig. 7FE-based damage identification results corresponding to crack locations at a) and b) x= 255 mm, y= 105 mm, c) and d) x= 165 mm, y= 195 mm and e) and f) x= 285 mm, y= 45 mm, respectively

a)
b)
c)
d)
e)
f)
Fig. 8Schematic diagram of CFRP board experimental design
a)
b)
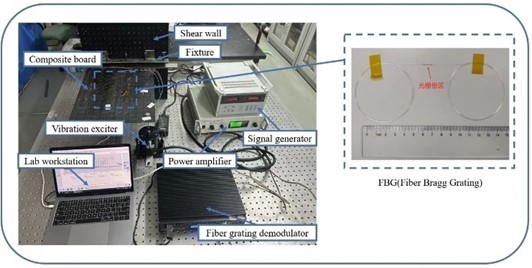
During the experiment, the optical wavelength range that can be demodulated is within 1500 nm-1580 nm. Considering there are four channels of data acquisition, we used four optical fibers simultaneously, with each fiber includes 20 FBG sensors, and the interval of the grating is 3 cm. Harmonic excitation was generated to excite the plate. The equipment used in the experiment include a signal generator, a signal amplifier, a shaker and a FBG demodulator MOI SI255. Through the MOI device demodulation, the computer completes the reception of the wavelength offset. The instrument device required for the damage identification experiment is shown in Fig. 9.
Fig. 9Photos of the experimental equipment
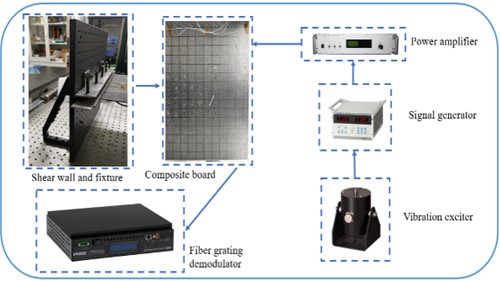
Online damage identification experiment is based on real-time input and output data. The overall process is as follows. Firstly, the sinusoidal excitation signal of the required specific frequency (200 Hz) is emitted by the signal generator. The power amplifier receives the sinusoidal signal and amplifies it. The amplified signal is transmitted to the shaker, which apply external excitation to the composite plate. The offset of the grating wavelength measured by the MOI device demodulated into strain data. The flow chart of the experiment is shown in Fig. 10.
Fig. 10Experimental flowchart
5. Results and discussion
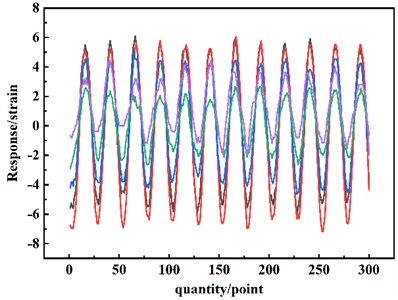
During the experiment, the excitation frequency is 200 Hz and the sampling frequency is 5000 Hz. The duration of vibration is 30 s. In order to make the representation more concise, this paper only selects part of the received data of five sensors for analysis, and a total of 300 responses are selected for each sensor. The collected data is smoothed as the analysis object as shown in Fig. 11. Through data analysis, it can be clearly seen that the excitation signal is sinusoidal excitation, and the period is the reciprocal of the frequency. It can be found that 25 measuring points are a period, and a total of 12 periods are selected within the point, which proves the usability of the excitation signal, and each channel reaches the amplitude of the vibration response at the same time, avoiding the error caused by the phase difference.
Fig. 11Partial sampling data
In order to further analyze the damaged area, all strain data during the vibration process is taken for calculation. Firstly, the vibration displacement of the structure is calculated according to the strain numerical structure. According to the inverse finite element theory, the displacement state of the structure at this time is restored. As shown in Fig. 12, it is found that the displacement at the excitation end is larger at this time.
The displacement and strain are extracted for micro-element dynamic theoretical analysis, and the damage index is calculated to draw 2D and 3D maps. As shown in Fig. 17 and Fig. 15. Through cloud image analysis, damage identification cannot be performed based on the strain value reconstruction at a certain moment, and the detection accuracy effect is not significant. Thus, the damaged area cannot be identified.
In order to solve the above problems, the method of calculating the average strain in the period is used to replace the strain value at a certain time. The collected data is processed periodically based on MATLAB, and the data of each measuring point is processed by multiple periodic averages to ensure the smoothness of the numerical curve.
The processed strain average strain is brought into the calculation to obtain the global displacement, the reconstructed displacement and the reconstructed strain are used as input parameters to calculate the damage index following regional damage identification calculation. The reconstructed displacement cloud map in the process is shown in Fig. 13.
Fig. 12Reverse finite element reconstruction commission
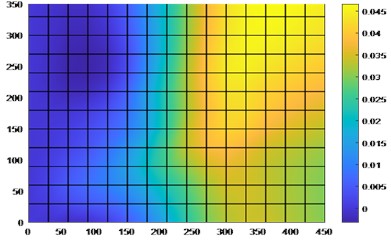
Fig. 13Inverse finite element displacement after processing
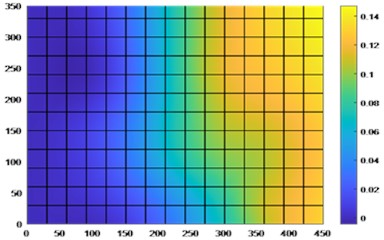
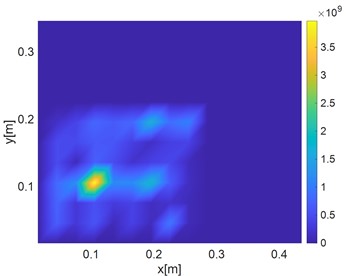
The DI index and damage area are shown in Fig. 16 and Fig. 17 Compared with the area recognition map of the untreated data, it is found that the recognition ability has been significantly improved, and the damage area can be effectively identified. In the three-dimensional diagram, it is found that there are some small numerical spikes, which is mainly due to the influence of external errors in the vibration process. However, the comparison from the perspective of order of magnitude can exclude the existence of other crack damage.
Fig. 143D damage identification diagram
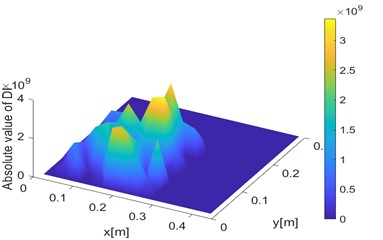
Fig. 152D damage identification diagram
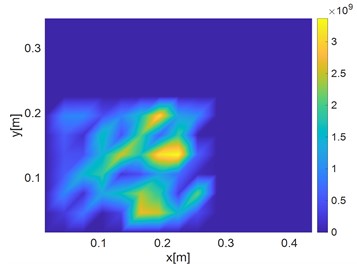
Fig. 163D image of damage identification after processing
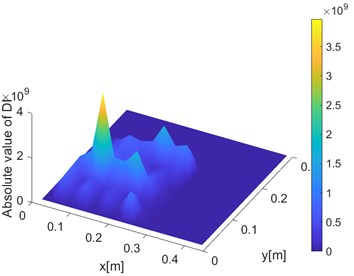
Fig. 172D image of damage identification after processing
In order to further evaluate the location accuracy of the proposed algorithm, the damage location error is defined as follows: coordinate location is performed on the structure monitoring area. The Cartesian coordinate system is established and the damage location error is defined according to the following formula:
where, and are the horizontal and vertical coordinates of the predicted damage center, and and are the horizontal and vertical coordinates of the real damage center, respectively. The actual and predicted positions are shown in Table 2.
Table 2Comparison of actual and predicted damage locations
Actual position / mm | Predicted position / mm | Error / mm |
(107, 109) | (105, 105) | 5 |
It can be seen that the predicted damage location is in good agreement with the actual damage location, and the general area of crack damage is still clear and accurate. Finally, it should be emphasized that the purpose of damage monitoring is to maximize the reliability and robustness of damage identification without prior knowledge of damage and excitation. Therefore, in order to further improve the accuracy of damage identification, the density of grating measurement points can be increased to solve this problem.
6. Conclusions
1) The monitoring method based on the micro-element dynamic equilibrium theory proposed in this paper is suitable for anisotropic composite plate structures. There is no need to measure the prior knowledge of the structure, and the implementation process is simple, which is helpful to the engineering application of composite structure damage monitoring technology.
2) Based on the theory of micro-element dynamic balance and inverse finite element damage monitoring method, using fiber Bragg grating sensor monitoring data and based on MATLAB application of inverse finite element theory to reverse the global displacement. Then through the micro-element dynamic response factor, we calculate the damage index DI. So that real damage area can be located, and the damage identification accuracy is high.
3) The fiber grating sensor is arranged on the monitoring structure, which can directly collect the state data of the structure in the real service state on the structure to be monitored, and does not cause performance interference to the structure itself. At the same time, it is not subject to electromagnetic interference. It can better solve the problem that the damage signal of the monitoring object cannot be collected in advance. In the follow-up study, the monitoring method of the structure under random vibration will be considered.
References
-
Wronkowicz-Katunin, Katunin, and Dragan, “Reconstruction of barely visible impact damage in composite structures based on non-destructive evaluation results,” Sensors, Vol. 19, No. 21, p. 4629, Oct. 2019, https://doi.org/10.3390/s19214629
-
S. Z. H. Shah, S. Karuppanan, P. S. M. Megat-Yusoff, and Z. Sajid, “Impact resistance and damage tolerance of fiber reinforced composites: A review,” Composite Structures, Vol. 217, pp. 100–121, Jun. 2019, https://doi.org/10.1016/j.compstruct.2019.03.021
-
J.-T. Kim, Y.-S. Ryu, H.-M. Cho, and N. Stubbs, “Damage identification in beam-type structures: frequency-based method vs mode-shape-based method,” Engineering Structures, Vol. 25, No. 1, pp. 57–67, Jan. 2003, https://doi.org/10.1016/s0141-0296(02)00118-9
-
K. H. Barad, D. S. Sharma, and V. Vyas, “Crack detection in cantilever beam by frequency based method,” Procedia Engineering, Vol. 51, pp. 770–775, Jan. 2013, https://doi.org/10.1016/j.proeng.2013.01.110
-
P. F. Odgaard and J. Stoustrup, “Gear-box fault detection using time-frequency based methods,” Annual Reviews in Control, Vol. 40, pp. 50–58, Jan. 2015, https://doi.org/10.1016/j.arcontrol.2015.09.004
-
S. Rucevskis, R. Janeliukstis, P. Akishin, and A. Chate, “Mode shape-based damage detection in plate structure without baseline data,” Structural Control and Health Monitoring, Vol. 23, No. 9, pp. 1180–1193, Jan. 2016, https://doi.org/10.1002/stc.1838
-
P. Qiao, K. Lu, W. Lestari, and J. Wang, “Curvature mode shape-based damage detection in composite laminated plates,” Composite Structures, Vol. 80, No. 3, pp. 409–428, Oct. 2007, https://doi.org/10.1016/j.compstruct.2006.05.026
-
H. Xu, Z. Su, L. Cheng, and J.-L. Guyader, “A “Pseudo-excitation” approach for structural damage identification: From “Strong” to “Weak” modality,” Journal of Sound and Vibration, Vol. 337, pp. 181–198, Feb. 2015, https://doi.org/10.1016/j.jsv.2014.10.035
-
T. Li, M. Cao, J. Li, L. Yang, H. Xu, and Z. Wu, “Structural damage identification based on integrated utilization of inverse finite element method and pseudo-excitation approach,” Sensors, Vol. 21, No. 2, p. 606, Jan. 2021, https://doi.org/10.3390/s21020606
-
G. Zhao, K. Rui, S. X. Dou, and W. Sun, “Heterostructures for electrochemical hydrogen evolution reaction: a review,” Advanced Functional Materials, Vol. 28, No. 43, Aug. 2018, https://doi.org/10.1002/adfm.201803291
-
Y.-W. Zhang, Y. Zhao, Y.-H. Zhang, J.-H. Lin, and X.-W. He, “Riding comfort optimization of railway trains based on pseudo-excitation method and symplectic method,” Journal of Sound and Vibration, Vol. 332, No. 21, pp. 5255–5270, Oct. 2013, https://doi.org/10.1016/j.jsv.2013.05.018
-
L. Sun, C. F. Liu, Z. Zong, and X. L. Dong, “Fatigue damage analysis of the deepwater riser from VIV using pseudo-excitation method,” Marine Structures, Vol. 37, pp. 86–110, Jul. 2014, https://doi.org/10.1016/j.marstruc.2014.03.004
-
F. Ablitzer, C. Pézerat, B. Lascoup, and J. Brocail, “Identification of the flexural stiffness parameters of an orthotropic plate from the local dynamic equilibrium without a priori knowledge of the principal directions,” Journal of Sound and Vibration, Vol. 404, pp. 31–46, Sep. 2017, https://doi.org/10.1016/j.jsv.2017.05.037
-
M. Cao, L. Cheng, Z. Su, and H. Xu, “A multi-scale pseudo-force model in wavelet domain for identification of damage in structural components,” Mechanical Systems and Signal Processing, Vol. 28, pp. 638–659, Apr. 2012, https://doi.org/10.1016/j.ymssp.2011.11.011
-
H. Xu, L. Cheng, Z. Su, and J.-L. Guyader, “Identification of structural damage based on locally perturbed dynamic equilibrium with an application to beam component,” Journal of Sound and Vibration, Vol. 330, No. 24, pp. 5963–5981, Nov. 2011, https://doi.org/10.1016/j.jsv.2011.07.028
-
H. Xu, L. Cheng, Z. Su, and J.-L. Guyader, “Damage visualization based on local dynamic perturbation: Theory and application to characterization of multi-damage in a plane structure,” Journal of Sound and Vibration, Vol. 332, No. 14, pp. 3438–3462, Jul. 2013, https://doi.org/10.1016/j.jsv.2013.01.033
-
H. Xu, Z. Su, L. Cheng, J.-L. Guyader, and P. Hamelin, “Reconstructing interfacial force distribution for identification of multi-debonding in steel-reinforced concrete structures using noncontact laser vibrometry,” Structural Health Monitoring, Vol. 12, No. 5-6, pp. 507–521, Sep. 2013, https://doi.org/10.1177/1475921713502837
-
C. Zhang, L. Cheng, H. Xu, and J. H. Qiu, “Structural damage detection based on virtual element boundary measurement,” Journal of Sound and Vibration, Vol. 372, pp. 133–146, Jun. 2016, https://doi.org/10.1016/j.jsv.2016.02.035
-
A. Tessler and J. L. Spangler, “A least-squares variational method for full-field reconstruction of elastic deformations in shear-deformable plates and shells,” Computer Methods in Applied Mechanics and Engineering, Vol. 194, No. 2-5, pp. 327–339, Feb. 2005, https://doi.org/10.1016/j.cma.2004.03.015
-
H. Alexakis, F. D.-H. Lau, and M. J. Dejong, “Fibre optic sensing of ageing railway infrastructure enhanced with statistical shape analysis,” in Journal of Civil Structural Health Monitoring, Vol. 11, No. 1, pp. 49–67, Sep. 2020, https://doi.org/10.1007/s13349-020-00437-w
-
M. Kurata, X. Li, K. Fujita, and M. Yamaguchi, “Piezoelectric dynamic strain monitoring for detecting local seismic damage in steel buildings,” Smart Materials and Structures, Vol. 22, No. 11, p. 115002, Nov. 2013, https://doi.org/10.1088/0964-1726/22/11/115002
-
J. Yuan, Y. Zhang, G. Li, S. Liu, and R. Zhu, “Printable and stretchable conductive elastomers for monitoring dynamic strain with high fidelity,” Advanced Functional Materials, Vol. 32, No. 34, p. 22048, Jun. 2022, https://doi.org/10.1002/adfm.202204878
-
U. Papa, S. Russo, A. Lamboglia, G. Del Core, and G. Iannuzzo, “Health structure monitoring for the design of an innovative UAS fixed wing through inverse finite element method (iFEM),” Aerospace Science and Technology, Vol. 69, pp. 439–448, Oct. 2017, https://doi.org/10.1016/j.ast.2017.07.005
-
A. Kefal and E. Oterkus, “Displacement and stress monitoring of a chemical tanker based on inverse finite element method,” Ocean Engineering, Vol. 112, pp. 33–46, Jan. 2016, https://doi.org/10.1016/j.oceaneng.2015.11.032
-
A. Kefal, I. E. Tabrizi, M. Tansan, E. Kisa, and M. Yildiz, “An experimental implementation of inverse finite element method for real-time shape and strain sensing of composite and sandwich structures,” Composite Structures, Vol. 258, p. 113431, Feb. 2021, https://doi.org/10.1016/j.compstruct.2020.113431
-
R. Roy, A. Tessler, C. Surace, and M. Gherlone, “Efficient shape sensing of plate structures using the inverse Finite Element Method aided by strain pre-extrapolation,” Thin-Walled Structures, Vol. 180, p. 109798, Nov. 2022, https://doi.org/10.1016/j.tws.2022.109798
-
M. A. Abdollahzadeh, I. E. Tabrizi, A. Kefal, and M. Yildiz, “A combined experimental/numerical study on deformation sensing of sandwich structures through inverse analysis of pre-extrapolated strain measurements,” Measurement, Vol. 185, p. 110031, Nov. 2021, https://doi.org/10.1016/j.measurement.2021.110031
-
S. E. Pierce, K. D. Angielczyk, and E. J. Rayfield, “Patterns of morphospace occupation and mechanical performance in extant crocodilian skulls: a combined geometric morphometric and finite element modeling approach,” Journal of Morphology, Vol. 269, No. 7, pp. 840–864, May 2008, https://doi.org/10.1002/jmor.10627
-
A. Bhaduri and D. Choudhury, “Serviceability-based finite-element approach on analyzing combined pile-raft foundation,” International Journal of Geomechanics, Vol. 20, No. 2, p. 04019, Feb. 2020, https://doi.org/10.1061/(asce)gm.1943-5622.0001580
About this article

This study was supported by the National Science Foundation of China (No. 12072056), the Jiangsu International Joint Research and Development Program (No. BZ2022010), and the Jiangsu-Czech Bilateral Co-funding R&D Project (No. BZ2023011).
The datasets generated during and/or analyzed during the current study are available from the corresponding author on reasonable request.
Yuan Ma: investigation, visualization, writing – original draft preparation; Minjing Liu: supervision; Tengteng Li: formal analysis, methodology; Alfred Strauss: methodology, writing – review and editing; Maosen Cao: writing – review and editing, funding acquisition; Hao Xu: conceptualization, methodology, supervision; Zhanjun Wu: supervision, funding acquisition.
The authors declare that they have no conflict of interest.
