Abstract
This study investigates noise sources and sound quality characteristics of a high-end air-cooled frost-free refrigerator to guide low-noise design and acoustic optimization. Sound intensity testing identified primary noise sources, revealing that compressor vibration, condenser aerodynamic noise, and condensing fan operation dominate the noise spectrum. Sound quality analysis, conducted using a digital artificial head and psychoacoustic metrics, demonstrated that loudness is influenced by the condensing fan and air-cooling system, sharpness correlates with left-side compressor noise, and fluctuation strength is primarily affected by low-frequency compressor. This integrated approach of noise source identification and sound quality evaluation provides actionable insights for enhancing acoustic performance in air-cooled refrigerators, balancing technical noise reduction with improved user comfort.
1. Introduction
The refrigerator is one of the indispensable household appliances in modern homes, being used multiple times daily. In recent years, air-cooled frost-free refrigerators have become mainstream products in the market due to their advantage of avoiding manual defrosting. Through intelligent air circulation technology and multi-air vent design, these refrigerators achieve more uniform cooling to ensure prolonged food freshness. However, they still exhibit significant noise issues. The presence of internal fans and multiple air vents can result in even more noticeable noise compared to direct-cooling refrigerators under certain operating conditions [1].
Scholars have conducted a series of studies on noise testing, analysis, simulation, and optimization for household appliances like air-cooled frost-free refrigerators. Du utilized acoustic black hole (ABH) technology to suppress vibration transmission in refrigerator support plates and optimized ABH design to minimize vibration-induced noise [2]. Atamer evaluated the impact of refrigerator noise on daily life by investigating users' noise exposure levels and their subjective perceptions [3]. Mao experimentally investigated the noise characteristics of compressors in refrigeration systems and implemented multilayer micro-perforated panel absorbers on discharge tubes to suppress compressor noise [4]. Son conducted noise source identification research on hermetic reciprocating compressors for refrigerators, verifying noise generation mechanisms in both time and frequency domains through short-time Fourier transform (STFT) analysis [5]. Almeida redesigned refrigerator compressor intake mufflers using Bragg scattering-induced wave attenuation bands, providing guidance for periodic muffler design [6]. Huang employed partial correlation analysis of blower noise signals to evaluate contributions of psychoacoustic metrics (including loudness, sharpness, roughness, fluctuation strength, tonality, and articulation index) to user discomfort [7]. Cingiz obtained vibration and noise data of different refrigerants to study their effects on compressor noise, revealing significant variations in noise levels depending on refrigerant types [8]. Zárate Espinosa characterized refrigerator noise through laboratory measurements, analyzing three components (compressor, evaporator fan, and condenser fan) and measuring surface sound intensity across frequencies [9]. Park developed a dynamic absorber integrated with discharge caps, conducting product tests on refrigerators with modified caps to reduce high-frequency noise in mechanical compartments [10]. Koruk quantified flow noise in household refrigerators through sound pressure measurements in anechoic chambers, combining holistic analysis and Fourier transform of acoustic data [11].
This paper presents noise source identification tests and sound quality analysis for a high-end air-cooled frost-free refrigerator. The research not only identifies primary noise sources and their dominant frequencies but also provides in-depth analysis of overall acoustic quality, identifying key components and factors affecting sound perception. These findings offer guidance for low-noise refrigerator design and sound quality improvement.
2. Refrigerator structure and sound intensity testing plan
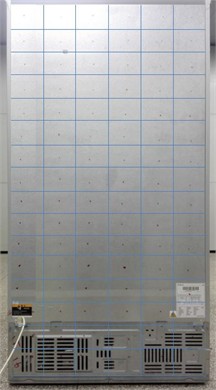
The air-cooled frost-free refrigerator has a total volume of 569L, with a freezer compartment volume of 201L. Fig. 1 shows the rear view of the refrigerator, where the back panel was selected as the sound intensity measurement surface. The measurement surface area was determined as 1650 mm × 900 mm, with grid dimensions set to 150 mm × 100 mm. The measurement points were arranged in 16 rows × 6 columns, totaling 96 points. The testing instrument employed was the B&K PULSE 3560B sound intensity measurement system. Two type 4197 microphones (A and B) were used, typically configured in a face-to-face arrangement during testing. The test was conducted in a semi anechoic chamber with a background noise of 18 dBA and a temperature of 20 ℃.
When using the two-microphone method for sound intensity measurement, the inter-microphone spacing is determined by the test frequency range. For high-frequency noise measurement, smaller spacing distances are required. Generally, the distance () between two microphones should not exceed 1/6 of the shortest wavelength to ensure phase difference errors remain within 1 dB. Based on the noise analysis frequency range, this study utilized 10 mm fixed-distance spacers. The distance between the measurement plane and the radiation surface significantly affects sound intensity measurement. At shorter distances, measured sound intensity levels show instability, while increasing distance causes progressive sound intensity attenuation. However, excessive distance reduces the sound intensity level gradient between measurement points, making it difficult to identify primary noise sources. Therefore, the measurement plane was positioned 100 mm from the test surface.
Fig. 1Grid division of refrigerator testing
3. Refrigerator sound intensity test results and noise source analysis
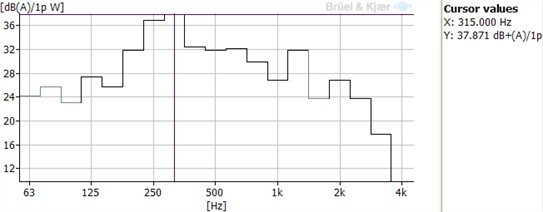
Fig. 2 shows the A-weighted 1/3 octave distribution of the noise power at the back of the air-cooled refrigerator under the rapid cooling mode. It can be seen that the noise energy is mainly concentrated in the frequency range of 200 Hz-750 Hz and 1.25 kHz, and the maximum sound power is at the center frequencies of 315 Hz and 250 Hz.
Fig. 2Octave A-weighted distribution of the radiated noise at the back of the refrigerator under the rapid cooling mode
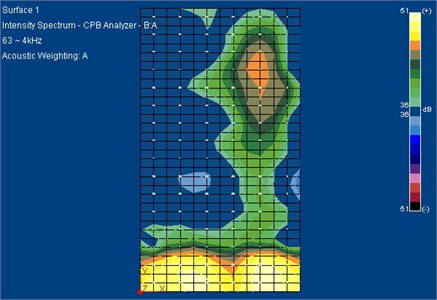
The sound intensity distribution of the back of the air-cooled refrigerator in the whole frequency domain is shown in Fig. 3. The brighter the color, the greater the sound intensity value. It can be seen that the brightest place appears at the compressor and condenser on the back of the refrigerator. Therefore, the noise is mainly concentrated at the compressor and condenser, that is, the vibration radiation noise generated by the compressor during operation and the aerodynamic noise of the condenser.
Fig. 3Full frequency domain sound intensity distribution on the back of air-cooled refrigerator under rapid cooling mode
4. Experimental plan for sound quality testing
This paper uses the head acoustic digital artificial head and head sound quality measurement system to measure the sound quality of the refrigerator in the rapid cooling mode. At present, there is no standard to follow for the sound quality test. In order to analyze the noise of the refrigerator in combination with the sound intensity test results, and with reference to the standards GB/T 6882-2008 and IEC 6070-1-2010, the artificial head was placed 1000 mm away from the center line of the refrigerator and 800 mm high along the center of the left and right directions, as shown in Fig. 4.
Fig. 4Layout scheme of digital artificial head for refrigerator sound quality test
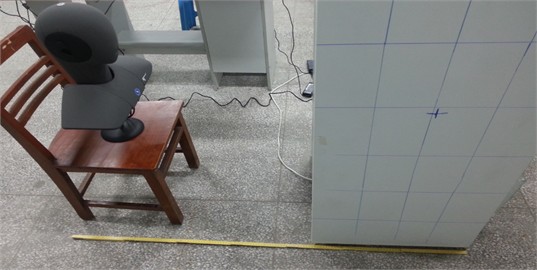
a) Physical drawing of head acoustic digital artificial head layout position
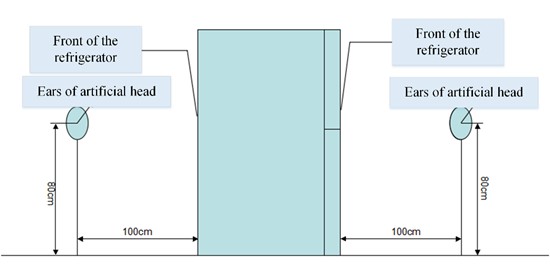
b) Layout of head acoustic digital artificial head
5. Analysis of sound quality test results of refrigerator
With the help of the test software package Head recorder, the noise signal is collected, and then the test signal is calculated and processed by the analysis and processing software ArtemiS, so that the objective evaluation parameter value of the sound quality of the refrigerator can be obtained. The sizes and charts of different evaluation parameters can be obtained in the corresponding window of ArtemiS results, and the processing data of the left and right ears of the digital artificial head can also be displayed at the same time for the convenience of analysis. Head Acoustic software has powerful analysis function and flexible operation. It can intercept noise signals efficiently and accurately calculate almost all psychoacoustic objective evaluation parameters, so as to provide guarantee for subsequent analysis and control of sound quality. The ArtemiS data analysis and processing interface is shown in Fig. 5 and values of psychoacoustic parameters of left and right ears under rapid cooling mode is shown in Table 1.
Table 1Values of psychoacoustic parameters of left and right ears under rapid cooling mode
Position | Parameter | ||||
Loudness (sone) | Sharpness (acum) | Roughness (asper) | Fluctuation (vacil) | SPL (dBA) | |
Left ear | 1.59 | 1.42 | 0.690 | 0.00482 | 36.0 |
Right ear | 1.68 | 1.30 | 0.695 | 0.00495 | 36.8 |
According to Fig. 5 and Table 1, in terms of loudness, the noise frequencies that contribute the most to the noise loudness value of air-cooled refrigerators are 2-4 Bark and 8-9 Bark, and the corresponding frequency ranges are 100 Hz-400 Hz and 840-1000 Hz. Moreover, the overall level of loudness in the right ear is relatively large, and the loudness curve of the right ear is higher than that of the left ear on the whole Bark frequency domain scale, so the noise loudness of the air-cooled refrigerator is mainly affected by the condensing fan and the air-cooled system.
Fig. 5Sound quality evaluation parameters of refrigerator noise signal under rapid cooling mode
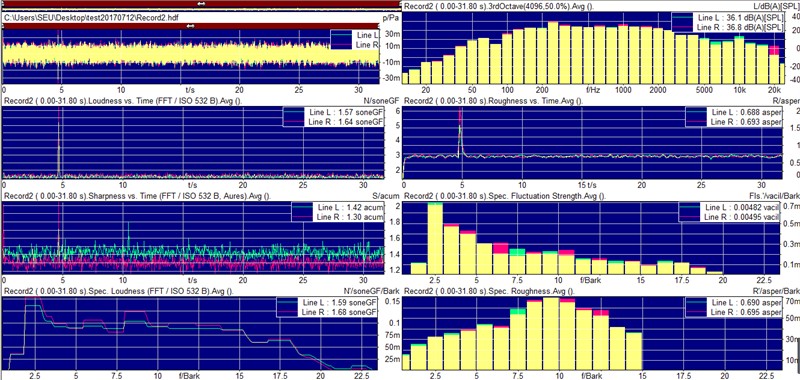
In terms of sharpness, there are obvious harsh components in the refrigerator test sound signal, that is, there are sharpness peaks, and the sharpness level of the left ear is relatively large. In the whole time domain scale, the sharpness curve of the left ear tip is always higher than that of the right ear tip. In terms of roughness, the noise frequency band that contributes greatly to the roughness value of the air-cooled refrigerator is concentrated in 7-12 Bark, with the peak frequency of 9-10 Bark and the corresponding frequency of 1000 Hz-1170 Hz. In addition, it can be seen that the roughness level of the left ear is always higher than that of the right ear in the critical frequency band of 8-12 Bark. In terms of fluctuation, the noise with a critical frequency band of 2-5 Bark has a greater impact on the noise fluctuation of the refrigerator. The peak frequency is in the range of 2-3 Bark, and the corresponding range is 150 Hz-250 Hz. At the same time, it was found that the fluctuation of the left ear was higher than that of the right ear at the peak critical frequency band, so the fluctuation of the air-cooled refrigerator noise was more affected by the noise of the left compressor.
6. Conclusions
Aiming at the noise problem of the air-cooled frost-free refrigerator, this paper uses the sound intensity test method to identify the noise source of the air-cooled frost-free refrigerator, and uses the artificial head to further test and analyze the sound quality of the refrigerator noise. The test and analysis results can provide guidance and reference for the low noise design of refrigerator and the improvement of sound quality. However, there are certain limitations to this paper, as it is a measurement conducted on a single refrigerator in one operating mode.
References
-
X. Du, Q. Fu, J. Zhang, and C. Zong, “Numerical and experimental study on suppression effect of acoustic black hole on vibration transmission of refrigerator compressor,” Applied Sciences, Vol. 11, No. 18, p. 8622, Sep. 2021, https://doi.org/10.3390/app11188622
-
X. Du and Q. Fu, “Surrogate model-based multi-objective design optimization of vibration suppression effect of acoustic black holes and damping materials on a rectangular plate,” Applied Acoustics, Vol. 217, p. 109837, Feb. 2024, https://doi.org/10.1016/j.apacoust.2023.109837
-
S. Atamer, P. Kosowski, and E. Altinsoy, “A study on the perception of refrigerator noise in everyday life,” in INTER-NOISE and NOISE-CON Congress and Conference Proceedings, Vol. 270, No. 4, pp. 7350–7361, Oct. 2024, https://doi.org/10.3397/in_2024_3951
-
Y. Mao, C. Fan, Z. Zhang, S. Song, and C. Xu, “Control of noise generated from centrifugal refrigeration compressor,” Mechanical Systems and Signal Processing, Vol. 152, p. 107466, May 2021, https://doi.org/10.1016/j.ymssp.2020.107466
-
Y. Son, J. Choi, and S. Lee, “Noise source identification of the hermetic reciprocating compressor for refrigerator,” Journal of Mechanical Science and Technology, Vol. 35, No. 11, pp. 4849–4858, Oct. 2021, https://doi.org/10.1007/s12206-021-1004-3
-
V. F. Almeida, V. D. Lima, and J. R. F. Arruda, “Applying the phononic crystal concept to the intake muffler of a refrigeration compressor,” Applied Acoustics, Vol. 194, p. 108800, Jun. 2022, https://doi.org/10.1016/j.apacoust.2022.108800
-
Y. Huang and Q. Zheng, “Sound quality modelling of hairdryer noise,” Applied Acoustics, Vol. 197, p. 108904, Aug. 2022, https://doi.org/10.1016/j.apacoust.2022.108904
-
Z. Cingiz, F. Katircioğlu, S. Saridemir, G. Yildiz, and Y. Çay, “Experimental investigation of the effects of different refrigerants used in the refrigeration system on compressor vibrations and noise,” International Advanced Researches and Engineering Journal, Vol. 5, No. 2, pp. 152–162, Aug. 2021, https://doi.org/10.35860/iarej.859423
-
R. Zárate Espinosa, J. Poblet-Puig, M. Ortega Breña, and M. López Parra, “Case study: experimental characterization of noise and vibration sources in a refrigerator,” Noise Control Engineering Journal, Vol. 69, No. 6, pp. 477–489, Nov. 2021, https://doi.org/10.3397/1/376945
-
K.-C. Park, W.-J. Kim, and J.-S. Won, “High-frequency noise reduction in mechanical compartment of a household refrigerator via dynamic absorber design,” Journal of Vibration Engineering and Technologies, Vol. 9, No. 3, pp. 477–490, Sep. 2020, https://doi.org/10.1007/s42417-020-00242-1
-
H. Koruk, A. Arisoy, and N. Bilgin, “Quantification of the flow noise in household refrigerators,” Journal of Vibroengineering, Vol. 16, No. 7, pp. 3557–3564, 2014.
About this article

This research was funded by the National Natural Science Foundation of China (52405275), Natural Science Foundation of the Higher Education Institutions of Jiangsu Province, China (24KJB460017) and the Scientific Research Foundation for High-Level Talents of Nanjing Institute of Technology (YKJ202102).
The datasets generated during and/or analyzed during the current study are available from the corresponding author on reasonable request.
The authors declare that they have no conflict of interest.
