Abstract
To address the inadequacy of existing empirical formulas for estimating the vibration frequency of small airflow-induced piezoelectric generators, this study proposes a novel method for vibration frequency estimation specifically tailored to such generators. Through experimental analysis of vibration frequencies, the current expression for vibration frequency is modified to enhance the accuracy of frequency estimation for short resonators. The results indicate that the length of the resonator is the primary influencing factor. As the length increases, the frequency decreases, demonstrating an inverse relationship. The distance between the nozzle and the resonator is regarded as a secondary factor. Although there is a slight decrease in frequency as the spacing increases, its impact remains limited. Furthermore, the discrepancy between the theoretical values derived from the modified empirical frequency formula and the experimental data does not exceed 4 %, and the coefficient of determination () for the modified empirical formulation is 0.9987, highlighting its reliability as an effective method for estimating vibration frequency. These conclusions may offer guidance in designing the vibration frequency and identifying essential structural parameters.
Highlights
- The length of the resonator is identified as the primary factor influencing the frequency, showing an inverse relationship where the frequency decreases as the length increases. In contrast, the spacing has a minor effect on the frequency, which slightly decreases as the spacing increases.
- The corrected formula has a smaller error between the theoretical value and the experimental value, with the error and the coefficient of determination being less than 4% and 0.9987 respectively, and the precision is at least 5 times higher.
- To achieve stable high-frequency excitation forces exceeding 6 kHz, it is recommended to select a resonator length within 8 to 10 mm and maintain a distance from the nozzle to the resonator of no more than 3 mm.
1. Introduction
Vibration piezoelectric generators can efficiently convert environmental vibration energy into electrical energy. Due to their simple structure, easy of miniaturization, and ability to serve as self-powered sources, they are widely applied in fields such as transportation [1], communication [2], and building [3, 4]. For vibration piezoelectric generators: 1) According to the “frequency pumping” design concept [5], higher excitation frequencies are advantageous for enhancing output power; 2) To maximize electrical energy output, it is essential that the excitation force frequency be closely aligned with the natural frequency of the piezoelectric power generation device.
In recent years, various methods of energy harvesting based on airflow-induced vibration phenomena have been studied. Airflow-induced vibration can be classified into vortex-induced vibration [6, 7], Galloping [8, 9], flutter [10, 11], and resonance [12, 13], depending on the underlying mechanisms of aerodynamic phenomena. A small airflow-induced vibration piezoelectric generator designed for fuzes represents a specific type of vibration piezoelectric generator that employs an airflow-induced sound excitation mechanism based on a nozzle-resonator structure [14, 15]. It converts the incoming airflow during a projectile's flight into a stable sound source, which in turn drives a piezoelectric power generation device to vibrate and produce electrical energy output. Consequently, investigating the vibration frequency of airflow-induced vibration piezoelectric generators is of paramount importance.
Relevant studies [16-20] have indicated that the vibration frequency of these generators is aligned with both the excitation force frequency and determined by the acoustic mode frequency of the resonator, commonly known as its resonant frequency. Due to the complex vibration model of the fluid-solid-acoustic coupling system, there is currently no precise mathematical expression that could accurately describe its coupling effects. Therefore, calculations of resonant frequencies have historically relied on various empirical formulas. Cain et al. [21] found through research on Hartman resonators that the total pressure at the nozzle outlet and the spacing between the outlet and the resonator do not significantly influence resonant frequencies. Instead, they identified that the resonator length is the primary influencing factor and proposed a corresponding formula for calculating these frequencies. Kastner et al. [22] discovered that the resonant frequency is not only dependent on the resonator length but also influenced by factors such as the jet Mach number and the spacing related to both near-field and far-field sound pressure power spectra. They then revised the frequency calculation formula accordingly. A. Hamed et al. [23] proposed a corrected formula that takes into account the structural geometric dimensions affecting the unstable flow field characteristics and mass flow rate. In addition, researchers have investigated how parameters such as resonator length, nozzle distance, flow pressure, and nozzle diameter impact the resonant frequency [24]. Their experimental studies focused on identifying the key determinants of the resonant frequency of the Hartman resonance tube and correcting theoretical formulas [25].
However, it is important to note that all frequency correction formulas referenced in previous literature are tailored for long resonators. When applied to short resonators (where the ratio of length to diameter is less than 1.5), these estimations are inaccurate. The estimated frequency significantly exceeds the experimental frequency, reaching nearly 20 %. Thus, the development of a more refined formula, specifically tailored for estimating the resonant frequency of short resonators, becomes necessary.
This paper aims to enhance the estimation accuracy of vibration frequency through an experimental analysis, precisely matching the natural frequency of the piezoelectric transducer to maximize electrical energy output. It can provide a reference for engineering design.
2. Working principle of airflow-induced vibration piezoelectric generator
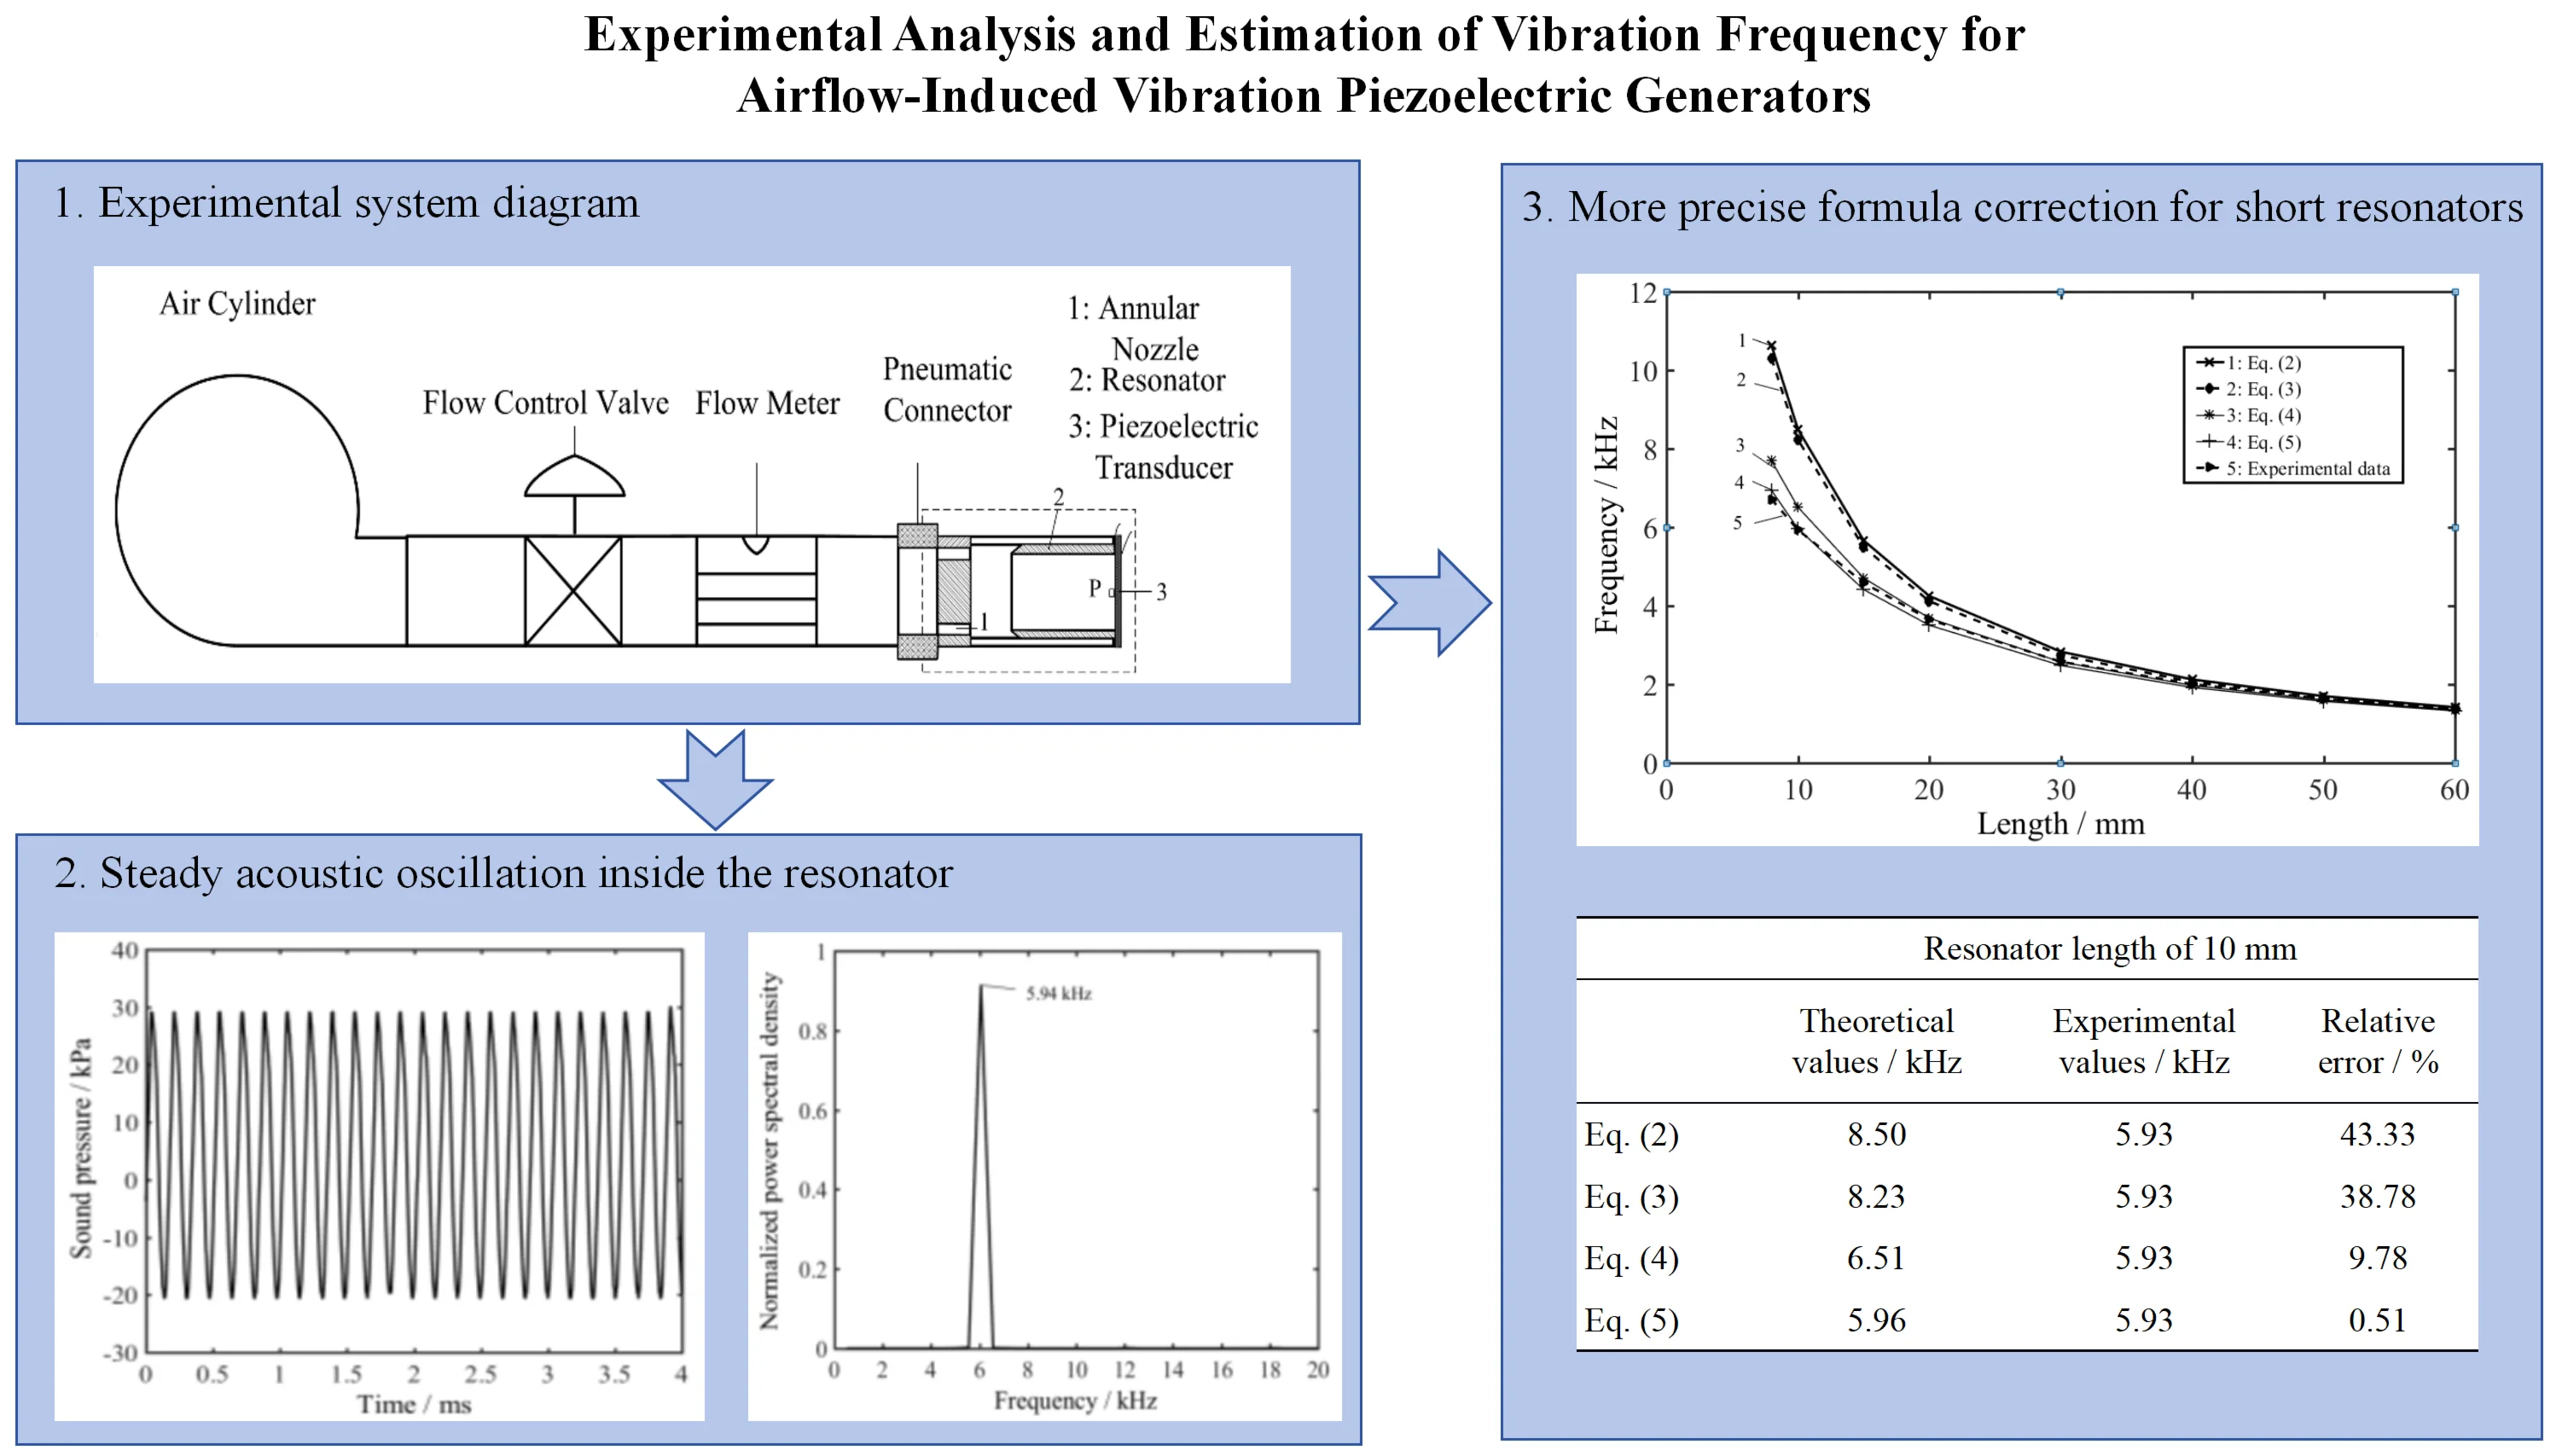
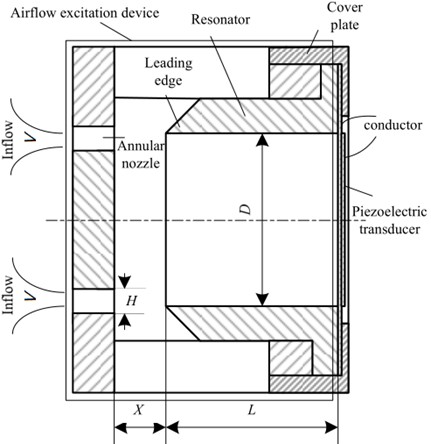
Fig. 1 presents a schematic of an airflow-induced vibration piezoelectric generator, which comprises an airflow-induced sound excitation mechanism and a piezoelectric transducer. The sound excitation mechanism is mainly composed of an annular nozzle and a resonator. Specifically, the annular nozzle comprises an air inlet and a blocking component, and the piezoelectric transducer is positioned at the end of the resonator, thus forming an open-closed configuration.
Fig. 1Scheme of airflow-induced vibration piezoelectric generator
The jet created as the incoming airflow moves through the nozzle impacts its tip, leading to vortex shedding and the generation of edge sound [14, 15]. The resulting sound wave propagates within the resonator and reflects off its bottom surface, driving the oscillations of the air inside into a harmonic state that establishes standing-wave resonance. Ultimately, this process generates a stable sound source with its frequency locked to the acoustic modal frequency of the resonator.
Under the influence of standing-wave resonance, the air inside the resonator will undergo periodic expansion and compression. The sound pressure at the bottom of the resonator drives the vibration of the piezoelectric transducer, thereby generating electrical energy and achieving the conversion of sound energy to electrical energy.
3. Vibration frequency measurement system and experimental setup
In simulating the flight environment of a projectile, factors such as temperature, humidity, and inflow are disregarded. Instead, it focuses solely on replicating the pressure or velocity conditions of the flow inside the tube.
The experimental system, shown in Fig. 2, mainly consists of an air source simulation system, a pressure measurement system, and experimental specimens. The air source simulation system, designed to measure flow rate values, primarily consists of an air tank coupled with a pressure relief valve and a flow meter. The pressure measurement system, used to measure sound pressure at the bottom of the resonator, comprises a pressure sensor and a data recorder. The vibration frequency can be obtained by spectrum analysis.
Fig. 2The proposed methodology diagram
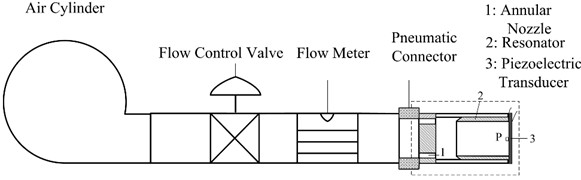
a) Experimental system diagram
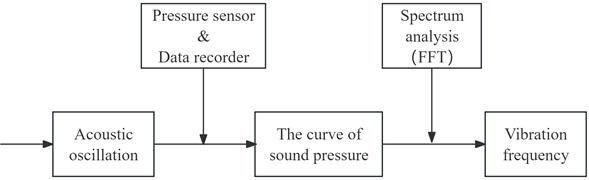
b) FFT analysis diagram
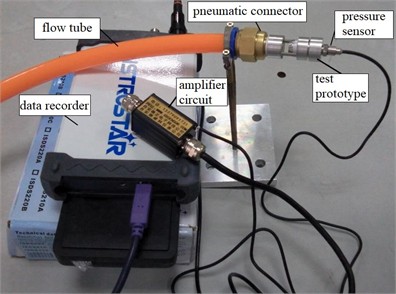
Fig. 3 shows the experimental picture. During the experiment, the airflow at the inlet is regulated using a pressure relief valve, and the flow rate values are monitored by an SMC PF2A751 flow meter with a measurement accuracy of 5 L/Min.
To measure the sound pressure in the experimental system, a model CYY28 pressure sensor is used, which has a dynamic frequency response of 500 kHz and a nonlinear error under ±0.1 % FS. The corresponding data is recorded using an ISDS205A data recorder with a bandwidth from 10 Hz to 20 MHz.
Subsequently, frequency spectrum analysis of the sound pressure curve allows for the determination of the vibration frequency.
The selected range for air source flow rates in this experiment spans from 100 to 300 L/min. The relationship between airflow velocity () and flow rate () can be expressed as follows:
where is the airflow velocity, is the flow rate, and is the cross-sectional area.
Fig. 3Experimental picture. Photo by Huajie Zou in July 2025 in Changzhou, Jiangsu, China
4. Analysis of vibration frequency influencing factors
When analyzing the factors influencing the vibration frequency of a small airflow-induced vibration piezoelectric generator, this paper primarily focuses on two structural parameters in the axial direction. It does not take into account the sharp edge angle, wall thickness, diameter of the resonator, or size of the annular nozzle, as shown in Fig. 1.
The structural parameters considered are as follows:
1) Resonator length ().
2) Resonator diameter ().
3) Spacing (), defined as the distance from the annular nozzle to the resonator.
4) Annular gap (), which represents the size of the annular nozzle.
In this study, the resonator diameter and the annular gap are fixed at 10 mm and 1 mm, respectively, while the axial structural parameters and are treated as variable values.
4.1. Influence of resonator length on vibration frequency
When the influence of the resonator length on frequency is analyzed with a flow velocity () of approximately 100 m/s, the parameters are as follows: 3 mm, 1 mm, and 8, 10, 15, 20, 30, 40, 50, and 60 mm.
Table 1Sound pressure and frequency under different lengths
/ mm | Sound pressure/ kPa | Frequency / kHz |
8 | 38 | 6.71 |
10 | 50 | 5.93 |
15 | 45 | 4.55 |
20 | 46 | 3.65 |
30 | 46 | 2.57 |
40 | 44 | 2.01 |
50 | 40 | 1.62 |
60 | 36 | 1.37 |
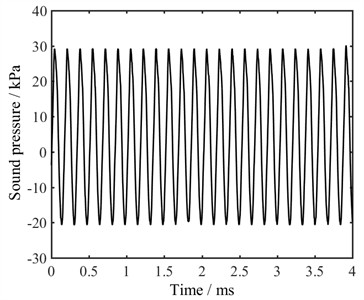
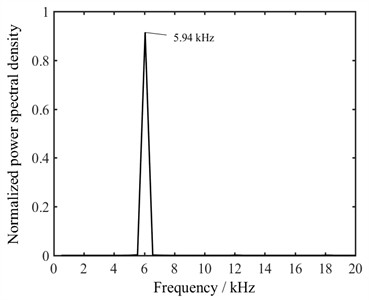
With a resonator length of 15 mm, the sound pressure at the bottom of the resonator is shown in Fig. 4. The resulting curve demonstrates a relatively regular pattern that approximates sinusoidal periodic changes. Frequency spectrum analysis reveals a prominent peak around 4.55 kHz.
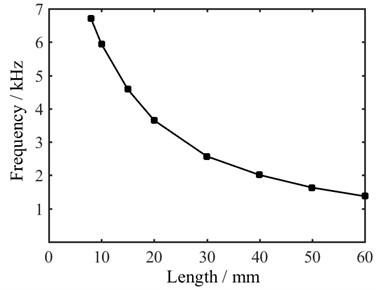
Given that the curve patterns obtained at different lengths are consistent, a representative set of curves has been selected for analysis, while other sets are summarized in Table 1. Fig. 5 shows an inverse relationship between vibration frequency and length, specifically indicating that as the length increases, the frequency decreases accordingly.
Fig. 4Sound pressure varying with time when L is 15 mm
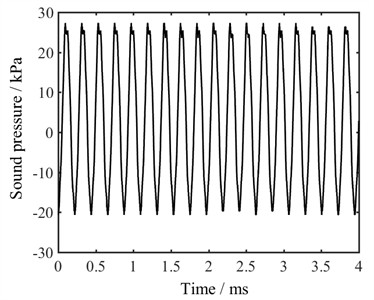
a) The curve of sound pressure
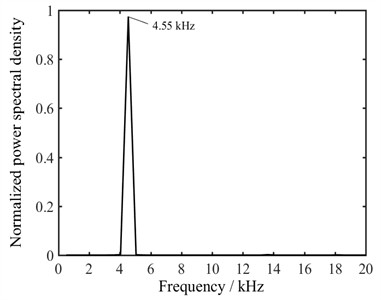
b) Frequency spectrum analysis
Fig. 5Relationship between frequency and length
4.2. Influence of spacing on vibration frequency
When analyzing the influence of the spacing on frequency with a flow velocity () of approximately 100 m/s, the parameters are as follows: 10 mm; 2, 2.5, 3, 3.5, and 4 mm.
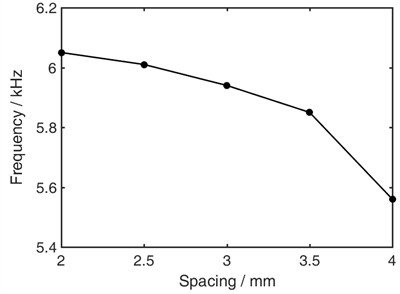
With a spacing of 3 mm, the sound pressure at the bottom of the resonator is shown in Fig. 6. The pattern of the curve changes aligns with that depicted in Fig. 4. Given that the curve patterns obtained at different spacing are consistent, a representative set of curves has been selected for analysis, while other sets are summarized in Table 2.
Fig. 7 shows the relationship between vibration frequency and spacing; it indicates that the frequency slightly decreases as the spacing increases.
According to literature [26], when a stable standing-wave resonance forms within the resonator, the volumetric flow rate inside the resonator equals the sum of the jet flow rate and the orifice flow rate. Due to the jet's influence, a small mixing zone exists at the orifice, while the majority of the resonator exhibits stable volumetric flow. Consequently, the length dimension dominates the frequency response, whereas the spacing effect is minor.
Table 2Sound pressure and frequency under different spacings
/ mm | Sound pressure / kPa | Frequency / kHz |
2.0 | 40 | 6.05 |
2.5 | 45 | 6.01 |
3.0 | 50 | 5.94 |
3.5 | 48 | 5.85 |
4.0 | 44 | 5.56 |
Fig. 6Sound pressure varying with time when X is 3 mm
a) The curve of sound pressure
b) Frequency spectrum analysis
Fig. 7Relationship between frequency and spacing
5. Frequency empirical formula
Based on the aforementioned analytical results, it is evident that the vibration frequency () decreases as the resonator length increases, demonstrating an inverse relationship. Additionally, it also exhibits a slight decrease as the spacing increases. This finding aligns closely with the observed impact trend of structural parameters on resonant frequency documented in the literature [27].
The representative theoretical formulas for the vibration frequency of the resonator are as follows:
1) Expression considering only the resonator length [21]:
where is the speed of sound.
2) Expression after correcting the resonator length [25]:
where ranges from approximately 1.59 %-3.2 %.
3) Expression after accounting for corrections at the opening end of the resonator [28]:
where denotes the corrected length at the opening end and is given by 0.61, with being the inner diameter of the resonator.
From the above three formulas, it can be observed that none of them incorporates considerations related to spacing in their empirical formulations for frequency calculation.
Building upon the research findings discussed in Section 3 regarding the relationship among frequency, length , and spacing , this paper proposes an alternative expression for vibrational frequency:
where .
In the following section, the theoretical value of the frequency corresponding to Eqs. (2-5) and the experimental value are compared and analyzed to verify the effectiveness of the frequency expression proposed in this paper.
Fig. 8 shows the relationship between frequency and resonator length. For relatively long lengths ( 40, 50, 60 mm), the theoretical frequencies derived from different formulas show minimal deviation from the experimental values. However, for shorter lengths ( 8, 10 mm), there is a significant discrepancy between the theoretical frequencies obtained from various equations and their corresponding experimental values. Notably, as the length decreases, this difference becomes more pronounced.
Fig. 8Theoretical and experimental values of frequency under different lengths
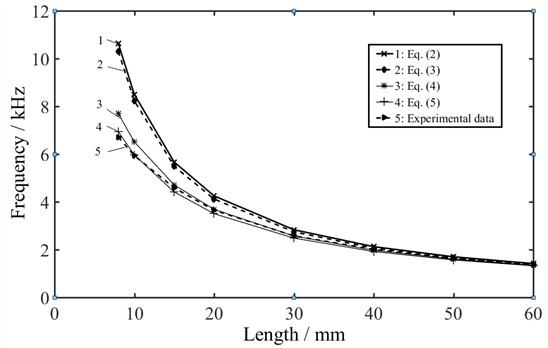
Table 3 presents a comparison of theoretical and experimental frequency values for shorter resonators ( 8, 10 mm). It can be observed that when is 10 mm, Eq. (2) displays a maximum relative error of 43.33 %, while Eq. (3) shows a relative error of 38.78 %. The relative error for Eq. (4) is registered at 9.78 %, whereas Eq. (5) demonstrates an extremely low relative error of merely 0.51 %.
Furthermore, under different lengths, the theoretical values of resonant frequency corresponding to Eq. (5) remain closely aligned with experimental results; all relative errors are within a margin of just under 4.0 %, and the coefficient of determination () for Eq. (5) is 0.9987, as shown in Table 4.
Table 3Theoretical and experimental values of frequency for short resonators
8 mm | 10 mm | |||||
Theoretical values / kHz | Experimental values / kHz | Relative error / % | Theoretical values / kHz | Experimental values / kHz | Relative error / % | |
Eq. (2) | 10.62 | 6.71 | 58.20 | 8.50 | 5.93 | 43.33 |
Eq. (3) | 10.30 | 6.71 | 53.73 | 8.23 | 5.93 | 38.78 |
Eq. (4) | 7.69 | 6.71 | 17.10 | 6.51 | 5.93 | 9.78 |
Eq. (5) | 6.93 | 6.71 | 3.28 | 5.96 | 5.93 | 0.51 |
Table 4Theoretical values related to Eq. (5) and experimental values under different lengths
/ mm | Theoretical values / kHz | Experimental values / kHz | Relative error / % | Coefficient of determination / |
8 | 6.93 | 6.71 | 3.28 | 0.9987 |
10 | 5.96 | 5.93 | 0.51 | |
15 | 4.41 | 4.58 | –3.71 | |
20 | 3.51 | 3.65 | –3.83 | |
30 | 2.48 | 2.57 | –3.50 | |
40 | 1.92 | 2.00 | –4.0 | |
50 | 1.57 | 1.62 | –3.09 | |
60 | 1.32 | 1.37 | –3.65 |
Table 5 shows the relative errors between theoretical and experimental values across varying spacings when is 15 mm. It can be observed that the discrepancies between the theoretical and experimental values corresponding to Eq. (2-4) are relatively large. Conversely, Eq. (5) yields the smallest gap among them.
Specifically, the maximum relative error of Eq. (2) reaches 35 %, while the minimum relative error of Eq. (4) is approximately 5.4 %. In contrast, the relative error corresponding to Eq. (5) remains well within a limit of just over 1.1%.
Table 5The relative errors between theoretical and experimental values under different spacings
3 mm | 4 mm | 5 mm | |||||||
Theoretical values / kHz | Experimental values / kHz | Relative error / % | Theoretical values / kHz | Experimental values / kHz | Relative error / % | Theoretical values / kHz | Experimental values / kHz | Relative error / % | |
Eq. (2) | 5.67 | 4.47 | 26.85 | 5.67 | 4.36 | 30.04 | 5.67 | 4.2 | 35.00 |
Eq. (3) | 5.49 | 4.47 | 22.82 | 5.49 | 4.36 | 25.92 | 5.49 | 4.2 | 30.71 |
Eq. (4) | 4.71 | 4.47 | 5.37 | 4.71 | 4.36 | 8.03 | 4.71 | 4.2 | 12.14 |
Eq. (5) | 4.42 | 4.47 | –1.12 | 4.33 | 4.36 | –0.69 | 4.24 | 4.2 | 0.95 |
6. Conclusions
This paper presents an experimental analysis and estimation method for the vibration frequency of airflow-induced vibration piezoelectric generators. The results are summarized as follows:
1) The length of the resonator is identified as the primary factor influencing the frequency, showing an inverse relationship where the frequency decreases as the length increases. In contrast, the spacing has a minor effect on the frequency, which slightly decreases as the spacing increases.
2) The corrected formula has a smaller error between the theoretical value and the experimental value, with the error and the coefficient of determination ()being less than 4 % and 0.9987, respectively, and the precision is at least 5 times higher. It can be used as an effective method to estimate the vibration frequency.
3) To achieve stable high-frequency excitation forces exceeding 6 kHz, it is recommended to select a resonator length within 8 to 10 mm and maintain a distance from the nozzle to the resonator of no more than 3 mm.
In the future, CFD methods should be applied to further elucidate the flow field and validate specific engineering design parameters.
References
-
S. A. Nugroho, S. C. Vishnoi, A. F. Taha, C. G. Claudel, and T. Banerjee, “Where should traffic sensors be placed on highways?,” arXiv:2110.00912, Jan. 2021, https://doi.org/10.48550/arxiv.2110.00912
-
R. Lin, X. Liu, G. Zhou, Z. Qian, X. Cui, and P. Tian, “InGaN micro‐LED array enabled advanced underwater wireless optical communication and underwater charging,” Advanced Optical Materials, Vol. 9, No. 12, Apr. 2021, https://doi.org/10.1002/adom.202002211
-
A. J. Humaidi, M. E. Sadiq, A. I. Abdulkareem, I. K. Ibraheem, and A. T. Azar, “Adaptive backstepping sliding mode control design for vibration suppression of earth-quaked building supported by magneto-rheological damper,” Journal of Low Frequency Noise, Vibration and Active Control, Vol. 41, No. 2, pp. 768–783, Dec. 2021, https://doi.org/10.1177/14613484211064659
-
A. Q. Al-Dujaili, A. J. Humaidi, Z. T. Allawi, and M. E. Sadiq, “Earthquake hazard mitigation for uncertain building systems based on adaptive synergetic control,” Applied System Innovation, Vol. 6, No. 2, p. 34, Feb. 2023, https://doi.org/10.3390/asi6020034
-
S. Priya, Energy Harvesting Technologies. Springer: New York, 2009.
-
C. Hou, C. Li, X. Shan, C. Yang, R. Song, and T. Xie, “A broadband piezo-electromagnetic hybrid energy harvester under combined vortex-induced and base excitations,” Mechanical Systems and Signal Processing, Vol. 171, p. 108963, May 2022, https://doi.org/10.1016/j.ymssp.2022.108963
-
R. N. Hegde, S. Iragar, S. K. Mohan, B. G. Naik, and Devegouda, “Investigation of a vortex-based bladeless small wind power generator with external agitators for enhanced VIV effect,” in Transport, Ecology, Sustainable Development: Eko Varna 2023, Vol. 3104, p. 020001, Jan. 2024, https://doi.org/10.1063/5.0195511
-
L. Dong, G. Hu, Q. Tang, C. Zhao, F. Yang, and Y. Yang, “Advanced aerodynamics‐driven energy harvesting leveraging galloping‐flutter synergy,” Advanced Functional Materials, Vol. 35, No. 4, p. 24143, Nov. 2024, https://doi.org/10.1002/adfm.202414324
-
S. Chen, C. H. Wang, and L. Zhao, “A two-degree-of-freedom aeroelastic energy harvesting system with coupled vortex-induced-vibration and wake galloping mechanisms,” Applied Physics Letters, Vol. 122, No. 6, p. 06390, Feb. 2023, https://doi.org/10.1063/5.0128616
-
C. Zhang, “The active rotary inertia driver system for flutter vibration control of bridges and various promising applications,” (in Chinese), Science China Technological Sciences, Vol. 66, No. 2, pp. 390–405, Dec. 2022, https://doi.org/10.1007/s11431-022-2228-0
-
M. Özkan, O. Erkan, and S. Basaran, “Flag fluttering‐triggered piezoelectric energy harvester at low wind speed conditions,” Energy Technology, Vol. 12, No. 4, p. 23011, Jan. 2024, https://doi.org/10.1002/ente.202301194
-
Z. Li, J. Li, and H. Chen, “Sensitive parameters of dynamic excitation on fuze airflow-induced acoustic generator,” Micromachines, Vol. 12, No. 9, p. 1033, Aug. 2021, https://doi.org/10.3390/mi12091033
-
Y. Huang et al., “Aeroacoustics-driven jet-stream wind energy harvester induced by jet-edge-resonator,” Nano Energy, Vol. 89, p. 106441, Nov. 2021, https://doi.org/10.1016/j.nanoen.2021.106441
-
H. Zou, H. Chen, and X. Zhu, “Piezoelectric energy harvesting from vibrations induced by jet-resonator system,” Mechatronics, Vol. 26, No. 2, pp. 29–35, Mar. 2015, https://doi.org/10.1016/j.mechatronics.2015.01.002
-
H. Zou, H. Chen, and X. Zhu, “Research on the characteristics of airflow-induced sound vibration sources in fuze vibration piezoelectric generators,” (in Chinese), Journal of Acta Armamentarii, Vol. 36, No. 4, pp. 610–618, 2015.
-
H. Zou, Q. Shi, H. Cai, and J. Liu, “The multi-harmonic excitation characteristic of airflow piezoelectric generator,” Journal of Vibroengineering, Vol. 23, No. 5, pp. 1219–1229, Aug. 2021, https://doi.org/10.21595/jve.2021.21863
-
Z. Li, J. Li, and H. Chen, “Experimental research on excitation condition and performance of airflow-induced acoustic piezoelectric generator,” Micromachines, Vol. 11, No. 10, p. 913, Sep. 2020, https://doi.org/10.3390/mi11100913
-
G. Wang, J. Cai, J. Sun, H. Zou, and H. Chen, “Vibration model and frequency characteristics of the piezoelectric transducer in airflow-induced acoustic generator,” Journal of Vibroengineering, Vol. 20, No. 1, pp. 591–601, Feb. 2018, https://doi.org/10.21595/jve.2017.18386
-
D.-A. Wang, C.-Y. Chiu, and H.-T. Pham, “Electromagnetic energy harvesting from vibrations induced by Kármán vortex street,” Mechatronics, Vol. 22, No. 6, pp. 746–756, Sep. 2012, https://doi.org/10.1016/j.mechatronics.2012.03.005
-
J. Kan, P. Lu, and J. Wang, “Performance analysis and test of vortex induced vibration piezoelectric wind harvester,” (in Chinese), Transactions of the Chinese Society for Agricultural Machinery, Vol. 52, No. 4, pp. 411–417, 2021.
-
A. Cain, E. Kerschen, G. Raman, and S. Khanafseh, “Simulations of powered resonance tube: effects of pressure ratio and freestream flow,” in 1st Flow Control Conference, Jun. 2002, https://doi.org/10.2514/6.2002-2821
-
J. Kastner and M. Samimy, “Development and characterization of Hartmann tube fluidic actuators for high-speed flow control,” AIAA Journal, Vol. 40, No. 10, pp. 1926–1934, Oct. 2002, https://doi.org/10.2514/2.1541
-
A. Hamed, K. Das, and D. Basu, “Numerical simulation and parametric study of hartmann-sprenger tube based powered device,” in 41st Aerospace Sciences Meeting and Exhibit, Jan. 2003, https://doi.org/10.2514/6.2003-550
-
B. Lu, “Acoustic propagation property and application of Hartmann acoustic generator,” (in Chinese), Journal of the University of Petroleum, Vol. 28, No. 6, pp. 123–125, 2004.
-
L. Zhang, Z. Tian, and X. Zeng, “Analysis of the primary quantities which affect the resonance frequency of Hartmann powered resonance tubes,” (in Chinese), Technical Acoustics, Vol. 27, No. 5, pp. 212–213, 2008.
-
N. H. Fletcher and S. Thwaites, “The physics of organ pipes,” Scientific American, Vol. 248, No. 1, pp. 94–103, Jan. 1983, https://doi.org/10.1038/scientificamerican0183-94
-
H. Zou, J. Song, Z. Wang, and H. Chen, “The effects of structural parameters on excitation force of airflow vibration piezoelectric generator,” Journal of Vibroengineering, Vol. 20, No. 6, pp. 2393–2402, Sep. 2018, https://doi.org/10.21595/jve.2018.19113
-
D. Ma, Acoustic Manual. (in Chinese), Beijing: Science Press, 2004.
About this article

The research is financially supported by the Jiangsu College “Qing Lan Project” of China and the Changzhou Applied Basic Research Plan of China (CJ20200010).
The datasets generated during and/or analyzed during the current study are available from the corresponding author on reasonable request.
Huajie Zou: conceptualization, methodology, software, formal analysis, investigation, resources, data curation, writing original draft preparation, project administration, funding acquisition. Fuhai Cai: validation, writing-review and editing, visualization, supervision.
The authors declare that they have no conflict of interest.
