Abstract
This study validates a frequency-domain method to derive incident wavefields from strong motion records for 1D site response analysis. Using site-specific adjustment coefficients , seismic waves are modified for single- and multi-layer soils. The Adjusted Wave Input Method (AWIM) significantly outperforms the traditional Wave Input Method (WIM), achieving > 95 % accuracy in velocity/displacement predictions when benchmarked against the Vibration Input Method (VIM). Application to the 2011 Tohoku Earthquake records at three KiK-net sites (low/medium/high stiffness) confirms AWIM’s robustness: surface response spectra align closely with field data. This method improves the accuracy of the wave input method, especially for soft soil.
Highlights
- Proposed a frequency-domain adjustment method (AWIM) to derive incident wavefields from strong motion records, significantly improving the accuracy of 1D site response analysis compared to the traditional wave input method (WIM).
- Achieved over 92% accuracy in velocity and displacement predictions for both single- and multi-layer soil models when benchmarked against the Vibration Input Method (VIM), demonstrating strong consistency with theoretical references.
- Successfully applied the AWIM method to real seismic records from the 2011 Tohoku Earthquake across three KiK-net sites with varying stiffness (low, medium, high), confirming its robustness and practical applicability.
- Enhanced the simulation of soft soil site responses, where AWIM notably outperformed WIM in displacement and velocity predictions, addressing a key challenge in seismic wave propagation analysis.
1. Introduction
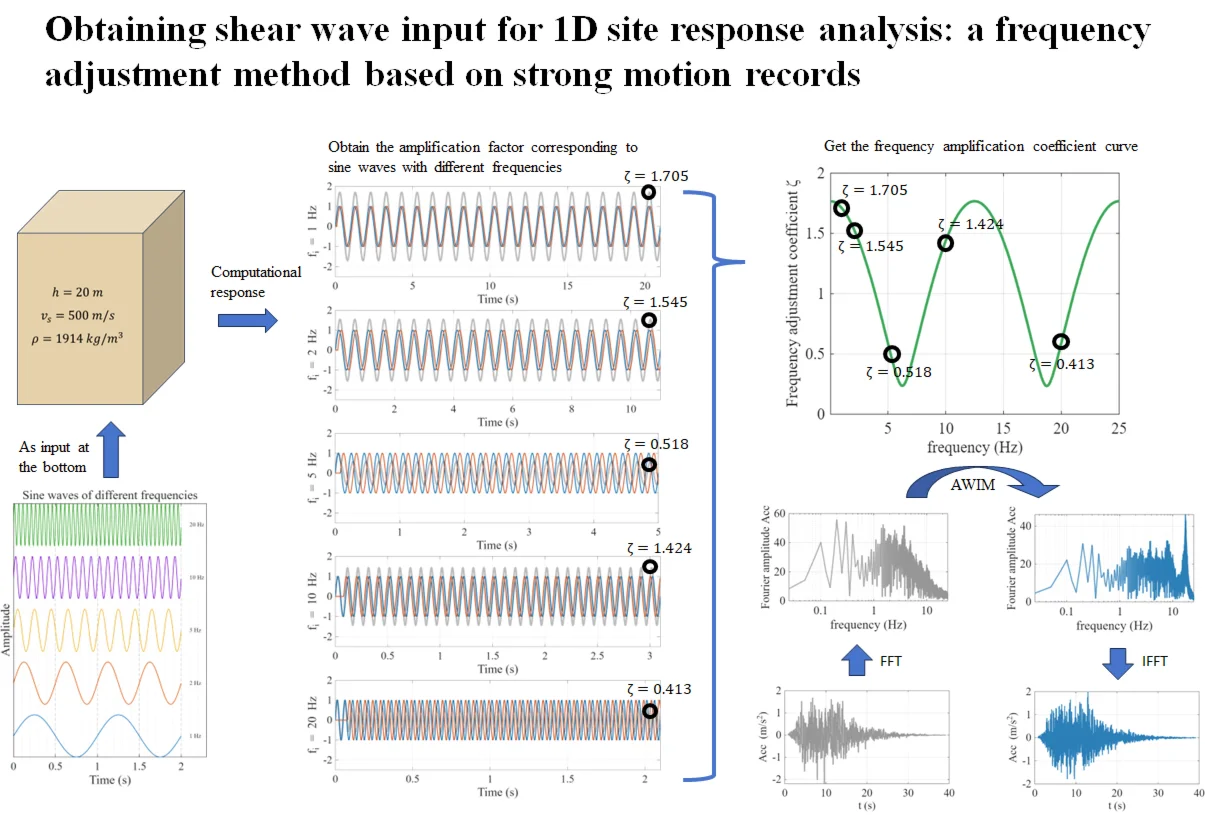
As established in a companion paper (Part I), a frequency-domain adjustment method was proposed to convert strong motion records into incident wavefields suitable for one-dimensional wave propagation analysis. This method utilizes wave theory [1] and recursive calculations of wave transmission and reflection across soil layers [2] to derive site-specific frequency adjustment coefficients . These coefficients quantify the amplification or attenuation effects of the soil on incident waves of different frequencies.
This study validated the accuracy of the adjustment method by modifying the seismic waves using the coefficient of single-layer/multi-layer soil to obtain the incident waves. Then, by calculating the soil response, the AWIM time history results were compared with the traditional wave input method (WIM) and vibration input method (VIM). Finally, AWIM was applied to calculate the surface response of seismic records from low (MYGH10), medium (MYGH04), and high stiffness (YMGH01) stations in 2011 Tohoku Earthquake records, and compared with strong earthquake records.
2. The sample site
This section compares three methods’ performance using the examples from the companion paper (Part I). The Vibration Input Method (VIM) serves as the baseline for calculating soil responses under earthquake wave input [3]. We designed a seismic wave according to the Chinese Class I site code, and the acceleration time course of this seismic wave and its corresponding response spectrum are shown in Fig. 1. The Adjusted Wave Input Method (AWIM) adjusts the earthquake wave based on frequency coefficients to analyze wave propagation.
Fig. 1Time history and response spectrum curve of the artificial wave
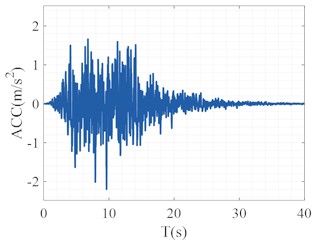
a) Acceleration time history

b) Response spectrum
Fig. 2 has shown the results of adjusting the original seismic wave using the frequency adjustment coefficient curve for the single-layer and multi-layer soil models. The gray line represents the Fourier spectrum and time history curve of the original seismic wave, while the green line represents the frequency spectrum and time history curve of the adjusted seismic wave, which serves as the incident wave field. Fig. 3 presents the wave propagation analysis results for the single-layer and multi-layer soil models, under the conditions of both adjusted and unadjusted incident wave inputs.
Fig. 2Wave field adjustment
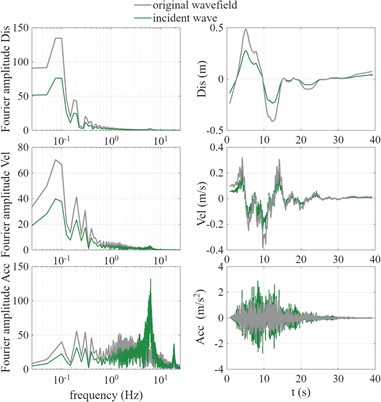
a) Single-layer soil model

b) Multi-layer soil model
Table 1 summarizes the peak values of acceleration, velocity, and displacement for single-layer and multi-layer soil, as calculated by the WIM, AWIM, and VIM methods [4]. Additionally, the calculation accuracy of WIM and AWIM methods compared to the VIM method is also presented. Compared with the results from the WIM, the AWIM calculation results show significant improvements in accuracy, especially in velocity and displacement calculations, demonstrating that this method has significant practical value in engineering applications.
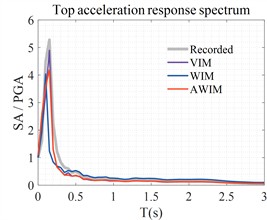
Fig. 4 and 5 respectively display the comparison of the top acceleration response spectra between AWIM and WIM for the single-layer and multi-layer soil models. Compared with the results of VIM, the calculation velocity and displacement of WIM are larger, while the results of AWIM are close to those of VIM. The results indicate that, whether for the single-layer or multi-layer soil, the AWIM calculation results are closer to the reference values obtained from the dynamic method, thereby verifying the effectiveness and reliability of the adjustment method. Fig. 6 further presents the comparison results of the maximum acceleration, maximum velocity, and maximum displacement at each location in the single-layer and multi-layer soil models. For the reaction results of single-layer soil, due to the superposition of reflections from the top and incident waves from the bottom, amplification effects were generated above six meters, especially for PGA.
Fig. 3Surface response
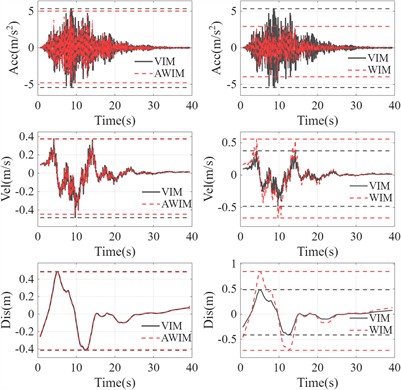
a) Single-layer soil model
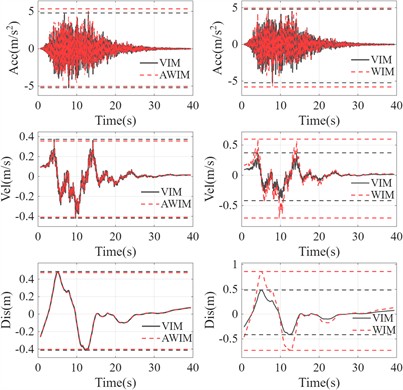
b) Multi-layer soil model
Fig. 4Surface response spectrum of single-layer soil model
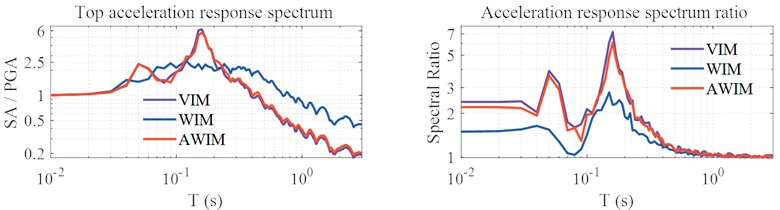
Fig. 5Surface response spectrum of Multi-layer soil model
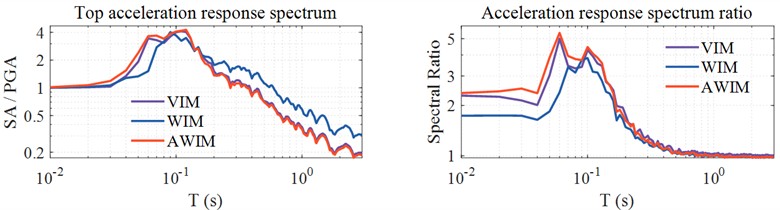
Table 1Seismic response analysis method comparison
Soil type | Parameter | VIM (Reference) | WIM Results | WIM Accuracy | AWIM Results | AWIM Accuracy |
Single-Layer | Acceleration (m/s2) | 5.43 | 2.92 | 53.78 % | 5.01 | 92.27 % |
Velocity (m/s) | 0.48 | 0.56 | 83.33 % | 0.46 | 95.83 % | |
Displacement (m) | 0.49 | 0.85 | 26.53 % | 0.48 | 97.96 % | |
Multi-Layer | Acceleration (m/s2) | 5.21 | 5.79 | 88.87 % | 5.34 | 97.50 % |
Velocity (m/s) | 0.42 | 0.71 | 30.95 % | 0.41 | 97.62 % | |
Displacement (m) | 0.48 | 0.86 | 20.83 % | 0.47 | 97.92 % |
Fig. 6Response amplitude
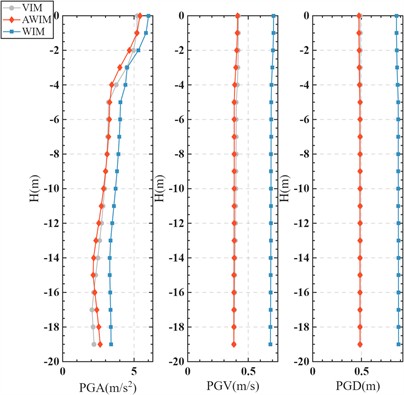
a) Single-layer soil model
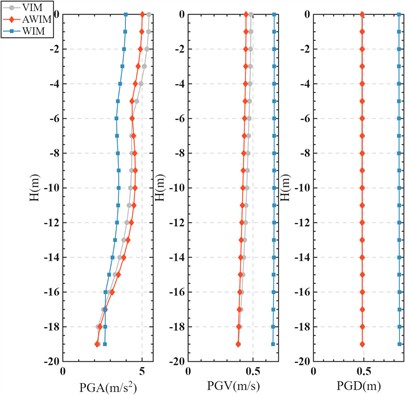
b) Multi-layer soil model
3. KiK-net station site
To verify the applicability of the adjusted wave input method (AWIM) to actual seismic waves and deep soil sites, analyses were conducted for three sites of KiK-net in Japan, i.e., YMGH01, MYGH04, and MYGH10. All three sites feature a layered soil structure consisting of soft soil layers with low shear wave velocities and hard soil layers with high shear wave velocities. According to the site classification based on VS30 following the ASCE7 standard [5], the YMGH01 site is classified as a Category B site; the MYGH04 site is classified as a Category BC site; and the MYGH10 site is classified as a Category CD site. These three sites represent low, medium, and high hardness sites, respectively.
Fig. 7Frequency adjustment coefficients for YMGH01
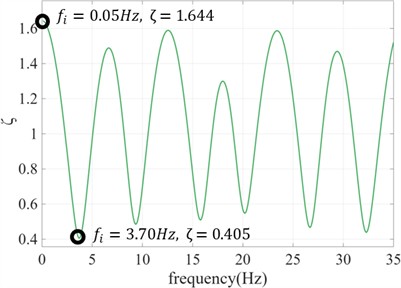
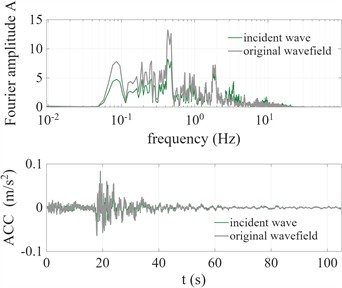
Fig. 8Frequency adjustment coefficients for MYGH04
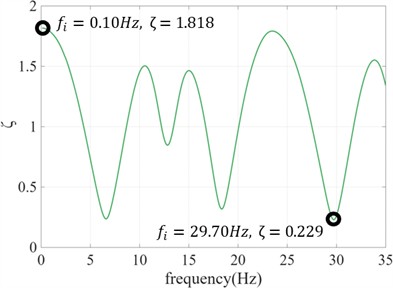
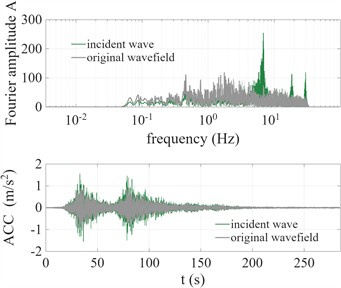
Fig. 9Frequency adjustment coefficients for MYGH10
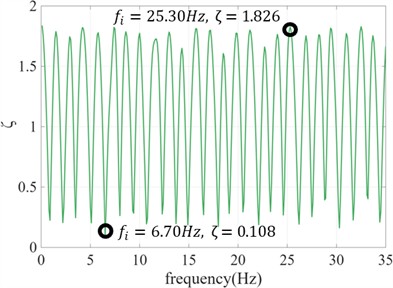
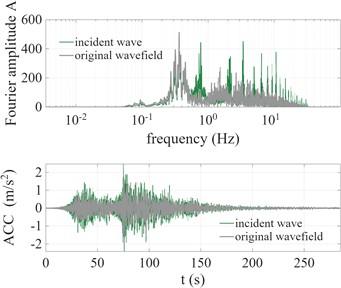
Table 2Layer profile parameters of the stiffness-increment YMGH01, MYGH04 and MYGH10 sites
Site | Thickness (m) | Soil type | (m/s) | (m/s) | (kg/m3) | Damping ratio |
YMGH01 (B) | 13.7 | Granite | 1800 | 1000 | 2200 | 0.091 |
58 | Granite | 4800 | 2100 | 2309 | 0.057 | |
131 | Granite | 5500 | 3100 | 2360 | 0.042 | |
Site | Thickness (m) | Soil type | (m/s) | (m/s) | (kg/m3) | Damping ratio |
MYGH04 (BC) | 4 | Sand | 450 | 220 | 1784 | 0.150 |
6 | Clay-slate | 4750 | 960 | 2217 | 0.104 | |
26 | Clay-slate | 4750 | 1840 | 2310 | 0.070 | |
67 | Clay-slate | 4750 | 2830 | 2365 | 0.051 | |
Site | Thickness (m) | Soil type | (m/s) | (m/s) | (kg/m3) | Damping ratio |
MYGH10 (CD) | 1 | Clay-slate | 500 | 110 | 1835 | 0.236 |
2 | Clay-slate | 1750 | 250 | 1886 | 0.160 | |
5 | Sand | 1750 | 390 | 1763 | 0.076 | |
10 | Gravel soil | 1750 | 390 | 1763 | 0.075 | |
16 | Sand | 1750 | 390 | 1763 | 0.072 | |
8 | Light tuff | 1830 | 590 | 1837 | 0.054 | |
72 | Sand tuff | 1830 | 590 | 1837 | 0.053 | |
28 | Sand | 1920 | 770 | 1906 | 0.045 | |
36 | Sand tuff | 1920 | 770 | 1906 | 0.042 | |
30 | Silt | 1920 | 770 | 1906 | 0.040 |
Table 2 shows data such as the soil layer classification, shear wave velocity profile, and density of soil layers. The selected seismic waves are ymgh011604160125EW1, mygh041103111446NS1 and mygh101103111446NS1 of the Tohoku Earthquake 2011. The baseline adjustment method of Akkar is adopted [6]. Using the adjustment method, the frequency adjustment coefficient curves and acceleration signal adjustments for the three sites were calculated and are shown in Fig. 7, Fig. 8 and Fig. 9.
By comparing the frequency adjustment coefficient curves of the three sites, it can be observed that the values of the frequency adjustment coefficient curve range approximately from 0.2 to 1.8. Due to the longer periods and lower natural frequencies of soft sites, the same frequency range contains more integer multiples of the soil’s natural frequencies. Therefore, within the same frequency range, the frequency adjustment coefficient curve of the soft site exhibits more oscillatory peaks and valleys.
Fig. 10 presents the corresponding response spectrum of the surface acceleration with a damping ratio of 0.05. The VIM method and the AWIM method are closer to the actual records, which proves the feasibility of using the VIM results as reference results in the previous section and the accuracy of the AWIM algorithm.
Fig. 10Response spectra of surface acceleration responses at three sites
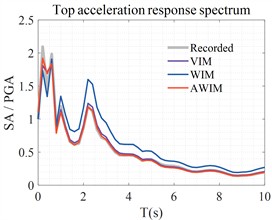
a) YMGH01
b) MYGH04
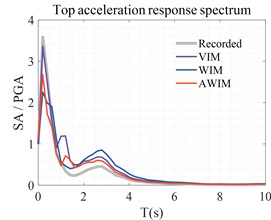
c) MYGH10
4. Conclusions
The frequency-domain adjustment method effectively converts strong motion records into incident wavefields of one-dimensional linear shear wave field response analysis. Validation using synthetic waves confirms AWIM’s superiority over WIM, reducing errors in velocity/displacement predictions by >70 % for single-layer soils and aligning closely with VIM results (97.5 % accuracy for acceleration in multi-layer soils). Application to the Tohoku Earthquake records further verifies AWIM’s practicality across diverse sites. Key findings include:
1) AWIM consistently outperforms WIM, especially in soft-soil displacement predictions.
2) The method adapts to both homogeneous sites and stratified multi-layer profiles.
3) By refining input wavefields, AWIM reliably simulates responses for low-, medium-, and high-stiffness sites.
Future work should extend validation to larger datasets and nonlinear soil behavior. This method bridges theoretical wave propagation with seismic data, enhancing reliability in seismic hazard assessment.
References
-
R. Dobry, “Radiation damping in the context of one-dimensional wave propagation: A teaching perspective,” Soil Dynamics and Earthquake Engineering, Vol. 47, pp. 51–61, Apr. 2013, https://doi.org/10.1016/j.soildyn.2012.08.014
-
Z. Shan, L. Jing, L. Zhang, Z. Xie, and D. Ling, “Transient wave propagation in a multi‐layered soil with a fluid surface layer: 1D analytical/semi‐analytical solutions,” International Journal for Numerical and Analytical Methods in Geomechanics, Vol. 45, No. 13, pp. 2001–2015, Jun. 2021, https://doi.org/10.1002/nag.3253
-
J. L. Wegner and X. Zhang, “Free-vibration analysis of a three-dimensional soil-structure system,” Earthquake Engineering and Structural Dynamics, Vol. 30, No. 1, pp. 43–57, Jan. 2000, https://doi.org/10.1002/1096-9845(200101)30:1<43::aid-eqe994>3.0.co;2-l
-
J. A. Pires, “Stochastic seismic response analysis of soft soil sites,” Nuclear Engineering and Design, Vol. 160, No. 3, pp. 363–377, Feb. 1996, https://doi.org/10.1016/0029-5493(95)01114-5
-
Minimum Design Loads and Associated Criteria for Buildings and Other Structures. Reston, VA: American Society of Civil Engineers, 2021, https://doi.org/10.1061/9780784415788
-
S. Akkar and D. M. Boore, “On baseline corrections and uncertainty in response spectra for baseline variations commonly encountered in digital accelerograph records,” Bulletin of the Seismological Society of America, Vol. 99, No. 3, pp. 1671–1690, Jun. 2009, https://doi.org/10.1785/0120080206
About this article

The authors have not disclosed any funding.
The datasets generated during and/or analyzed during the current study are available from the corresponding author on reasonable request.
The authors declare that they have no conflict of interest.
