Abstract
Currently, a mixed system of high-speed passenger and freight trains has been implemented on the railways of Uzbekistan. During the movement of high-speed passenger trains on double-track main line sections, the movement of freight trains at all stations and segments is temporarily suspended for a specific period. From this perspective, in the present time, the suspension of freight train traffic is leading to numerous technical and economic expenses. In this article, based on experimental runs using the technology of passing freight trains without stopping, train movement schedules have been drawn up, and train operations have been organized without unnecessary stops. This research paper provides a restructured overview of the introduction and practical implementation of non-stop train operation technology for double-track railway lines where both high-speed passenger and freight trains operate simultaneously. Using real operational schedules, comparative experimental charts were developed to evaluate the new approach. The outcomes of this analysis demonstrate how the proposed technology influences efficiency and key performance indicators of train movements. A regression-based analytical model was also constructed to determine the relation between freight train waiting time and average section speed, ensuring reliability through statistical verification. Furthermore, the application of innovative solutions and technologies mentioned in this article to sections of high-speed highways creates an opportunity to increase transport transit potential and improve economic indicators.
Highlights
- The findings suggest that implementing non-stop train crossing technology on the Uzbekistan-Yangi Yangier line leads to a 5.12% (2.09 km/h) increase in freight train sectional speed.
- Furthermore, average dwell times decreased by 19.32% (4.25 hours).
- When the number of high-speed trains increased from 4 to 12 pairs, the reduction in sectional speed was significantly lower with the proposed method (30.3% instead of 39.91%).
- An economic evaluation revealed that this reduction in dwell times translates into substantial financial benefits. Based on average operating costs per train-hour, the estimated annual efficiency gain amounts to 466 billion UZS for freight operations under the new system.
- The technology not only reduces freight train delays but also enhances the overall utilization of section capacity, ensuring sustainable development of railway operations in Uzbekistan. Its adoption could serve as a model for other railways facing similar mixed-traffic challenges.
1. Introduction
Ensuring safe and efficient train crossings, particularly in conditions where both high-speed passenger and freight trains share double-track sections, is one of the major operational challenges of modern railways. Previous studies [1]-[6] have highlighted these concerns and recommended optimization methods. Building upon such findings, this study develops experimental movement charts aimed at assessing the influence of a non-stop passage technology for freight and passenger trains on railway performance. To achieve this, the Uzbekistan-Yangi Yangier double-track line was selected as a case study, with charts created and compared against normative schedules (Figs. 1-2). The effectiveness of the proposed method was measured through variations in section speed and average dwell time at intermediate stations.
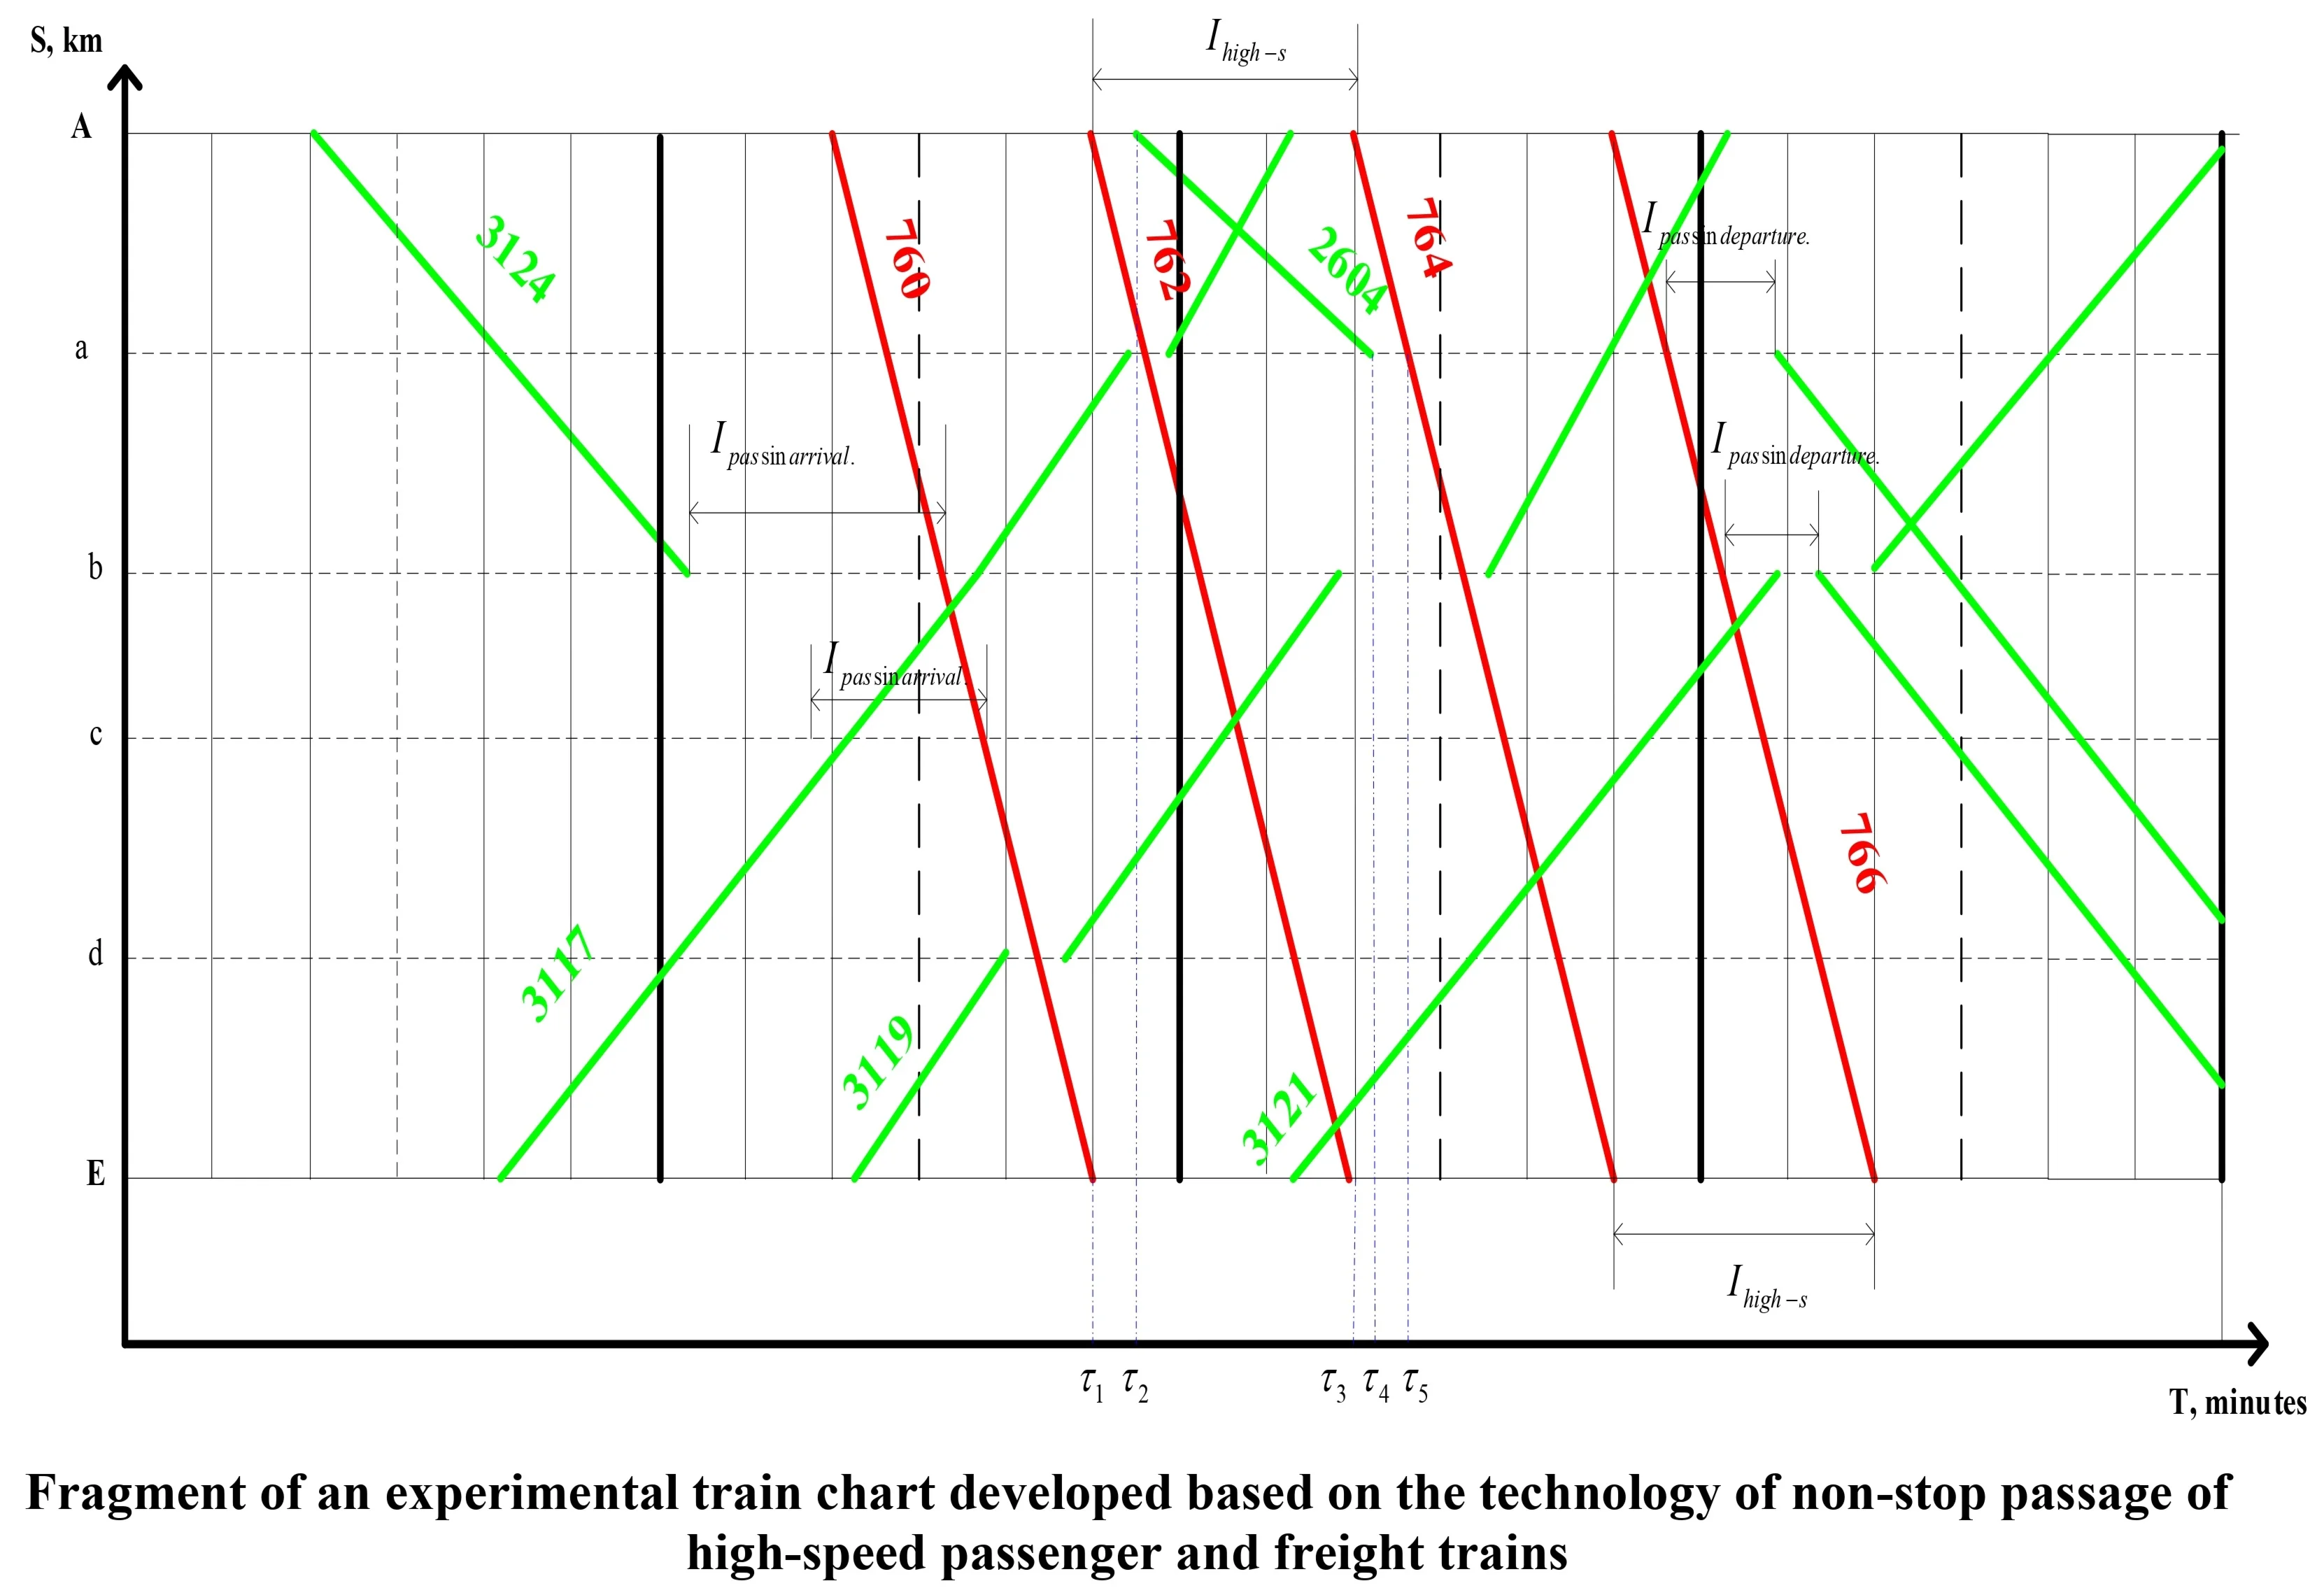
In Figs. 1 and 2 – the time interval between consecutive high-speed passenger trains, in minutes; – the time interval for freight trains arriving at stations after high-speed passenger trains, in minutes; – the time interval for sequential dispatch of freight trains from stations following passenger trains, in minutes; – departure and arrival times at stations for each category of trains, in minutes; Trains numbered 760, 762, 764 and 766 indicated in red on the schedule, represent high-speed passenger trains; Trains numbered 3117, 3119 and 3121 which are indicated in green, represent freight trains on the schedule.
Fig. 1Fragment of a typical train movement schedule for the year 2023 in the joint-stock company “Uzbekistan temir yullari” (Uzbekistan Railways)
Fig. 2Fragment of an experimental train chart developed based on the technology of non-stop passage of high-speed passenger and freight trains
2. Analysis literature and methodology
Operational efficiency on railway sections is often expressed through parameters such as sectional speed, technical speed, pedestrian speed, and route speed. Additionally, various coefficients sectional speed coefficient, technical speed coefficient, and others are calculated based on these values [3], [6]. These factors are strongly influenced by variables such as train weight, length, locomotive traction power, aerodynamic resistance, and track gradient. Mathematical expressions for determining train speed and coefficients were applied Eq. (1-4), while both standard and experimental charts were prepared for analysis. Figs. 3-4 summarize the calculated values for the standard and revised tables:
where , , , – correspondingly, the pedestrian, technical, sectional, and route travel speeds, measured in km/h; – the total mass of the train consist, in tons (t); – the overall length of the train consist, in meters (m); – the traction power of the locomotive, in kilowatts (kW); – the aerodynamic resistance coefficients affecting train motion; – the gradient (profile) of the railway section, in ‰ (per mille); – additional operational and technical parameters.
The conditions, algorithms, aerodynamic effects, and solutions for the safe intersection of high-speed passenger and freight trains on double-track high-speed main lines of Uzbekistan railways were described in detail in previous scientific studies [12]-[13]. Based on this and the experimental train movement charts have been developed for the Uzbekistan-Yangi Yangiyer section. The values of the normative and experimental charts were calculated using Figs. 3-4.
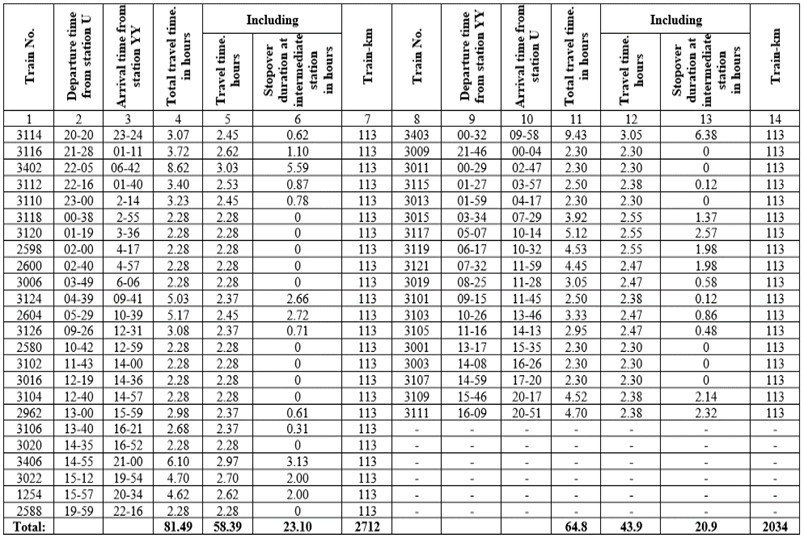
The average values of the parameters for the typical chart and the experimental train movement charts are presented in Table 1.
Fig. 3Parameters for establishing a standard train operation schedule (Nhigh-speed= 6 s.t., Vhigh-speed= 160 km/h, Vfreight= 60 km/h, Nfreight= 21 s.t.)
Through the application of regression modeling and the least squares method, a functional relationship was established between the movement speed of freight trains on a given section and the time spent at intermediate stations. This relationship is determined by the number of freight and passenger trains, the speeds of different train categories, as well as the section length within the range [7]-[11].
The data in the above figures and table are based on experimental train movement graphs drawn using the technology of continuous passing of freight and high-speed passenger trains on the existing two-track high-speed main lines of Uzbekistan Railways. The trains shown in green on this diagram represent freight trains that crossed safely with high-speed passenger trains without stopping, but continued their movement. On this basis, it was possible to reduce the time of inefficient stopping of freight trains at stations.
Fig. 4Parameters for developing an experimental train operation schedule (Nhigh-speed=6 s.t.,Vhigh-speed=160 km/h,Vfreight=60 km/h,Nfreight=21 s.t.)
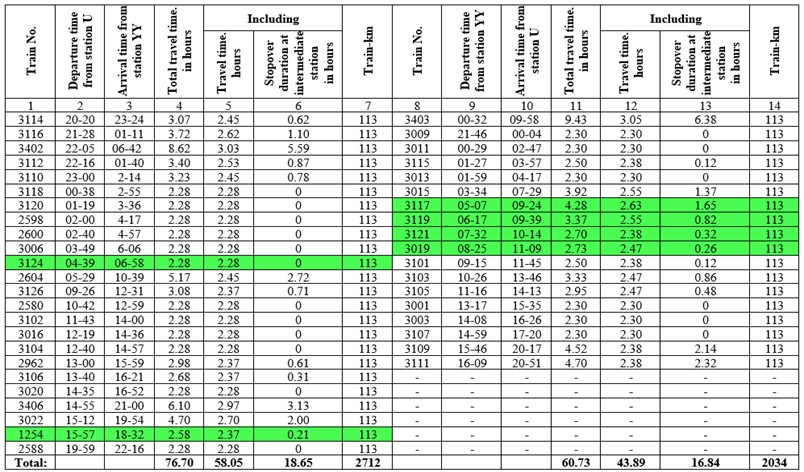
Table 1Average values of parameters for the typical train movement schedule and experimental train movement schedules
No | The number of high-speed passenger trains, paired train | The number of freight trains, unpaired train | The length of the section, km | According to the existing technology | According to the proposed technology | ||
Section speed, km/h | The average dwell time at intermediate stations, hours | Section speed, km/h | The average dwell time at intermediate stations, hours | ||||
1. | 4 | 22 | 113 | 36.40 | 15.56 | 37.20 | 14.10 |
2. | 6 | 21 | 113 | 32.44 | 22.00 | 34.53 | 17.75 |
3. | 8 | 21 | 113 | 29.20 | 31.28 | 31.70 | 24.67 |
4. | 4 | 16 | 103,8 | 38.68 | 12.47 | 39.39 | 11.82 |
5. | 4 | 16 | 128,8 | 23.84 | 37.11 | 24.22 | 35.99 |
3. Main content
Based on the results of experimental studies and the regression model, a universal function can be formulated to describe a consistent pattern between section speed and the time spent by freight trains at intermediate stations [1], [3], [12]-[13]. The study employed regression modeling techniques, specifically the method of least squares, to establish a functional relationship between freight train sectional speed and waiting times at intermediate stations. The number of passenger trains, freight trains, and section length were taken as key input variables. A generalized correlation function was formulated Eqs. (2-3) and solved using statistical approaches to ensure minimal deviation from observed data. Cramer’s method was applied to derive universal empirical formulas. In addition, the accuracy of the regression model, approximation error, correlation coefficients, and determination coefficients were established in the appropriate order.
In the general case, let the correlation function of multiple factors be of the following order:
where – the sectional speed of freight trains, km/h; – the dwell time of freight trains at intermediate stations, hours; , , , , – the coefficients to be determined are obtained through the following equation; , – the number of high-speed and freight trains, respectively, paired trains; – length of the section, km; – the ratio of speeds between freight trains and high-speed passenger trains.
It is known that applying the least squares method to a regression model involves minimizing the quadratic deviations between the actual values of the function and their approximate (smoothed) analogues. Based on the results of experimental studies, train movement schemes were developed for operational sections (Uzbekistan-Yangi Yangiyer, post-block Jizzakh, Jizzakh-Samarkand), taking into account the speeds of freight and high-speed passenger trains, as well as the technical characteristics of each section. By applying the Cramer’s method to solve the above equations, the following empirical universal formulas were obtained:
4. Results and their discussion
The graphs of the generated multivariate functions can be seen in the following Figs. 5-6.
Fig. 5The graph of the empirical function for the section speed can be observed on the normative and experimental train movement charts
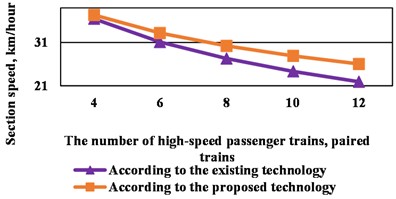
Fig. 6The dependency of the section speed on the experimental train movement charts on the ratio and number of train speeds
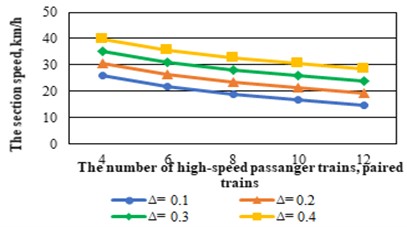
Figs. 5-6 present the dependency graphs between sectional speed, freight dwell time, and the ratio of train types. The analysis showed an approximation error of only 2.5 %, with a correlation coefficient of 0.9871 and 0.9744. These results confirm the model’s validity.
5. Conclusions
The findings suggest that implementing non-stop train crossing technology on the Uzbekistan-Yangi Yangier line leads to a 5.12 % (2.09 km/h) increase in freight train sectional speed. Furthermore, average dwell times decreased by 19.32 % (4.25 hours). When the number of high-speed trains increased from 4 to 12 pairs, the reduction in sectional speed was significantly lower with the proposed method (30.3 % instead of 39.91 %). An economic evaluation revealed that this reduction in dwell times translates into substantial financial benefits. Based on average operating costs per train-hour, the estimated annual efficiency gain amounts to 466 billion USD for freight operations under the new system. The study demonstrates that applying the technology of non-stop passage for freight trains alongside high-speed passenger services on double-track sections improves both speed performance and economic efficiency. The technology not only reduces freight train delays but also enhances the overall utilization of section capacity, ensuring sustainable development of railway operations in Uzbekistan. Its adoption could serve as a model for other railways facing similar mixed-traffic challenges.
References
-
M. Rasulov, M. Masharipov, S. E. Bekzhanova, and R. Bozorov, “Measures of effective use of the capacity of twotrack sections of JSC “Uzbekistan Railways,” in E3S Web of Conferences, Vol. 401, p. 05041, Jul. 2023, https://doi.org/10.1051/e3sconf/202340105041
-
M. Rasulov, M. Masharipov, S. Sattorov, and R. Bozorov, “Study of specific aspects of calculating the throughput of freight trains on two-track railway sections with mixed traffiс,” in E3S Web of Conferences, Vol. 458, p. 03015, Dec. 2023, https://doi.org/10.1051/e3sconf/202345803015
-
S. Bessonenko, E. Klimova, and A. Dementyev, “Use of the relative indicator for estimation of railway blocks capacity,” in MATEC Web of Conferences, Vol. 216, p. 02007, Oct. 2018, https://doi.org/10.1051/matecconf/201821602007
-
A. G. Kotenko, S. B. Sattorov, V. P. Nehoroshkov, and K. M. Timuhin, “Model for forecasting the dynamics and growth of the throughput of the Central Asian transport corridor lines,” in Journal of Physics: Conference Series, Vol. 2131, No. 3, p. 032102, Dec. 2021, https://doi.org/10.1088/1742-6596/2131/3/032102
-
J. A. Shihnazarov, D. S. Boboev, E. S. Shermatov, and R. S. Bozorov, “Comparison of technical and economic performance of wire and chain tracks used in strengthening loads in open traffic,” in The 3rd International Scientific Conference Construction Mechanics, Hydraulics and Water Resources Engineering (CONMECHYDRO 2021 AS), Vol. 2612, p. 060024, Jan. 2023, https://doi.org/10.1063/5.0130838
-
R. Borndörfer, T. Klug, T. Schlechte, A. Fügenschuh, T. Schang, and H. Schülldorf, “The freight train routing problem for congested railway networks with mixed traffic,” Transportation Science, Vol. 50, No. 2, pp. 408–423, May 2016, https://doi.org/10.1287/trsc.2015.0656
-
Y. Zhang, “Calculation methods of minimal headway for high-speed railways,” in Fifth International Conference on Transportation Engineering, pp. 203–213, Sep. 2015, https://doi.org/10.1061/9780784479384.026
-
Z. Chen, T. Liu, Z. Jiang, Z. Guo, and J. Zhang, “Comparative analysis of the effect of different nose lengths on train aerodynamic performance under crosswind,” Journal of Fluids and Structures, Vol. 78, pp. 69–85, Apr. 2018, https://doi.org/10.1016/j.jfluidstructs.2017.12.016
-
C. J. Baker, A. Quinn, M. Sima, L. Hoefener, and R. Licciardello, “Full-scale measurement and analysis of train slipstreams and wakes. Part 1: Ensemble averages,” Proceedings of the Institution of Mechanical Engineers, Part F: Journal of Rail and Rapid Transit, Vol. 228, No. 5, pp. 451–467, May 2013, https://doi.org/10.1177/0954409713485944
-
C. J. Baker, A. Quinn, M. Sima, L. Hoefener, and R. Licciardello, “Full-scale measurement and analysis of train slipstreams and wakes. Part 2 Gust analysis,” Proceedings of the Institution of Mechanical Engineers, Part F: Journal of Rail and Rapid Transit, Vol. 228, No. 5, pp. 468–480, May 2013, https://doi.org/10.1177/0954409713488098
-
B. G. Cai, J. Sun, and W. Shangguan, “Elastic adjustment strategy of dynamic interval optimization for high-speed train,” Journal of Traffic and Transportation Engineering, Vol. 19, No. 1, pp. 147–160, 2019, https://doi.org/10.19818/j.cnki.1671-1637.2019.01.015
-
M. Rasulov, M. Masharipov, R. Bozorov, and L. Kodirova, “Mathematical model for aerodynamic interaction of high-speed passenger and freight trains on adjacent tracks: part I: preliminary conclusions on problem formulation and solution approach,” in International Conference on Applied Innovation in IT, Vol. 13, No. 2, pp. 381–391, Jun. 2025, https://doi.org/10.25673/120509
-
M. Rasulov, M. Masharipov, R. Bozorov, and L. Kodirova, “Mathematical model for aerodynamic interaction of high-speed passenger and freight trains on adjacent tracks: part II: theoretical and practical basis for solving the problem in complex conditions,” in International Conference on Applied Innovation in IT, Vol. 13, No. 2, pp. 393–401, Jun. 2025, https://doi.org/10.25673/120510
About this article

The authors have not disclosed any funding.
The datasets generated during and/or analyzed during the current study are available from the corresponding author on reasonable request.
The authors declare that they have no conflict of interest.
