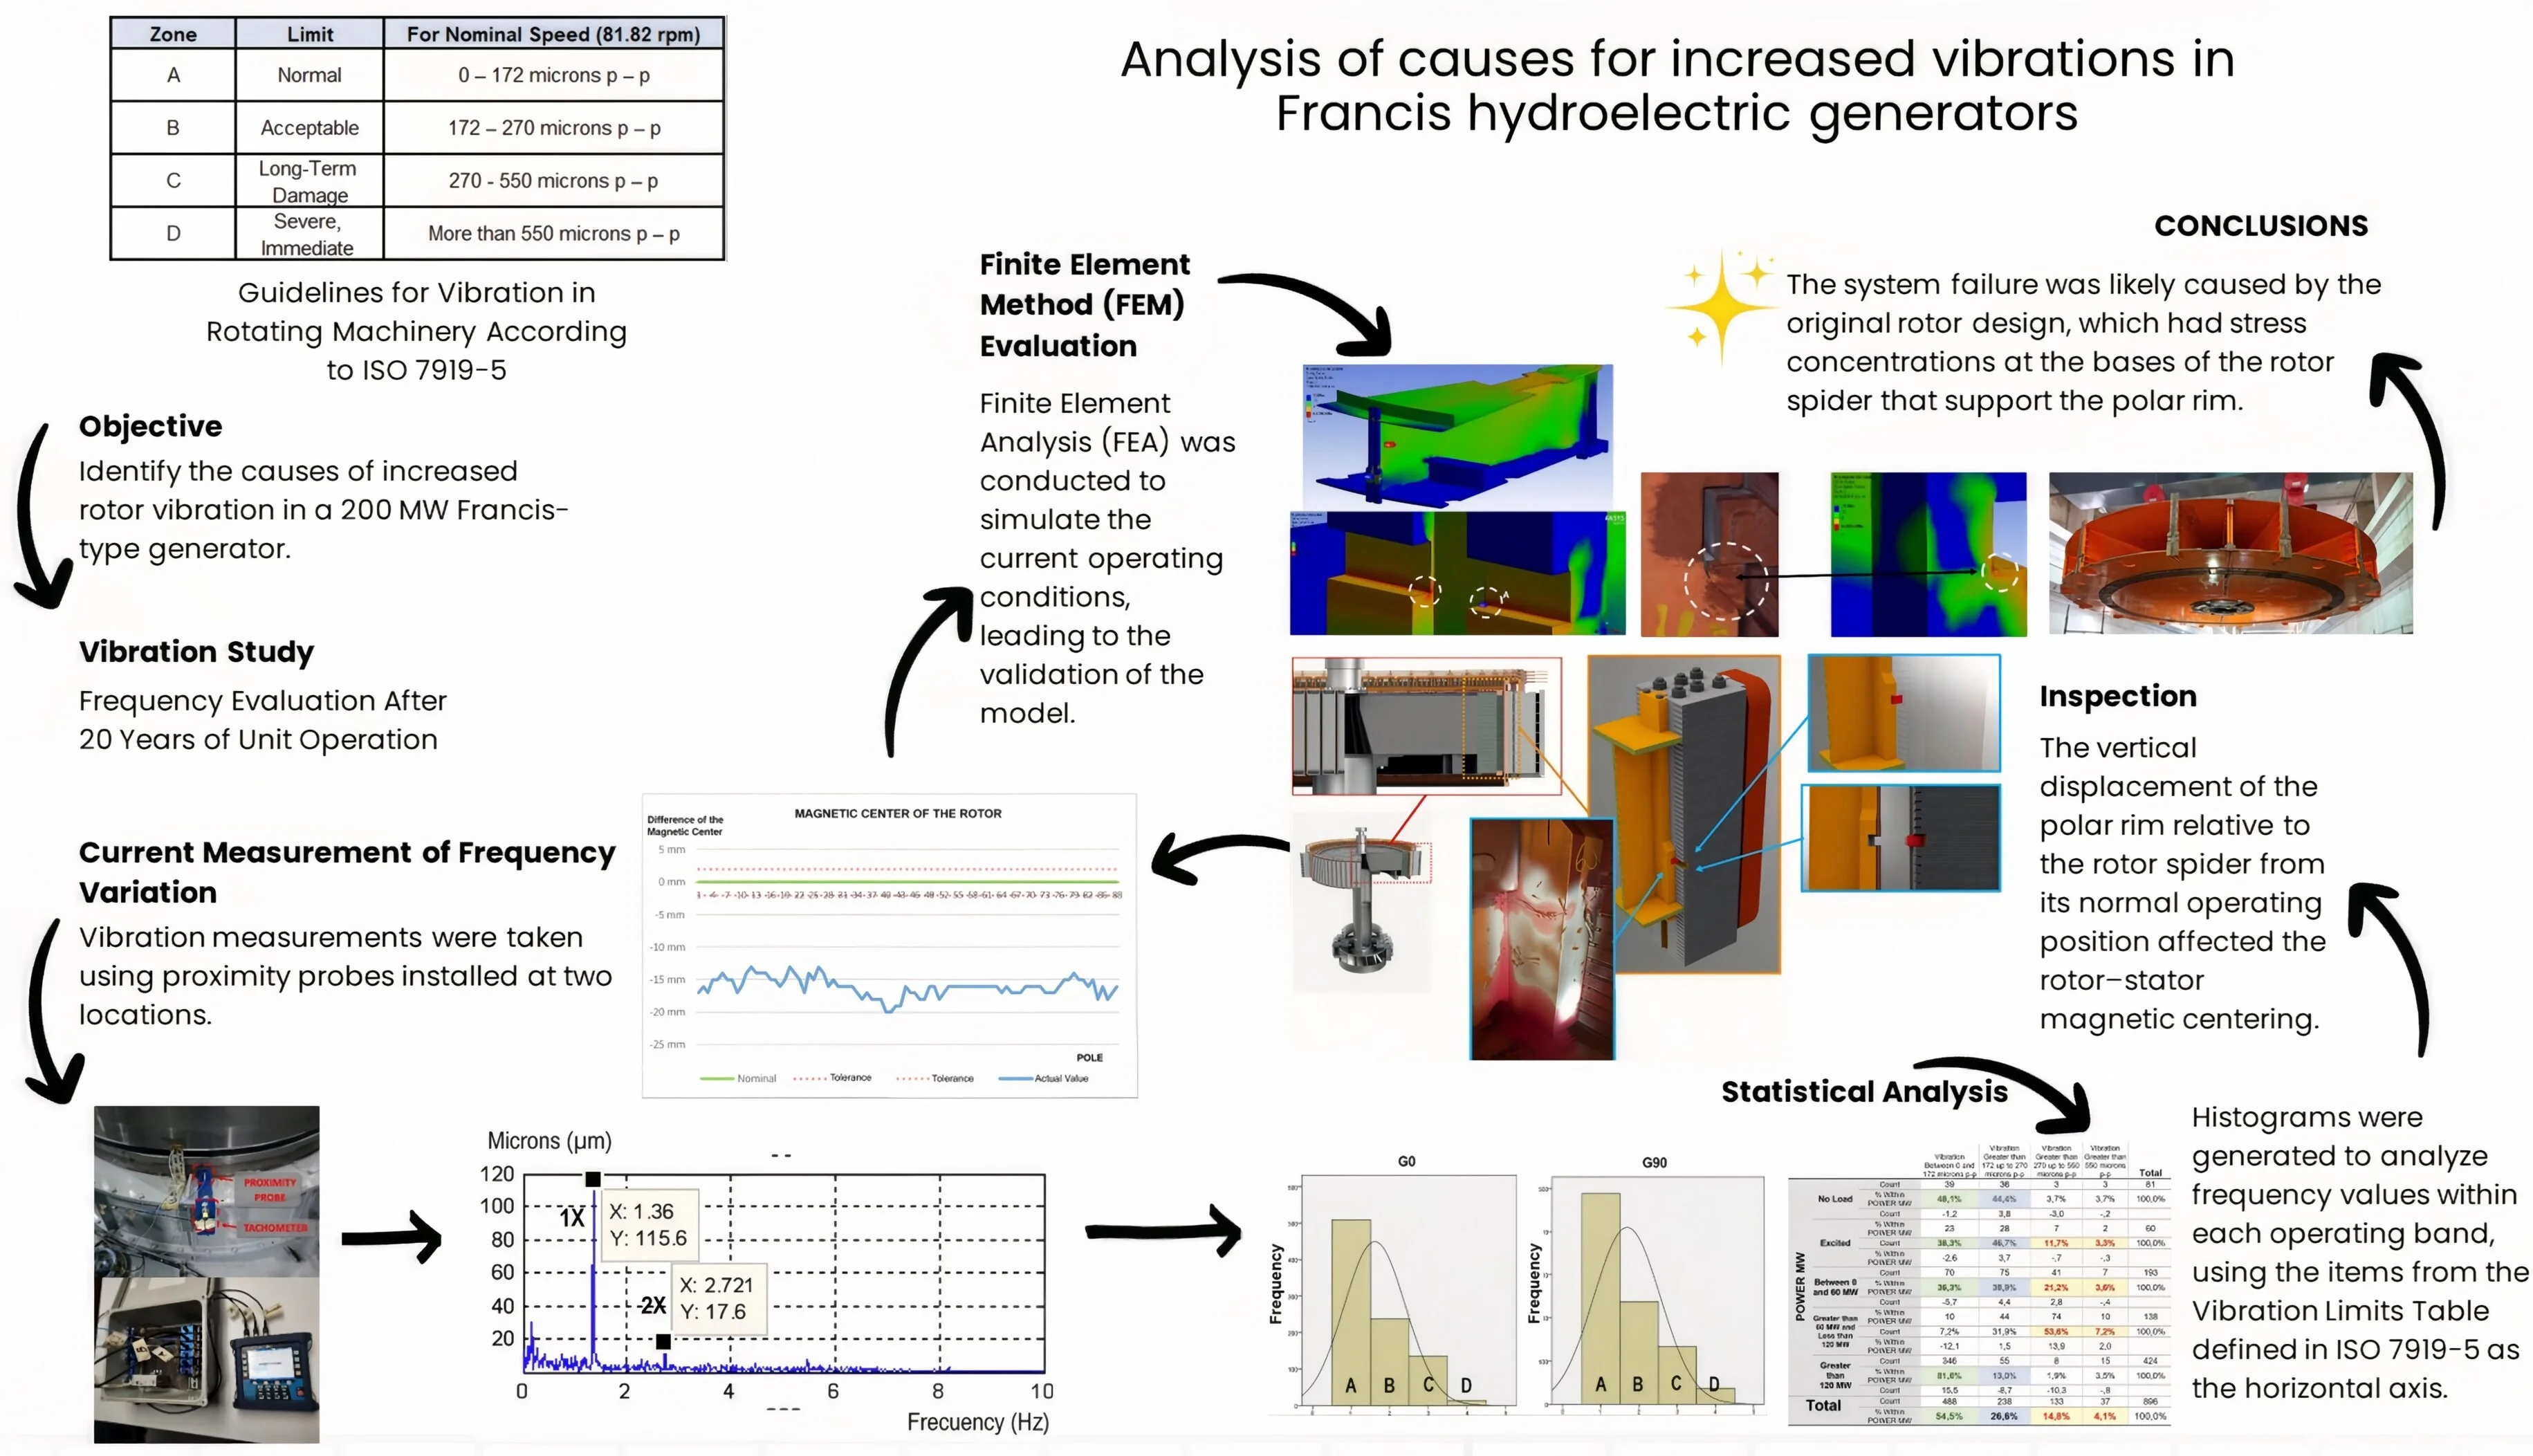
Abstract
The present study analyzes the causes of increased vibration in Francis-type hydroelectric generators, focusing on the rotor-stator assembly and the rotor support structure (rotor spider), and considering installation and operational performance. Through comprehensive analysis of vibration histories, visual and topographic inspections, roundness measurements, alignment and magnetic-center surveys, and finite element modeling (FEM) under nominal speed and runaway speed conditions (81.8 and 175 rpm), the principal causes of elevated vibration were identified. Key findings include: fatigue fracture of the bases supporting the polar rim support block; loss of rotor-stator magnetic centering (polar rim descent up to 20 mm); and loss of rotor roundness (maximum deviation 1.7 mm). FEM revealed stress concentrations in the original design that exceed the yield strength of A-36 steel and fatigue safety factors below 1 in the critical region. These conditions produce structural imbalance and intermittent vertical forces that increase vibration – particularly during start/stop transients and in pass-through bands of natural frequencies. Bearing issues, the thrust ring flatness and the original alignments/centricities are ruled out as primary causes. The study provides a solid technical basis for corrective interventions and redesign proposals aimed at reducing vibration and improving unit reliability, and constitutes a methodological and practical reference for diagnosing and solving vibration problems in similar hydraulic machines.
Highlights
- Historical vibration records, visual/topographic inspections, and FEM (nominal and runaway speeds) enabled identification of the root causes of increased vibration in a 200 MW Francis unit.
- FEM revealed significant deficiencies in the original rotor spider design, with high stress concentration at the base of the polar rim support block, causing fatigue failure and compromising unit integrity.
- Loss of roundness and misalignment of the rotor magnetic center are core predictive diagnostic parameters in Francis hydrogenerators to prevent vibration increases that may lead to structural failures.
1. Introduction
In a hydroelectric power generation system, the potential energy of water is converted into kinetic energy through the forces generated by the change in direction and velocity of the flow as it interacts with the runner blades, and this energy is then transmitted to the generator via the machine's shaft to produce electrical energy [1-3]. This mechanism is fundamental for hydroelectricity production. However, the operation of the turbine rotating components inevitably generates vibrations, as it is practically impossible to manufacture rotors with a completely perfect mass balance [4]. These vibrations represent a significant concern, as they can diminish the performance of a hydroelectric unit and increase the risk of failures [5].
Excessive vibrations can cause premature wear of the components, increasing the risk of mechanical failures and decreasing the machine lifespan, which represent a critical issue for the effective operation of the generators [6]. Furthermore, these vibrations not only affect operational efficiency but also entail significant economic consequences, such as repair costs and downtime, which in its turn causes a potential impact on the community and the industry.
With the growing global trend of reducing dependence on fossil fuels, there has been an interest in researching methods that increase the efficiency and reliability in the electric power production of systems that utilize unconventional resources, such as hydroelectric energy [6-8]. Therefore, it is necessary to implement appropriate measures in this direction.
The ISO 7919-5 standard plays a crucial role in the management of such units by providing specific guidelines for the evaluation of vibration in rotary machines [9]. This standard establishes vital limits and acceptance criteria for the effective diagnosis of hydroelectric generation systems, identifying potential issues such as misalignments, loss of roundness, or deficiencies in structural design, which may serve as early indicators of potential failures.
Most studies in this field have focused on the assembly analysis for rotating parts [5-8]. Some approaches investigated the effects of magnetic unbalance [10], while others explored axial vibration [11].
Numerous studies indicate that such vibrations are caused by shaft unbalance, uneven mass distribution of the rotor runner, and mechanical factors such as misalignment, loss of verticality, lack of concentricity of the rotating parts, and even excess or insufficient lubrication in the bearings. The adjustment of these elements and thrust ring are key factors affecting mechanical vibration [6].
This study is limited to analyzing the causes of the increase in mechanical vibrations in an operational hydroelectric generator, specifically in the rotor-stator assembly, thoroughly evaluating its mechanical and operational conditions. After identifying and understanding these factors, the aim is to provide a framework for the development of corrective strategies that improve the overall reliability and safety of the hydroelectric power generation system.
The results of this research provide significant insights into the causes of increased vibrations in hydroelectric units, comprehensively evaluating all the mechanical aspects of an operational unit.
2. Design
A Francis-type generating unit with a capacity of over 200 MW and more than 30 years of operation was selected for the study (see Fig. 1). An assessment of its vibration behavior over the years was conducted.
Fig. 1Configuration of Francis-type unit under study [12]
![Configuration of Francis-type unit under study [12]](https://static-01.extrica.com/articles/25441/25441-img1.jpg)
2.1. Unit areas prone to vibration
To determine the recommended ranges for vibration based on peak-to-peak displacement or overall vibration [9], it is required to verify first the operating speed of the unit (81.82 according to the manufacturer) [12] using Eq. (1):
Using the value obtained from Eq. (2), it becomes possible to determine the operating zones for these units on the vibration nomogram (See Fig. 2).
Fig. 2Vibration nomogram ISO 7919-5:2005 standard [9]
![Vibration nomogram ISO 7919-5:2005 standard [9]](https://static-01.extrica.com/articles/25441/25441-img2.jpg)
Table 1 displays the acceptable and rejected vibration values in accordance with ISO 7919-5 [9]. These values are obtained under the operating conditions of the unit.
Table 1Vibratory limits according to ISO 7919-5 [12]
Zone | Limit | For nominal speed (81.82 RPM) |
A | Normal | 0-172 microns p-p |
B | Acceptable | 172-270 microns p-p |
C | Long-Term Damage | 270-550 microns p-p |
D | Severe, Immediate Damage | More than 550 microns p-p |
2.2. Background
For this study, the vibration values, recorded by the manufacturer during the rotor assembly, are considered (see Table 2). Turbine rotor is considered the primary target for vibration control within the system due to its high movement inertia, arising from its greater weight relative to the other rotating parts of the turbine. It is important to point out that among the rotating elements of the generator (rotor, shaft, and runner), the rotor is the only component that is balanced on-site after assembly, as the runner is submerged in water, which prevents such adjustments. Additionally, the shaft slightly contributes to balancing, as long as it is correctly aligned.
Following the dynamic balancing performed after assembly, the rotor of the unit under study reached a vibration level of 188 µm (see Table 2), which is considered an excellent value, since this vibration level represented only 16.3 % of the acceptable operating range, according to the criteria established in Table 1. As a result, the unit operated within the optimal operational range, so the original balancing process was effective in minimizing the risks of excessive vibrations, thereby ensuring stability and extending the lifespan of the equipment.
Table 2Frequency amplitudes during assembly
Vibration without filter in mm-P-P (Phase) | ||||
Upper shaft | Generator shaft | |||
Measurement | Maximum | Minimum | Maximum | Minimum |
Initial | 0.486 | 0,420 | 0,169 | 0,100 |
Final | 0.341 | 0.248 | 0.188 | 0.135 |
Imbalance at 1.35 Hz (81.82 RPM): mm-P-P (Phase) | ||||
Initial | 0.380 (20°) | 0.371 (20°) | 0.079 (325°) | 0.058 (324°) |
Final | 0.220 (0°) | 0.177 (2°) | 0.100 (276°) | 0.086 (278°) |
Moreover, a eccentricity of 20 µm was recorded for the assembly after the final alignment, according to the manual rotation tests or “runout” (see Fig. 3) as per the manufacturer’s assembly protocols [12]. This eccentricity was a negligible value and felt within the limits established by the manufacturer [12], demonstrating that the alignment during the original assembly was conducted appropriately. By keeping all the parameters within the permitted ranges, it was ensured that the unit performance would not be adversely affected allowing it to operate efficiently and safely over time.
Fig. 3Eccentricity of unit under study [12]
![Eccentricity of unit under study [12]](https://static-01.extrica.com/articles/25441/25441-img3.jpg)
Subsequently, an evaluation of the vibration frequency was conducted 20 years after the unit was commissioned. This assessment focused on measuring vibrations at two specific points: the combined bearing, also known as the generator bearing, located just beneath the rotor (see Fig. 1) and the guide bearing. The combined bearing is responsible for bearing both axial and radial loads, in addition to the total weight of the rotating parts of the unit. On the other hand, the guide bearing, located at the bottom and referred to as the turbine bearing, is designed exclusively to bear radial loads (see Fig. 1 and Fig. 6(a)).
2.3. Initial vibration measurement
For the vibration measurement, the DSP Logger Expert vibration measurement equipment was used according to the arrangement suggested by the equipment manufacturer shown in Fig. 4 and as established in API 670 standard in its Appendix H, which describes the requirements for installation and monitoring of mechanical systems, and reporting of radial or axial vibrations in their shafts and housings [13].
Fig. 4Suggested schematic diagram for vibration monitoring [12]
![Suggested schematic diagram for vibration monitoring [12]](https://static-01.extrica.com/articles/25441/25441-img4.jpg)
In Fig. 5(a), the DSP Logger Expert vibration measurement equipment can be observed. In Fig. 5(b), the inductive proximity sensors using Eddy currents [11] (which produces a negative voltage that is directly proportional to the distance between the sensor and the shaft surface “GAP”), with a diameter of 8 mm and a sensitivity of 7.87 mV/µm (200 mV/mil), installed according to Table 1 of the API 670 standard, are shown [13].
Fig. 5Vibration measurement equipment [9]. Photographs were taken in the FAPCO QAQC laboratory by P. Hernandez on September 5, 2022
![Vibration measurement equipment [9]. Photographs were taken in the FAPCO QAQC laboratory by P. Hernandez on September 5, 2022](https://static-01.extrica.com/articles/25441/25441-img5.jpg)
a) DSP logger expert vibration measurement equipment
![Vibration measurement equipment [9]. Photographs were taken in the FAPCO QAQC laboratory by P. Hernandez on September 5, 2022](https://static-01.extrica.com/articles/25441/25441-img6.jpg)
b) Proximity probe using Eddy currents
Fig. 6The unit’s instrumentation. Photographs were taken in the unit under study by P. Hernandez on September 6, 2022
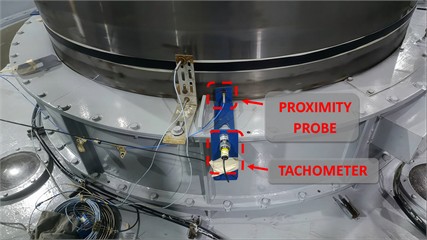
a) View of proximity probe and tachometer installed at 0° on guide bearing
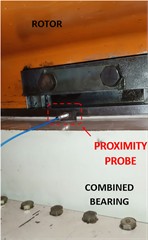
b) View of proximity probe and installed at 0° on combined bearing
The unit’s instrumentation can be observed; in Fig. 6(a), the proximity probe and tachometer are shown on the guide bearing, while Fig. 6(b) the proximity probe is shown on the combined bearing.
The characteristic frequency components of the unit under study at a rotation speed of 81.82 RPM and a local frequency of 60 Hertz are presented in Table 3.
Table 3Frequency components of interest [12]
Expected frequencies | Value (Hz) | Probable cause |
RPS = RPM/60 | 1.364 | Unbalance |
RPS×2 | 2728 | Misalignment or mechanical looseness |
RPS×3 | ×fo | Hydraulic forces caused by water impact with runner blades |
(1/) ×RPS | Approx. 0.3-0.6 | Zone of hydraulic instability, vortex, etc. |
The results obtained from the recording are presented in Fig. 7.
Fig. 7 demonstrates an increase in the reported vibration after assembly. This increase is already noticeable at no load, with a 117 % rise, which is considered acceptable. However, in the low generation zone (20-40 MW), while the increase remains within acceptable operating limits, it is approaching the long-term damage threshold. The unit has a defined operational range for rapid passage through a natural frequency known as the rough zone (between 60-140 MW); in this range, the increase is significantly greater, ranging from 183 % to 286 %, indicating at a risk of a long-term damage. In the nominal operating zone (140-180 MW), the increase in vibration varies between 100 % and 120 %, positioning itself at the upper limit of what is considered normal.
Fig. 7Overall vibration of Francis-type unit under study [12]
![Overall vibration of Francis-type unit under study [12]](https://static-01.extrica.com/articles/25441/25441-img9.jpg)
Fig. 8Vibration and frequency monitoring of the unit under study
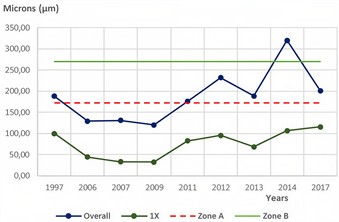
a) Historical overall and 1X vibration
b) Natural unbalance frequency [12
Although the vibration values are not alarming in themselves (according to Table 1), the causes of these increases deserve a deeper study [14].
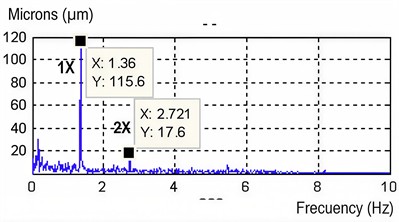
Moreover, the results of historical overall vibration and 1X measurements under speed with no load conditions are presented (see Fig. 8(a)). There, a vibration spectrum of the natural frequencies in the same condition is included (see Fig. 8(b)), highlighting the 1X value corresponding to the last measurement before the unit was taken out of service.
The values are presented for the speed conditions with zero load as this is the operational configuration where the unit balancing occurs.
2.4. Statistical analysis
To proceed with the study, a comparative statistical analysis of the historical vibration records from all units in the power house was conducted using graphical techniques, which allow to identify significant patterns and relationships [15].
Firstly, histograms were used (see Fig. 9) to display the frequency of each operational range, with the items from Table 1. Histograms are useful tools for visualizing data distribution and understanding patterns [16].
Fig. 9Historical vibration of generation units. Divided by operating range according to ISO 7919-5 standards [12]
![Historical vibration of generation units. Divided by operating range according to ISO 7919-5 standards [12]](https://static-01.extrica.com/articles/25441/25441-img12.jpg)
To further enhance the data understanding, a cross-tabulation tool was applied (see Figs. 10-11), which allows summarizing and comparing relationships among categorical variables [17]. Each cell in the table displays the frequency (count) of the combination of categories from both variables, facilitating an analysis. In our case, this methodology enabled us to identify the relationship between the operational state of a generator and the recorded vibration levels.
The results obtained are presented in a frequency chart (see Fig. 9). It can be observed that, while the highest value is associated with the operation range A (normal operation, see Table 1), there is a significant proportion of values within the range B (acceptable operation). Notably, values also appeared in ranges C and D, which represented the operational zones at risk for long-term and short-term damage, respectively.
After the statistical study, a cross-tabulation analysis was conducted for the measurement point of the generator at 0° (see Fig. 1). In Fig. 10, the appearance of values in the long-term and short-term damage zones is highlighted with red letters and yellow background. Values corresponding to normal operation are presented with green letters and green background, while values in the acceptable operating range are distinguished with blue letters and blue background, facilitating the visual identification of the different operational zones.
On the other hand, at the 90° generator measurement (see Fig. 1), Fig. 11 reflects a similar pattern. Critical values are highlighted with red letters and a yellow background, corresponding to the damage zones. Values representing normal operation are displayed with green letters and a green background, while those in the acceptable operating range are indicated with blue letters and a blue background, allowing for clear visualization of the operational conditions.
Fig. 10Cross-tabulation point G0 [12]
![Cross-tabulation point G0 [12]](https://static-01.extrica.com/articles/25441/25441-img13.jpg)
Fig. 11Cross-tabulation point G90 [12]
![Cross-tabulation point G90 [12]](https://static-01.extrica.com/articles/25441/25441-img14.jpg)
2.5. Objective
The objective of this study is to identify the most probable causes of increased vibrations, referencing the conditions of the original assembly while focusing on the generator rotor analysis. Considering that, in this type of unit, unbalances typically occur primarily in the rotating parts, a thorough analysis of this area has been conducted to investigate the potential causes of this abnormal behavior.
2.6. Cause analysis
2.6.1. Visual inspection
A preliminary inspection of the prototype unit was conducted, and the following issues were identified [12]:
– Vertical displacement of the tightening keys between the polar rim and the rotor spider (See Fig. 16).
– Breakage of the polar rim support of the rotor spider (Polar Rim Support Block) (See Fig. 17).
– A descent of 20 mm of the polar rim in relation to the rotor spider (See Fig. 18).
Fig. 12 presents the precise location of the failure, starting from the macro level (rotating parts of the unit) and progressing to a detailed view of the rotor, followed by a 3D model of the spider arm (in ochre), the polar rim (in gray), and a pole (in red). In this last section, an image is included to show one of the fractured arms. Here, the failure is magnified through a penetrant testing (PT) method, where the white area reveals the fracture in a light red tone.
Fig. 13 displays a cross-section of the arm (ochre), the polar rim (gray), and a pole (red). This section includes three images of the fractured arms, as well as a detailed view of the arm support and its contact point (Polar Rim Support Block).
These findings are significant, as the allowable tolerance for the descent of the polar rim should not exceed the specific thresholds established by the technical standards for design and operation set by the manufacturer, which in this case is ± 2 mm [12].
Fig. 12Damage area, rotating parts, with detailed view of rotor, arm, and polar rim. [12]. Photograph was taken at the unit under study by P. Hernandez on December 15, 2022
![Damage area, rotating parts, with detailed view of rotor, arm, and polar rim. [12]. Photograph was taken at the unit under study by P. Hernandez on December 15, 2022](https://static-01.extrica.com/articles/25441/25441-img15.jpg)
Fig. 13Damage area, detailed view of arm and polar rim of rotating parts [12]. Photograph was taken at the unit under study by P. Hernandez on December 15, 2022
![Damage area, detailed view of arm and polar rim of rotating parts [12]. Photograph was taken at the unit under study by P. Hernandez on December 15, 2022](https://static-01.extrica.com/articles/25441/25441-img16.jpg)
2.6.2. Mechanical rotor inspection
2.6.2.1. Magnetic center height
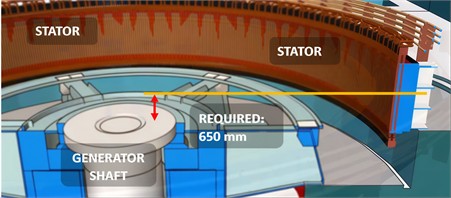
The rotor magnetic center was determined by measuring the height from the upper flange of the generator shaft (the coupling flange between the generator shaft and the rotor base) to the midpoint of the polar rotor face (see Fig. 14).
Fig. 14Schematic for measuring magnetic center of rotor [12]
![Schematic for measuring magnetic center of rotor [12]](https://static-01.extrica.com/articles/25441/25441-img17.jpg)
Prior to the measurement, 88 reference points, which correspond to the number of poles, were identified and delineated.
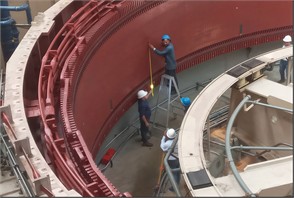
Subsequently, using a leveling survey station, topographic survey of the magnetic center of the rotor in relation to its base (lower flanged face) was conducted. The measurements were taken in the assembly bay, after the rotor was positioned and leveled on a pedestal adjusted with high-precision topographic techniques (total station, optical level, and laser) (see Fig. 15).
Fig. 15Measurement of magnetic center of rotor [12]. Photographs were taken at the unit under study by P. Hernandez on December 13, 2022.
![Measurement of magnetic center of rotor [12]. Photographs were taken at the unit under study by P. Hernandez on December 13, 2022.](https://static-01.extrica.com/articles/25441/25441-img18.jpg)
![Measurement of magnetic center of rotor [12]. Photographs were taken at the unit under study by P. Hernandez on December 13, 2022.](https://static-01.extrica.com/articles/25441/25441-img19.jpg)
The obtained measurement should be 650 mm as per the reference data provided by the manufacturer [12].
Figs. 16-17 show a loss of height of the polar rim relative to its supporting structure. Upon further investigation, the rotor magnetic center was first measured in relation to the stator, revealing a significant misalignment between the rotor and stator magnetic center (Fig. 18), evidenced by a descent of up to 20 mm (see Table 4), which exceeds the –2 mm tolerance permitted by the manufacturer [12].
Fig. 16Descent of vertical polar rim support block connecting rotor spider to the polar rim [12]. Photograph was taken at the unit under study by P. Hernandez on December 15, 2022
![Descent of vertical polar rim support block connecting rotor spider to the polar rim [12]. Photograph was taken at the unit under study by P. Hernandez on December 15, 2022](https://static-01.extrica.com/articles/25441/25441-img20.jpg)
Fig. 17Cracks and material detachment in horizontal polar rim support block [12]. The photograph shown in the figure by P. Hernandez on December 15, 2022
![Cracks and material detachment in horizontal polar rim support block [12]. The photograph shown in the figure by P. Hernandez on December 15, 2022](https://static-01.extrica.com/articles/25441/25441-img21.jpg)
This misalignment is a critical factor in the generation of vibrations within the unit, as the rotor and stator magnetic centers shall be perfectly aligned during operation. Any misalignment leads to the emergence of intense vertical forces, as these centers attempt to readjust for alignment. These forces exert significant stress on the polar rim, which is transmitted to the rotor supporting structure, known as the rotor spider.
Fig. 18Results of measurement of rotor magnetic center [12]
![Results of measurement of rotor magnetic center [12]](https://static-01.extrica.com/articles/25441/25441-img22.jpg)
However, when the unit is online, and the rotor is floating, the magnetic centers align, and the stresses generated by the misalignment tend to disappear. For this reason, the issues become more evident during the starts and stops of the machine, when the rotor spider bears the entire weight of the polar rim and the poles, increasing the structural stresses.
The above is true if the magnetic center of the assembled stator is above of that of the rotor. Conversely, if this condition is not met, an additional load is generated on the rotor spider, compromising the system integrity throughout its operation.
As a consequence of the first condition, rotor spider supports are broken (see Fig. 17). This breakage is directly related to the loss of alignment of the magnetic centers, as the additional forces generated by the misalignment increase the stresses on the supporting structure, ultimately leading to its eventual fracture.
Table 4Magnetic center values of rotor [12]
Average | 633,92 mm |
Nominal value | 650 mm |
Maximum value | 637 mm |
Minimum value | 630 mm |
2.6.2.2. Roundness
The results of the roundness measurement are presented in Fig. 19(b, c).
The rotor roundness was verified out using a special designed device. This device was leveled and centered on the central top of the rotor to ensure the measurement precision of up to ± 0.01 mm (see Fig. 19(a)). The device was designed as lightweight, in order to minimize any bending or buckling effects that could compromise the accuracy of the measurements.
The system features a rotating arm that spins on its axis and traverses the rotor perimeter. At the arm end, a high-precision measurement device consisting of a vernier scale coupled to an interior micrometer was integrated. During the measurements, the device was rotated until it was aligned with the selected pole (see Fig. 19(a)), at which point the corresponding values were recorded using the vernier scale of the micrometer.
Fig. 19Device for measuring rotor roundness and rotor roundness measurement. Photographs were taken at the unit under study by P. Hernandez on December 7, 2022
a) End with micrometer vernier and detailed view of centering and rotation of device
b) Schematic of measurement points located on the rotor
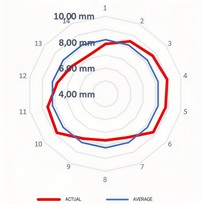
c) Roundness of the rotor
During the rotor roundness verification, it was observed that the maximum measured value is 8.93 mm, and the minimum value is 7.23 mm, resulting in a maximum deviation of 1.7 mm (see Fig. 19(b)). This value significantly exceeds the tolerance of ±0.10 mm (100 µm) permitted by the manufacturer [12], indicating a substantial deviation from the acceptable parameters.
Additionally, a generalized rotor deformation (loss of roundness) was detected, which may compromise its operational performance by inducing a magnetic unbalance. This lack of roundness causes variations in the gap between the rotor and the stator (generator air gap) during rotation, causing undesirable vibrations that affect the stability, efficiency and safety of the unit.
The magnetic unbalance caused by this deformation results from the non-uniformity of the magnetic field, leading to variations in the transferred current: it increases when the distance between the rotor and the stator decreases and decreases with the distance increase. As a result, vibrations are amplified, and this phenomenon could be reflected in the unbalance currents among the stator neutrals, which exhibit specific tolerances according to each manufacturer.
2.6.3. Stator inspection. Magnetic center height
The stator magnetic center was determined out by measuring the height from the top of the generator shaft (the coupling flange between the generator shaft and the rotor base) to the midpoint of the inner face of the stator (see Fig. 20(a)).
Prior to the measurement, 12 reference points were identified and delineated, corresponding to each stator support.
A topographic survey was conducted to determine the position of the stator magnetic center in relation to the upper flange of the generator shaft. The measurements were taken in the turbine pit of the prototype unit, using high-precision equipment to ensure the reliability of the data obtained (see Fig. 20(b)).
Fig. 20Measurement of stator magnetic center. Photograph was taken at the unit under study by P. Hernandez on December 12, 2022
a) Measurement scheme of stator magnetic center
b) Measurement of stator magnetic center
The obtained measurement should be 650 mm, in accordance with the reference provided by the manufacturer [12].
Complementary to the above measurements, the measured parameters of the stator magnetic center was compared with the theoretical data. A significant alignment shift of the stator magnetic center was detected (see Fig. 21). From the stator perspective, a misalignment of –7 mm was reported (see Fig. 21 and Table 5), which exceeds the –2 mm tolerance permitted by the manufacturer.
As previously indicated in this section regarding the alignment of the rotor magnetic center, this misalignment is a critical factor in the generation of vibrations within the unit.
Table 5Stator magnetic center values [12]
Stator bases | Actual value | Deviation |
1 | 644 mm | –6 mm |
2 | 644 mm | –6 mm |
3 | 644 mm | –6 mm |
4 | 645 mm | –5 mm |
5 | 646 mm | –4 mm |
6 | 644 mm | –6 mm |
7 | 645 mm | –5 mm |
8 | 644 mm | –6 mm |
9 | 645 mm | –5 mm |
10 | 644 mm | –6 mm |
11 | 643 mm | –7 mm |
Average | 644,25 mm | |
Nominal value | 650 mm | |
Maximum value | 646 mm | |
Minimum value | 643 mm |
2.6.4. Finite element evaluation
According to the studies conducted to evaluate the problem causes, greater impacts were identified in the rotor, prompting a focus on the fracture of the bases that support the polar rim. These fractures are identified as the primary cause of the loss of the rotor magnetic center, a critical factor that could also contribute to the lack of roundness. Both situations, such as the misalignment of the magnetic center and the irregularity in roundness, are the main reasons for the increase in vibrations in the unit under study.
Fig. 21Measurement results of stator magnetic center [12]
![Measurement results of stator magnetic center [12]](https://static-01.extrica.com/articles/25441/25441-img28.jpg)
A fracture in the support bases implies inadequate stress distribution that favors the concentration of forces, exacerbating the probability of the structural failure. This situation suggests that the original design may not account for the dynamic loads and cyclical movements to which the rotor is subjected during operation.
The proposed action plan includes a comprehensive review of the structural design of the bases, aimed at redistributing loads and improving their load capacity and fatigue resistance. Additionally, it was essential to conduct a detailed finite element analysis (FEM) [12] that simulated various loading scenarios and assessed their impact on the structural integrity.
The parameters for the finite element analysis (FEM) are described below:
1) Structural 3D modeling.
The 3D model was constructed based on the drawings provided by the manufacturer [12].
Adjustments and corrections were made using the measurements taken in the field to reflect more accurately the actual conditions of the structure.
2) Finite element analysis.
The finite element method was applied to analyze the loads and stresses to which the rotor structure is subjected, identifying potential critical points and assessing their impact on the stability and performance of the unit.
The Von Mises stress criterion is a fundamental concept in a failure analysis and material mechanics, providing a scalar measure of the combined effects of multiaxial stress states (see Fig. 21). This distortion energy theory posits that yielding occurs when the energy associated with shape deformation in a material reaches a critical threshold, equivalent to that under uniaxial tensile stress at the yield point. The practical implementation of this theory involves calculating an equivalent stress value, known as the Von Mises stress, expressed by Eq. (3):
This measure serves as a vital parameter for assessing the structural integrity of components subjected to complex loading conditions, enabling engineers to predict failures or plastic deformations within a rigorous theoretical framework.
3) Mesh generation.
The structure was meshed using tetrahedral solid elements, each with four nodes. A total of 157,310 elements were generated, while the total number of nodes reached 273,962.
4) Housing material.
The rotor spider housing is made of ASTM A-36 structural steel.
5) Applied Load.
The applied load to the structure is described in the manufacturer’s documentation (see Table 6) [12].
– Joint Factor in Welding. A joint factor in welding of 1 was assumed, which implies that the weld should be free of defects according to Table UW-12 of the ASME code [18].
– Manufacturing defects and deformations. For the simulation, the original design of the units was used, without considering potential manufacturing defects or deformations caused by the plant operation. This approach was made as a first stage of the analysis. This consideration is assumed to be valid at this stage, as the magnitude of the failure suggests a critical structural condition, which would not be significantly affected by the aforementioned deviations. In Fig. 22, the 3D modeling of the rotor polar rim support structure can be observed.
Fig. 22Three-dimensional model of rotor spider structure [12]
![Three-dimensional model of rotor spider structure [12]](https://static-01.extrica.com/articles/25441/25441-img29.jpg)
a) Top view
![Three-dimensional model of rotor spider structure [12]](https://static-01.extrica.com/articles/25441/25441-img30.jpg)
b) Bottom view
6) Fatigue study. A fatigue study was conducted by considering the maximum operating load as the critical stress criterion. This choice is based on the need to evaluate the equipment in its most unfavorable state, allowing for the identification and anticipation of structural responses under extreme loads that may be encountered during operation. By simulating these maximum loads, the analysis aims to ensure that the most demanding scenarios are addressed, thereby facilitating the detection of potential critical failures that could compromise the integrity and functionality of the unit.
Moreover, this study included designing a technical approach in which all operational unit parameters were evaluated, including the application of fatigue criteria and the review of expected loading cycles, allowing for a comprehensive assessment of performance over time. This approach, not only provides a solid foundation for the design and evaluation of the equipment, but also ensures the operational reliability, minimizing the risk of failures throughout the generator's lifecycle. In this way, a comprehensive view of the system durability is provided, contributing to the optimization of its maintenance and operation under real conditions.
– Ambient Temperature.
An ambient temperature of 45 °C was considered for the analysis.
– Analysis Conditions.
The unit analysis was conducted considering only the weight of the polar rim and the poles for two operating scenarios: nominal speed (81.82 RPM) and maximum runaway speed (175 RPM according to the manufacturer) [12]. Other analysis conditions were not considered, as the focus was posed on the most relevant critical scenarios for evaluating structural integrity, thus allowing for a more precise approach in identifying risk factors associated with the system operation under the specified conditions.
– Stresses and Safety Factors.
The stresses to which the unit is subjected were determined, and the associated safety factors for the operating load were calculated.
– Fatigue Criteria.
A fatigue criterion of 1×10⁶ cycles was considered (for steel, see Fig. 23(a)) which corresponds to an infinite life cycle according to the S-N curve for steel (see Fig. 23(b)), developed by the German railway engineer August Wöhler [19].
The S-N curve consists of three main sections [20]:
1) High Stress and Low Cycle Region (Sector A): At higher stress levels, material failures occur rapidly after a reduced number of cycles.
2) Low Stress and High Cycle Region (Sector B): At lower stress levels, materials can withstand millions of cycles before failure, reaching what is commonly referred to as the endurance limit.
3) Infinite Life Region (Sector C): At even lower stress levels, where the relationship between stress and cycles becomes horizontal, materials can withstand millions of cycles before failure, achieving what is often defined as “infinite life”.
Fig. 23Wöhler curves [20]
![Wöhler curves [20]](https://static-01.extrica.com/articles/25441/25441-img31.jpg)
a) Typical S-N curve
![Wöhler curves [20]](https://static-01.extrica.com/articles/25441/25441-img32.jpg)
b) S-N curve for different materials
– Boundary conditions (loads and supports for current condition).
Fig. 24 illustrates the current loading conditions applied for the simulation. These loading conditions are derived from the total weight of the polar rim with the poles, which amounts to 482 t or 4,820,000 N. The gravity acceleration of 9.81 m/s2, and the nominal speed of 81.82 RPM are also considered. Additionally, the displacement support conditions are shown, which correspond to the actual connections of the rotor spider, along with the frictionless support condition for symmetry.
Frictionless support is a type of constraint that restricts the degrees of freedom in the directions towards the surface. This condition is used to prevent flat or curved faces from moving or deforming in the normal direction, accurately simulating the interaction with real elements under symmetry conditions.
Fig. 24Boundary conditions of rotor spider structure: left side visualization of applied forces, right side distribution of supports used in simulation
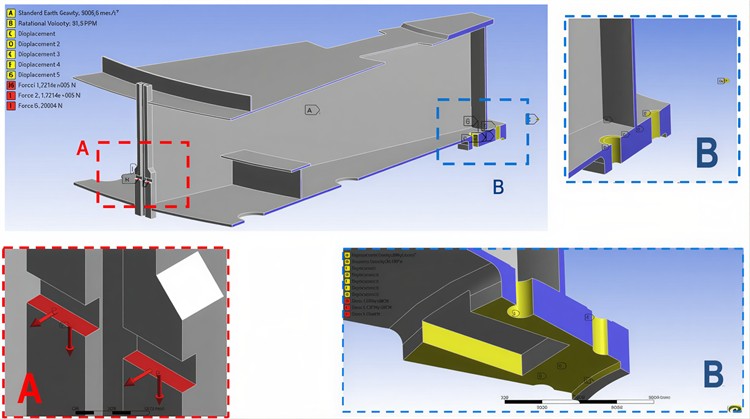
Table 6 shows the magnitudes of the main forces acting on the polar rim support block for the loading condition “p” during the simulation.
The safety factor provides an operational reliability margin between the design and service levels. For the evaluation of the rotor spider, the Safety Factor Model by A. G. Dursley [21] was considered. This model involves the following factors:
1) Material quality, labor, maintenance, and inspection.
2) Control over the applied loads.
3) Accuracy in stress analysis and experimental data.
4) Harm to individuals.
5) Economic impact.
Based on this model, the safety factor for this structure must be greater than or equal to 2.5.
Table 6Structural loads entered into simulator [12]
Type | Magnitude | Vector |
Vertical force () (weight of polar rim with poles) | 344,285.7 N Load per arm / 2 | [Axes , , ] [0 N; 172,142.85 N; 0 N] |
Friction force | 25821.42 N | [Axes , , ] [0 N; 25,821.42 N; 0 N] |
3. General information
The materials used for the rotor spider and the support device are detailed in Table 7.
Table 7Mechanical properties of used steels [12]
Materials | Standard | Tensile strength | Yield strength | Elongation at break |
Rolled steel for the general structure of the rotor spider | ASTM A36 | 450 MPa | 250 MPa | 23 % |
Articulated three-piece device | JIS G4053 Equivalent AISI 4140 | 980 MPa | 835 MPa | – |
4. Operational conditions
The conditions are classified into normal, accidental, and assembly conditions. For this study, the following was evaluated:
1) Total weight of the rotor spider: 1,176,798 N (120 t).
2) Weight of the polar rim and poles per arm (14 arms): 344,285.7 N (35 t).
3) Rotation speed: 81.82 RPM (nominal speed).
4) Temperature of the rotor spider: 45 °C.
5) Ambient temperature: 35 °C.
6) Accidental Conditions: Critical speed conditions (175 RPM).
5. Methodology
The methodology is based on a comparative analysis and historical longitudinal studies of the rotor and stator of the hydraulic generating unit, focused on the structural and operational performance.
Main Objective: To investigate the causes of increased vibrations in a specific unit. This analysis will focus on determining the factors that contribute to the vibrations, including misalignments, loading conditions, material characteristics, and manufacturing tolerances, in order to provide a clear understanding of the origins of this phenomenon.
Scope: This analysis is focused on the mechanical operating conditions of the rotor, covering critical factors such as its magnetic center in relation to the stator, as well as the roundness of the outer face of the rotor and the inner face of the stator. These variables were evaluated under normal and critical load conditions to understand their impact on the vibrational behavior of the unit.
Collection and analysis of technical information:
– The original documentation from the manufacturer was reviewed, and previous operational data was collected.
– Field measurements were taken on the unit, including topographic inspection of the magnetic center and roundness measurement of the rotor.
Evaluation of components and operating conditions:
– A preliminary inspection was conducted to identify initial defects in the rotor and stator, such as misalignment and loss of roundness.
– An analysis of the operating conditions was performed, categorizing them into normal operating conditions and system disturbance conditions for simulation purposes.
Three-dimensional modeling and finite element analysis (FEM):
– A 3D model of the Structure was created: A 3D model of the rotor spider was developed based on the drawings and field measurements.
– Simulation of stresses and loads was conducted: The application of the main loading forces, including the weight of the polar rim and poles (482 t or 4,820,000 N) and considering gravity (9.81 m/s2) was simulated.
– Boundary conditions were established: Displacement supports and frictionless supports were studied to simulate the real constraints of the system.
Assessment of Fatigue and Safety Factors:
– A fatigue study was conducted: The analysis was performed based on the maximum operating load as the primary stress condition, allowing for the identification of vulnerable areas and the calculation of safety factors for the structure.
– Areas Prone to Failures were identified: The high-risk areas for structural failure in the rotor spider were located, evaluating them under actual load conditions and constraints.
Interpretation of Results:
– The finite element results were analyzed, allowing for the determination of the magnitude of forces, stresses, and safety factors within the system.
– The primary causes of the increase in unit vibration were identified, highlighting issues with magnetic alignment and the rotor roundness.
Conclusions and Recommendations:
– Rotor improvement conditions were established, proposing actions to support further evaluation of magnetic alignment and roundness correction, such as polar rim support block base repairs and polar rim adjustments.
– Stator improvements: It was proposed to perform an alignment or leveling of the stator to enhance magnetic interaction and reduce vibrations.
Action Plan for Future Studies:
– It was proposed that additional stages of analysis should be defined to incorporate factors not evaluated in this phase, such as manufacturing defects and deformations due to continuous operation.
– The potential for conducting additional analyses of other operating conditions was proposed if the failure persists or new anomalies arise.
6. Results
6.1. Current condition and validation of physical phenomenon
Fig. 25 shows the distribution of equivalent Von Mises stresses [22] in the elements of the structure under nominal speed.
The results show a general distribution of stresses in the structure, with a maximum value of 281.17 MPa, which exceeds the yield strength of ASTM A36 ( 250 MPa). This maximum value is concentrated in the area highlighted in the red boxes.
Fig. 25Distribution of Von Mises stresses for nominal speed [12]
![Distribution of Von Mises stresses for nominal speed [12]](https://static-01.extrica.com/articles/25441/25441-img34.jpg)
In the lower left and right views of the figure, the exact location of this concentration of critical stresses is shown in a greater detail. On the other hand, the rest of the structure exhibits uniform behavior with average stresses of 50 MPa, values significantly below the yield strength, indicating that the majority of the structure operates within the established safety margins.
In Fig. 26, the distribution of total deformation (, , components) is observed across the entire structure. The analysis yielded a maximum displacement value of 3.535 mm.
Fig. 26Total deformation x,y,z of element under study [12]
![Total deformation x,y,z of element under study [12]](https://static-01.extrica.com/articles/25441/25441-img35.jpg)
In Fig. 27, the deformation corresponding only to the -axis is detailed, where the maximum reached displacement is -3.535 mm, coinciding with the total value. This behavior indicates that the largest deformations have that direction, but remain within the acceptable parameters for the analyzed structure.
Using the yield strength of A-36 steel ( 250 MPa) and the various stress concentrations obtained during the analysis, the authors calculated the distribution of safety factors (FS) for static conditions in the structural elements. This distribution is shown in Fig. 28, where regions with higher and lower safety margins are identified, allowing for the assessment of the structure capacity to withstand the applied loads in each area.
It is observed that, overall, the structure exhibits an acceptable safety factor under static loading conditions. However, critical concentrations are highlighted in the lower boxes of Fig. 28, where regions with the minimum safety factor are identified, corresponding to the marker “min”, which records a value of 0.889. This value indicates an insufficient margin against the yield strength, which could compromise the structure integrity in those areas.
Fig. 27Y-Axis deformation of element under study [12]
![Y-Axis deformation of element under study [12]](https://static-01.extrica.com/articles/25441/25441-img36.jpg)
In addition to the static stresses shown in Fig. 25, a fatigue study of the structure was conducted to assess its behavior under cyclic loads. This analysis was performed using the Soderberg criterion and employed a constant amplitude loading scheme, with values ranging from 0 to the maximum load. The number of cycles analyzed was 1,000,000, considering an infinite life for the material.
Fig. 28Safety factors in structure under static load [12]
![Safety factors in structure under static load [12]](https://static-01.extrica.com/articles/25441/25441-img37.jpg)
From this study, the distribution of the Fatigue Safety Factor was obtained, and the results are presented in Fig. 29. This analysis provides key information about the structure ability to withstand repetitive stresses without failures due to fatigue.
Fig. 29 demonstrates that the rotor spider structure presents a minimum fatigue safety factor of 0.61 at the critical point marked with the letter A (dashed white circle). This result coincides with the observations made in the static load analysis (see Fig. 28), where the same region was also highlighted as a critical area, but in this case, it is much more significant.
The results in circle A indicate that the fatigue failure at the stress concentration point, leading to the emergence of cracks at this critical point. Fig. 30 shows a current view of this region, highlighting the structural damage generated by the accumulated cyclic stress conditions, which aligns with the finite element analysis conducted.
Finally, it can be concluded that the original design of the rotor spider structure has inherent deficiencies that compromise its structural integrity. The analysis conducted reveals that the critical area identified with the letter A lacks the necessary structural capacity to adequately withstand the imposed loading conditions, both in the static analysis and in the fatigue analysis.
This finding suggests that the critical area was not designed with sufficient safety margins, increasing its vulnerability to both cyclic and static loads. The simulations and evaluations indicate that the stresses in this area exceed the permissible limits, resulting in an increased risk of structural failure. This phenomenon is attributed to the interplay of factors such as design geometry, load distribution, and the lack of consideration of the operating conditions to which the structure will be subjected throughout its service life.
The identification of these deficiencies highlights a fundamental issue in the initial design of the rotor spider, indicating that significant modifications are needed to improve its strength and reliability. Therefore, it is imperative to implement design solutions that not only address the existing failures but also incorporate engineering principles that ensure adequate performance under operating conditions. This includes reviewing the analysis methods used in the design, implementing rigorous control in manufacturing, and establishing proactive maintenance strategies to mitigate the risk of future failures.
Fig. 29Safety factors for current condition [12]
![Safety factors for current condition [12]](https://static-01.extrica.com/articles/25441/25441-img38.jpg)
Fig. 30Current fracture condition at nominal speed [12]. Photograph was taken at the unit under study by P. Hernandez on December 15, 2022
![Current fracture condition at nominal speed [12]. Photograph was taken at the unit under study by P. Hernandez on December 15, 2022](https://static-01.extrica.com/articles/25441/25441-img39.jpg)
6.2. Results discussion
This paper focused on generator vibration. The main studied element here is the rotor, which represents 68.13 % of the total weight of the rotating parts in assembly (610 t) [12], being the heaviest component. During operation, the only element that can be balanced is the rotor, as the runner, is submerged in water, cannot be adjusted. Water enables the device to reach the nominal speed required for dynamic balancing by converting potential energy into kinetic energy.
Therefore, vibration control focused on the rotor-stator assembly (generator), although other mechanical aspects such as verticality, concentricity, and rotor and stator roundness were also verified [12].
This study identifies stress concentration in the rotor spider polar rim support area (see Figs. 28-29), causing the increased generator vibration. These issues are significant, as the unit initially operated with acceptable vibration values (see Fig. 8(a)).
Examination of the mechanical components revealed that increased vibrations at higher ranges was proportional to the fatigue failure of the key supports that hold the polar rim and poles. This failure led to a gradual loss of the magnetic center between the rotor and stator due to the polar rim descent (see Fig. 18), increasing unit vibrations, especially during startup and shutdown.
This phenomenon is exacerbated by unexpected rotor mass distribution caused by the failure, along with the forces exerted by the stator trying to self-level the rotor. Unit vibration monitoring confirms this increase (see Fig. 8(a)).
Given the above, if the damaged areas are repaired and the stress concentrations are corrected, a considerable reduction in the unit vibrations is expected, which would significantly extend its lifespan. The results obtained rule out increases in vibration related to magnetic unbalance, lack of flatness of the thrust ring, or faults of both the guide and the combined bearings.
In this first stage, the static and fatigue analysis efficiently confirmed the real data, as shown in Fig. 30. For future research, a modal analysis is recommended in view of a potential rotor spider redesign.
Additionally, manufacturing defects were considered in the safety factor, as indicated in the boundary conditions in the material quality section. So, the study proposed to evaluate the maximum loads related to weight considering that, during the unit operation, the magnetic forces cancel out most of the forces generated by the weight.
Although manufacturing defects are not explicitly considered in the study, they are covered by the safety factor, as indicated in the boundary conditions in the material quality section. Additionally, the study is conducted using the most unfavorable operating and loading conditions: the design runaway speed and maximum loads.
As an extreme condition, simulations were conducted with these loads at the runaway speed indicated by the manufacturer, which is 175 RPM (210.28 % of the nominal speed) [12], significantly exceeding the 115 % runaway speed of the protection system established by the user.
7. Conclusions
After a rigorous study of the generator's current condition, supported by meticulous analysis of operational data, field measurements and detailed simulations, the following conclusions were reached.
The primary cause of the vibration increase is fatigue cracking of the bases supporting the polar rim support block on the rotor spider that support the polar rim. This structural failure produced partial detachment of the bases, causing downward displacement of the polar rim, loss of rotor-stator magnetic centering, and a significant alteration in the rotor mass distribution – conditions that explain the sustained increase in overall vibration recorded in the historical data.
Finite element analysis provided conclusive structural evidence: peak stresses were found to exceed the yield strength of ASTM A-36 steel (281.17 MPa vs. 250 MPa) and the minimum fatigue safety factor in the critical region was approximately 0.61. These results confirm the susceptibility to fatigue failure under actual cyclic loading and substantiate the fractures observed in situ at the polar rim support region.
From a dynamic perspective, the combination of air gap variations due to rotor out of roundness (deviations up to 1.7 mm) and magnetic misalignment results in an increase of the 1X vibration component, amplifying intermittent vertical forces and worsening vibrations during start up/shutdown transients and in the pass through band of a natural frequency.
Bearing problems, the thrust ring flatness and the original alignments/centricities prior to structural degradation were ruled out as primary causes.
Additionally, the stator was found to have a magnetic-center misalignment (−7 mm); this condition contributes to the problem and must be corrected as an integral part of the remedial measures.
Finally, further studies are proposed: modal design and comprehensive dynamic analysis of the rotor-stator assembly with the corrected geometry; evaluation of redesign alternatives (geometric reinforcement, material changes, improved joint/detailing); and review of operational procedures (start/stop profiles and passband through a natural frequency) to minimize transient loads that promote fatigue.
References
-
“Energia Hidroelectrica.” Iberdrola. https://www.iberdrola.com/conocenos/nuestra-actividad/energia-hidroelectrica
-
A. H. Elbatran, M. W. Abdel-Hamed, O. B. Yaakob, and Y. M. Ahmed, “Hydro power and turbine systems reviews,” Jurnal Teknologi Hydro Power and Turbine Systems Reviews, Vol. 74, No. 5, pp. 2180–3722, May 2015, https://doi.org/10.11113/jt.v74.4646
-
“Turbina enciclopedia de energia.” Calgary Universidad, https://energyeducation.ca/encyclopedia/main_page
-
F. F. Ehrich, Handbook of Rotordynamics. Krieger Pub. Co., 1999.
-
L. Niu, Q. Sun, C. Ma, J. Liao, and J. Pu, “Research on modal analysis of rotor shaft system of hydro-generator,” in Journal of Physics: Conference Series, Vol. 1549, No. 4, p. 042084, Jun. 2020, https://doi.org/10.1088/1742-6596/1549/4/042084
-
W. Wang, Y. Shang, and Z. Yao, “A predictive analysis method of shafting vibration for the hydraulic-turbine generator unit,” Water, Vol. 14, No. 17, p. 2714, Aug. 2022, https://doi.org/10.3390/w14172714
-
M. Baral, K. Pokharel, and M. C. Luintel, “Transverse vibration analysis of hydro-generator assembly,” in 14th IOE Graduate Conference, Dec. 2023.
-
M. Jurcu, I. Pădureanu, C. V. Campian, and C. Haţiegan, “Unbalance influence on the rotating assembly dynamics of a hydro,” in IOP Conference Series: Materials Science and Engineering, Vol. 294, No. 1, p. 012028, Jan. 2018, https://doi.org/10.1088/1757-899x/294/1/012028
-
“Standard ISO 7919-5. Mechanical vibration-evaluation of machine vibration by measurements on rotating shafts,” ISO, 2005.
-
W. Wu et al., “Effect of unbalanced magnetic pull of generator rotor on the dynamic characteristics of a pump-turbine rotor system,” Water, Vol. 15, No. 6, p. 1120, Mar. 2023, https://doi.org/10.3390/w15061120
-
Y. Long and Y. Ye, “Axial vibration analysis of thrust support of vertical hydrogenerator unit,” in E3S Web of Conferences, Vol. 276, p. 02020, Jun. 2021, https://doi.org/10.1051/e3sconf/202127602020
-
Y. Cabrera, “Fuente Propia,” Personal, PZO, 2024.
-
“Machinery protection systems API standard 670 4th edition,” API, 2003.
-
“IEEE Guide for operation and maintenance of hydro-generators,” IEEE Std 492-1999, 1999, https://doi.org/10.1109/ieeestd.1999.89194
-
D. C. Montgomery and G. C. Runger, Applied Statistics and Probability for Engineers. Wiley, 2013.
-
D. Freeman, R. Pisani, and R. Purves, Statistics. W. W. Norton & Company, 2007.
-
W. D. Wayne and Chad L. C., Biostatistics A Foundation for Analysis in the Health Sciences. Wiley, 2018.
-
“ASME boiler and pressure vessel code an international code,” ASME, 2021.
-
J. Schijve, Fatigue of Structures and Materials. Dordrecht: Springer Netherlands, 2009, p. 1,144, https://doi.org/10.1007/978-1-4020-6808-9
-
A. Hambardzumyan, “Fatigue Testing: S-N Curves and Their Significance,” Jan. 2025, https://tactun.com/fatigue-testing-s-n-curves-and-their-significance/
-
A. Pugsley, “The safety of structures,” SCRIBD, https://es.scribd.com/document/509270173/10-carga-fluctuante-fatiga?v=0.466
-
D. Hutton, Fundamentals of Finite Element Analysis. McGraw-Hill, 2004.
About this article

The authors have not disclosed any funding.
The datasets generated during and/or analyzed during the current study are available from the corresponding author on reasonable request.
Cabrera Yerry: conceptualization, formal analysis, investigation, methodology, writing-original draft, writing-review and editing, validation, funding acquisition. Velasquez Sergio: conceptualization, supervision, writing-review and editing. Campos Alfredo: methodology, writing-review and editing. Prada Engels: data curation, project administration. Hernandez Pedro: data curation, formal analysis, supervision, validation.
The authors declare that they have no conflict of interest.
