Abstract
Open-access DEMs, combined with efficient processing, provide a reliable first assessment of urban terrain. This study benchmarks three global models – AW3D30 and NASADEM (∼30 m) and the coarser SRTM15 Plus (∼500 m) – to evaluate their ability to represent the complex relief of Tashkent, Uzbekistan. All DEMs were clipped to the municipal boundary, cleaned of nodata artefacts, and processed in QGIS to generate slope, aspect, roughness and hillshade layers. The 30 m models capture steep breaks, micro-ridges and drainage heads that the 500 m grid generalises, affecting estimates of critical road gradients and shifting drainage pathways by up to 200 m. AW3D30 roughness correlates strongly with field checks ( 0.81), confirming its suitability for early earth-work and hazard screening. Overall, freely available 30 m DEMs and open-source tools already provide terrain intelligence adequate for first-round corridor siting, drainage planning and landslide reconnaissance in rapidly urbanising Central Asian cities, offering a transferable, low-cost workflow where high-end surveys are unavailable.
1. Introduction
Digital Elevation Models (DEMs) provide the core inputs for 3D terrain analysis and the derivation of key morphometric layers-elevation, slope, aspect, roughness and hillshade-used in planning, hydrology, ecology and infrastructure design. Tashkent, Central Asia’s largest city, requires such terrain intelligence, yet high-resolution topographic data remain limited.
To fill this gap, we analysed the city’s land surface using three open-access DEMs from OpenTopography: AW3D30 (≈ 30 m), NASADEM (≈ 30 m) and SRTM15 Plus (≈ 450-500 m). All datasets were clipped to the municipal boundary, void-checked, and processed in QGIS to derive standard terrain variables. Their differing resolutions allowed us to assess how grid spacing influences representation of fine-scale relief and to evaluate suitability for land-use planning, ecological-corridor mapping, flood-routing, and initial geo-hazard screening.
Results show pronounced within-city relief variation and demonstrate that coarse DEMs suppress critical micro-features, generating systematic differences linked to resolution and data lineage. The workflow provides a transparent, reproducible and low-cost basis for incorporating morphometric evidence into infrastructure and hazard-mitigation planning in Tashkent and other rapidly developing Central Asian cities.
2. Literature review
Digital elevation models and terrain analysis: DEMs and derived terrain attributes-slope, roughness, curvature-are fundamental for assessing land stability and guiding urban planning. Numerous studies show that DEM resolution strongly affects the accuracy of morphometric parameters and hazard models: finer grids and improved interpolation yield more reliable slope and surface metrics, especially in complex terrain [1, 2]. High-quality elevation data therefore form the basis for robust terrain-risk evaluation.
Machine learning approaches for landslide susceptibility: ML algorithms – Random Forest (RF), Support Vector Machines (SVM), Artificial Neural Networks (ANN) and Logistic Regression (LR) – are widely applied in susceptibility mapping [3]. RF effectively captures nonlinear relations and limits overfitting, whereas LR offers interpretable factor weights. Reviews emphasise the importance of model validation through AUC metrics and k-fold testing [4, 5]. Case studies confirm ML effectiveness, with RF achieving AUC values up to 0.91 in the Three Gorges region [6].
Impact of DEM resolution and global models: DEM resolution is a major source of variation in hazard modelling. Coarse or poorly interpolated grids can distort slope and curvature estimates, propagating systematic errors [1, 7]. Recent global evaluations show that the Copernicus DEM (TanDEM-X derived) outperforms SRTM, ALOS World 3D and ASTER GDEM in vertical accuracy, smoothness and hydrological reliability [8, 9]. FABDEM, derived from Copernicus, similarly exceeds NASA’s SRTM and ASTER in error statistics. These advances highlight the value of using high-quality 30 m DEMs-or applying filtering – to support reliable landslide and flood assessments.
Cloud computing platforms and local model considerations: Google Earth Engine (GEE) enables scalable susceptibility mapping by combining multi-source geospatial datasets with ML algorithms and supporting rapid, large-area processing [10]. Yet researchers stress that modelling must reflect local geomorphology: landslide-inventory quality, mapping-unit choice (pixel vs slope-unit) and validation strategy strongly influence performance [11]. No universal method exists; rigorous cross-validation, data splitting and field checks are essential to avoid inflated accuracy estimates.
Modern remote sensing for landslide detection and monitoring: Recent sensing advances have strengthened hazard monitoring. Sentinel-1 InSAR, with its free access and 6-12-day revisit cycle, is now the dominant tool for detecting precursory ground deformation in all-weather, day-night conditions [12]. Time-series InSAR effectively maps millimetric slope motion preceding major failures, enabling early warning [13]. High-resolution UAV photogrammetry and LiDAR complement radar data by capturing fine-scale micro-topography, post-failure morphology and reactivation potential, improving inventories and model calibration in data-scarce regions [14].
The literature shows that reliable hazard mapping depends jointly on high-fidelity terrain data and appropriate analytical techniques. Contemporary studies increasingly integrate high-resolution DEMs, advanced ML approaches, cloud platforms and modern sensing technologies (InSAR, UAV-LiDAR) to produce accurate, context-specific susceptibility assessments. Aligning data quality with terrain-appropriate modelling remains crucial for capturing geomorphological processes and supporting informed risk-mitigation planning.
3. Data collection method
This study used openly accessible Digital Elevation Models (DEMs) from the OpenTopography platform to analyse Tashkent’s terrain. Three global DEMs with different resolutions were selected to evaluate how grid spacing affects surface representation: AW3D30 (≈ 30 m, JAXA/ALOS PRISM), NASADEM (≈ 30 m, enhanced SRTM), and SRTM15Plus (≈450-500 m, NASA-Scripps). All datasets were downloaded in GeoTIFF format.
DEM tiles covering Tashkent were imported into QGIS, clipped to the municipal boundary, checked for NoData artefacts, and corrected through minor interpolation. Each raster was processed in QGIS/GDAL to generate the key morphometric layers: elevation, slope (Horn), aspect (8 classes), roughness (5×5 SD), and hillshade (315°/45°).
These preprocessing steps produced a consistent, high-quality DEM stack suitable for comparing slope, roughness, and aspect patterns across Tashkent. The resulting layers formed the analytical basis for assessing terrain constraints relevant to infrastructure planning, drainage design, and hazard evaluation.
4. Methodology
This study applied a comparative morphometric analysis of three global DEMs (AW3D30, SRTM15Plus, NASADEM) to characterise Tashkent’s terrain and assess their applicability to urban infrastructure planning. The workflow comprised DEM preparation, derivation of morphometric layers, raster normalisation, comparative analysis, and documentation.
All DEMs were downloaded from OpenTopography in GeoTIFF format – AW3D30 (30 m), NASADEM (30 m, enhanced SRTM) and SRTM15Plus (~500 m) – and clipped to the Tashkent administrative boundary (OSM) for spatial consistency. Processed rasters were imported into QGIS, where elevation, color relief, hillshade (315°/45°), slope (Horn algorithm), aspect (8 classes) and roughness (5×5 SD) were generated to support interpretation of surface form and planning-relevant terrain constraints.
Raster layers were normalised for visual comparability, mostly scaled to 0-255, with slope and aspect grouped into engineering-relevant categories. An OSM basemap and boundary mask provided contextual reference. The derived maps were then compared to identify elevation, slope, aspect, roughness and flow-path patterns, with emphasis on features influencing corridor design, drainage, and hazard assessment. Inter-DEM comparisons evaluated how well each dataset captured terrain complexity in steep or dissected areas.
Final outputs were exported as PNGs with preserved symbology, accompanied by notes describing value ranges, key terrain characteristics and planning implications. A consolidated table summarised DEM specifications – resolution, vertical reference, source, lineage, format and known limitations – providing a reproducible framework for assessing urban terrain morphology and the suitability of open-access DEMs for infrastructure analysis in Tashkent and similar cities.
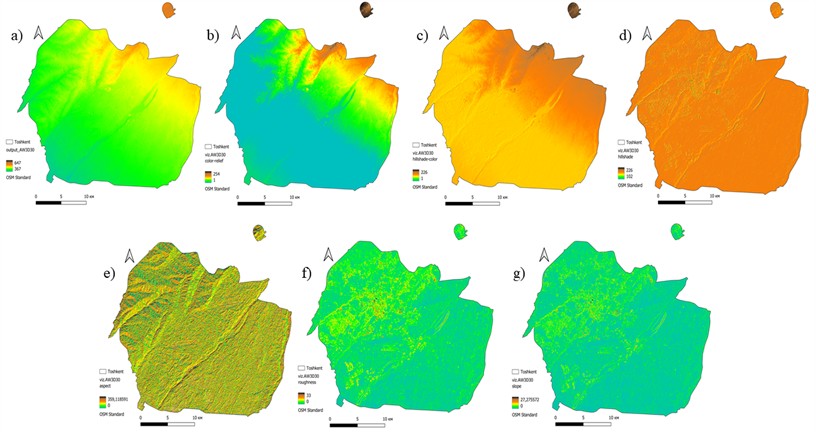
Fig. 1Morphometric maps of Tashkent city based on the AW3D30 DEM from OpenTopography, showing key terrain features for urban and infrastructure planning
5. Results and discussion
The AW3D30 outputs provide the most detailed representation of Tashkent’s terrain, revealing fine-scale variations essential for urban analysis.
Fig. 1 summarises the raster derivatives obtained from the AW3D30 DEM, offering detailed urban-scale terrain insights: (a) elevation shows fine-scale relief from ~367 m in valley floors to ~647 m on ridges; (b) color relief highlights altitude zones for easier visual interpretation; (c, d) hillshade and hillshade-color simulate illumination (315°/45°) to enhance slope perception and hazard-area visibility; (e) aspect identifies dominant slope orientations influencing solar exposure and microclimate; (f) roughness indicates terrain irregularity, with values > 20 marking dissected terrain and most urban areas < 5; and (g) slope reveals inclinations from flat surfaces up to 27.3°, essential for evaluating construction suitability and runoff potential.
Fig. 2Histogram of aspect raster layer (based on AW3D30 model)
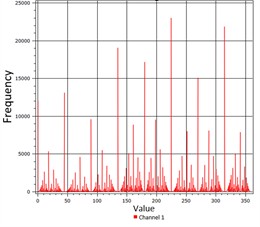
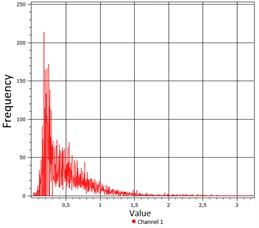
Fig. 3Histogram of terrain roughness raster layer (based on AW3D30 model)
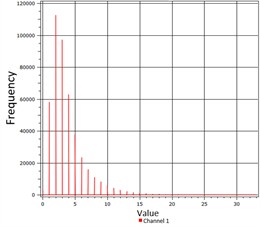
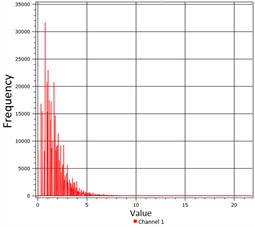
Fig. 4Histogram of terrain slope raster layer (based on AW3D30 model)

Figs. 2-4: AW3D30 pixel-value distributions.
Fig. 2 (Aspect): Values span 0-360°, with peaks near 90° and 270°, indicating dominant east- and west-facing slopes.
Fig. 3 (Roughness): Most pixels fall within 0-5, confirming generally smooth urban topography.
Fig. 4 (Slope): Slopes >15° are uncommon; most terrain lies in the 0-5° range, favorable for construction.
5.1. SRTM15Plus-based outputs
The SRTM15Plus results illustrate how coarse resolution substantially limits terrain interpretation.
Fig. 5 shows the morphometric layers generated from the ~450-500 m SRTM15Plus DEM, reflecting a highly generalised representation of terrain: (a) elevation appears strongly smoothed due to coarse resolution; (b) color relief displays limited gradation, reducing micro-zoning applicability; (c, d) hillshade and hillshade-color lose fine-scale detail and are useful mainly for broad regional assessment; (e) aspect exhibits abrupt transitions typical of coarse raster generalisation, allowing only macro-orientation interpretation; (f) roughness maps depict predominantly low values, though edge artefacts and pixel averaging obscure local variability; and (g) slope values rarely exceed 3° – most remain below 1° – leading to a significant underestimation of true urban gradients.
Figs. 6-8: SRTM15Plus histograms.
Fig. 6 (Aspect): Values cluster around a few dominant directions, indicating low terrain-detail sensitivity.
Fig. 7 (Roughness): Most values < 5, reflecting over-smoothed relief.
Fig. 8 (Slope): Slopes are predominantly < 1°, capturing general flatness but missing key gradients.
Fig. 5Morphometric maps of Tashkent city derived from the SRTM15Plus DEM, highlighting terrain features at coarse resolution
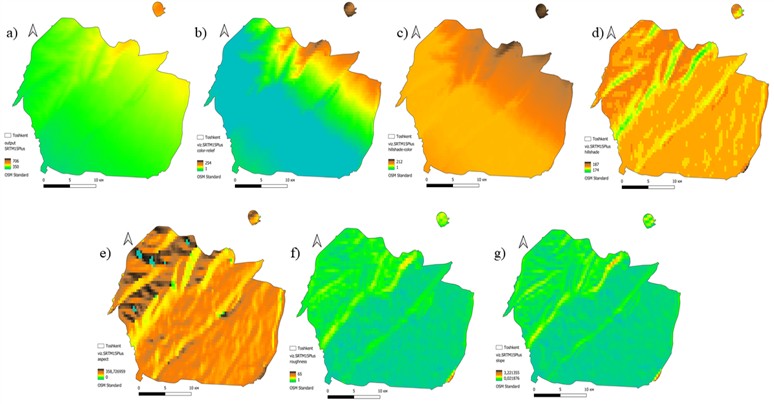
Fig. 6Histogram of pixel illumination values in the hillshade-color layer of the SRTM15Plus relief model
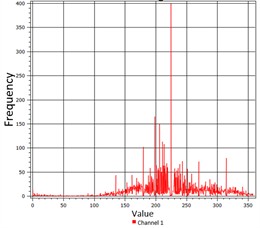
Fig. 7Histogram of terrain roughness values calculated from the SRTM15Plus DEM

Fig. 8Histogram of slope values derived from the SRTM15Plus relief model
5.2. NASADEM-based outputs
The NASADEM results offer a high-resolution (30 m) alternative to AW3D30, with differences mainly tied to vertical referencing and void-filling methods.
Fig. 9 shows the NASADEM-derived morphometric layers (30 m), which differ from AW3D30 mainly in vertical referencing and void-filling: (a) elevation spans 359-638 m, comparable to AW3D30 with minor gradient differences; (b) color relief highlights mid-elevation zones more effectively than SRTM15Plus; (c, d) hillshade outputs provide clear terrain definition, with slight shading variations linked to data-source differences; (e) aspect is more continuous than SRTM15Plus but less detailed than AW3D30; (f) roughness captures local variability reasonably well, though terrain breaks are portrayed slightly less sharply than in AW3D30; and (g) slope reaches up to 21.69°, making the dataset suitable for evaluating urban gradients and initial geohazard screening.
Figs. 10-12: NASADEM histograms
Fig. 10 (Aspect): Shows well-distributed orientations matching natural variability.
Fig. 11 (Roughness): Similar to AW3D30, with most values < 5.
Fig. 12 (Slope): Confirms dominance of gentle slopes (< 5°) with a right-tail of isolated steeper pixels.
Fig. 9A set of morphometric maps based on the NASADEM digital elevation model (DEM) for the relief of Tashkent city
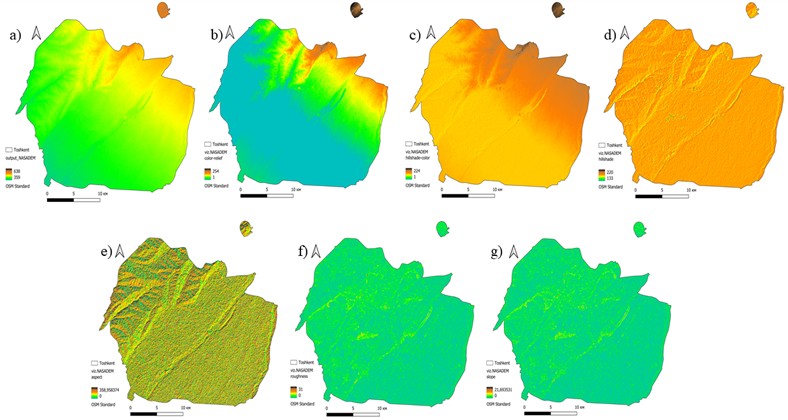
Fig. 10Aspect raster histogram based on NASADEM DEM
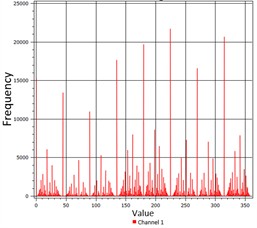
Fig. 11Histogram of terrain roughness raster layer (based on NASADEM DEM)
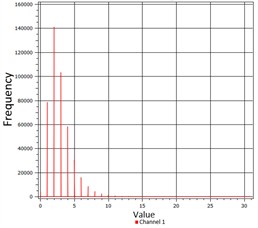
Fig. 12Slope histogram of the relief (viz.NASADEM_ slope)
5.3. Comparative interpretation
The 30 m DEMs (AW3D30, NASADEM) yield similar results, though AW3D30 preserves finer slope and roughness detail. For urban planning, AW3D30 provides the most useful terrain detail, while NASADEM serves as a viable alternative; SRTM15Plus is suitable only for regional overviews, as it underestimates key gradients and terrain breaks. Histogram patterns confirm overall low slopes and roughness in Tashkent, with differences largely driven by DEM resolution.
6. Conclusions
This study conducted a detailed morphometric analysis of Tashkent using three open-access DEMs (AW3D30, NASADEM, SRTM15Plus) from OpenTopography, generating key derivatives such as elevation, color relief, hillshade, aspect, roughness and slope to characterise the city’s terrain for planning and environmental assessment. Results show that DEM performance depends heavily on resolution and data lineage: AW3D30, with its 30 m detail, captured the most accurate fine-scale features and was most suitable for applications like corridor siting, drainage alignment and hazard screening, while NASADEM provided similar continuity and SRTM15Plus (~500 m) was useful mainly for regional overviews. Each morphometric layer offered specific value – slope for construction suitability and runoff modelling, aspect for microclimate and solar-energy planning, hillshade and color relief for effective visualisation, and roughness for detecting localised geological risks. Overall, the workflow delivers a scalable and replicable basis for terrain-informed decision-making in data-scarce, hazard-prone regions, and can be readily applied beyond Tashkent to support resilient and sustainable urban development.
7. Future work and directions
This study establishes a baseline for DEM-based terrain analysis in Tashkent. Future work may incorporate higher-resolution datasets (e.g., LiDAR, TanDEM-X), apply multi-temporal DEMs to monitor urban growth and slope change, and enhance hydrological modelling by integrating flow patterns with rainfall and land-cover data. Additional improvements include using ML algorithms (RF, SVM, ANN) with terrain factors and hazard inventories, developing 3D urban models by merging DEMs with building and infrastructure layers, and conducting multi-criteria land-suitability analyses (AHP, weighted overlays). These efforts will further improve terrain intelligence for Tashkent and support resilient planning in other data-limited Central Asian cities.
References
-
J. P. Wilson, “Digital terrain modeling,” Geomorphology, Vol. 137, No. 1, pp. 107–121, Jan. 2012, https://doi.org/10.1016/j.geomorph.2011.03.012
-
H. I. Reuter, T. Hengl, P. Gessler, and P. Soille, “Preparation of DEMs for geomorphometric analysis,” Developments in Soil Science, Vol. 33, pp. 87–120, Jan. 2009, https://doi.org/10.1016/s0166-2481(08)00004-4
-
C. Ye, H. Wu, T. Oguchi, Y. Tang, X. Pei, and Y. Wu, “Physically based and data-driven models for landslide susceptibility assessment: principles, applications, and challenges,” Remote Sensing, Vol. 17, No. 13, p. 2280, Jul. 2025, https://doi.org/10.3390/rs17132280
-
M. Ado et al., “Landslide susceptibility mapping using machine learning: a literature survey,” Remote Sensing, Vol. 14, No. 13, p. 3029, Jun. 2022, https://doi.org/10.3390/rs14133029
-
G. Sofia, A. Eltner, E. Nikolopoulos, and C. Crosby, “Leading progress in digital terrain analysis and modeling,” ISPRS International Journal of Geo-Information, Vol. 8, No. 9, p. 372, Aug. 2019, https://doi.org/10.3390/ijgi8090372
-
C. Okolie, J. Mills, A. Adeleke, and J. Smit, “Digital elevation model correction in urban areas using extreme gradient boosting, land cover and terrain parameters,” The International Archives of the Photogrammetry, Remote Sensing and Spatial Information Sciences, Vol. XLVIII-4/W9-2024, pp. 275–282, Mar. 2024, https://doi.org/10.5194/isprs-archives-xlviii-4-w9-2024-275-2024
-
N. Brožová, T. Baggio, V. D. ’Agostino, Y. Bühler, and P. Bebi, “Multiscale analysis of surface roughness for the improvement of natural hazard modelling,” Natural Hazards and Earth System Sciences, Vol. 21, No. 11, pp. 3539–3562, Nov. 2021, https://doi.org/10.5194/nhess-21-3539-2021
-
M. V. Alba-Fernández, F. J. Ariza-López, and M. D. Jiménez-Gamero, “A new approach to the quality control of slope and aspect classes derived from digital elevation models,” Remote Sensing, Vol. 13, No. 11, p. 2069, May 2021, https://doi.org/10.3390/rs13112069
-
C. Bielski et al., “Novel approach for ranking DEMs: Copernicus DEM improves one arc second open global topography,” IEEE Transactions on Geoscience and Remote Sensing, Vol. 62, pp. 1–22, Jan. 2024, https://doi.org/10.1109/tgrs.2024.3368015
-
W. Wu et al., “A data-driven model on Google earth engine for landslide susceptibility assessment in the Hengduan Mountains, the Qinghai-Tibetan Plateau,” Remote Sensing, Vol. 14, No. 18, p. 4662, Sep. 2022, https://doi.org/10.3390/rs14184662
-
M. C. Herrera-Coy et al., “Landslide susceptibility analysis on the Vicinity of Bogotá-Villavicencio road (Eastern Cordillera of the Colombian Andes),” Remote Sensing, Vol. 15, No. 15, p. 3870, Aug. 2023, https://doi.org/10.3390/rs15153870
-
Y. Cheng et al., “Applications and advancements of spaceborne InSAR in landslide monitoring and susceptibility mapping: a systematic review,” Remote Sensing, Vol. 17, No. 6, p. 999, Mar. 2025, https://doi.org/10.3390/rs17060999
-
J. L. Mesa-Mingorance and F. J. Ariza-López, “Accuracy assessment of digital elevation models (DEMS): a critical review of practices of the past three decades,” Remote Sensing, Vol. 12, No. 16, p. 2630, Aug. 2020, https://doi.org/10.3390/rs12162630
-
X. Chen et al., “Rill erosion and drainage development in post-landslide settings using UAV-LiDAR Data,” Soil Systems, Vol. 9, No. 2, p. 42, May 2025, https://doi.org/10.3390/soilsystems9020042
-
N. A. Muhadi, A. F. Abdullah, S. K. Bejo, M. R. Mahadi, and A. Mijic, “The use of LiDAR-derived DEM in flood applications: a review,” Remote Sensing, Vol. 12, No. 14, p. 2308, Jul. 2020, https://doi.org/10.3390/rs12142308
-
Z. Zhao, Z. Y. Liu, and C. Xu, “Slope unit-based landslide susceptibility mapping using certainty factor, support vector machine, random forest, CF-SVM and CF-RF Models,” Frontiers in Earth Science, Vol. 9, p. 58963, Mar. 2021, https://doi.org/10.3389/feart.2021.589630
About this article

The authors have not disclosed any funding.
The datasets generated during and/or analyzed during the current study are available from the corresponding author on reasonable request.
The authors declare that they have no conflict of interest.
