Abstract
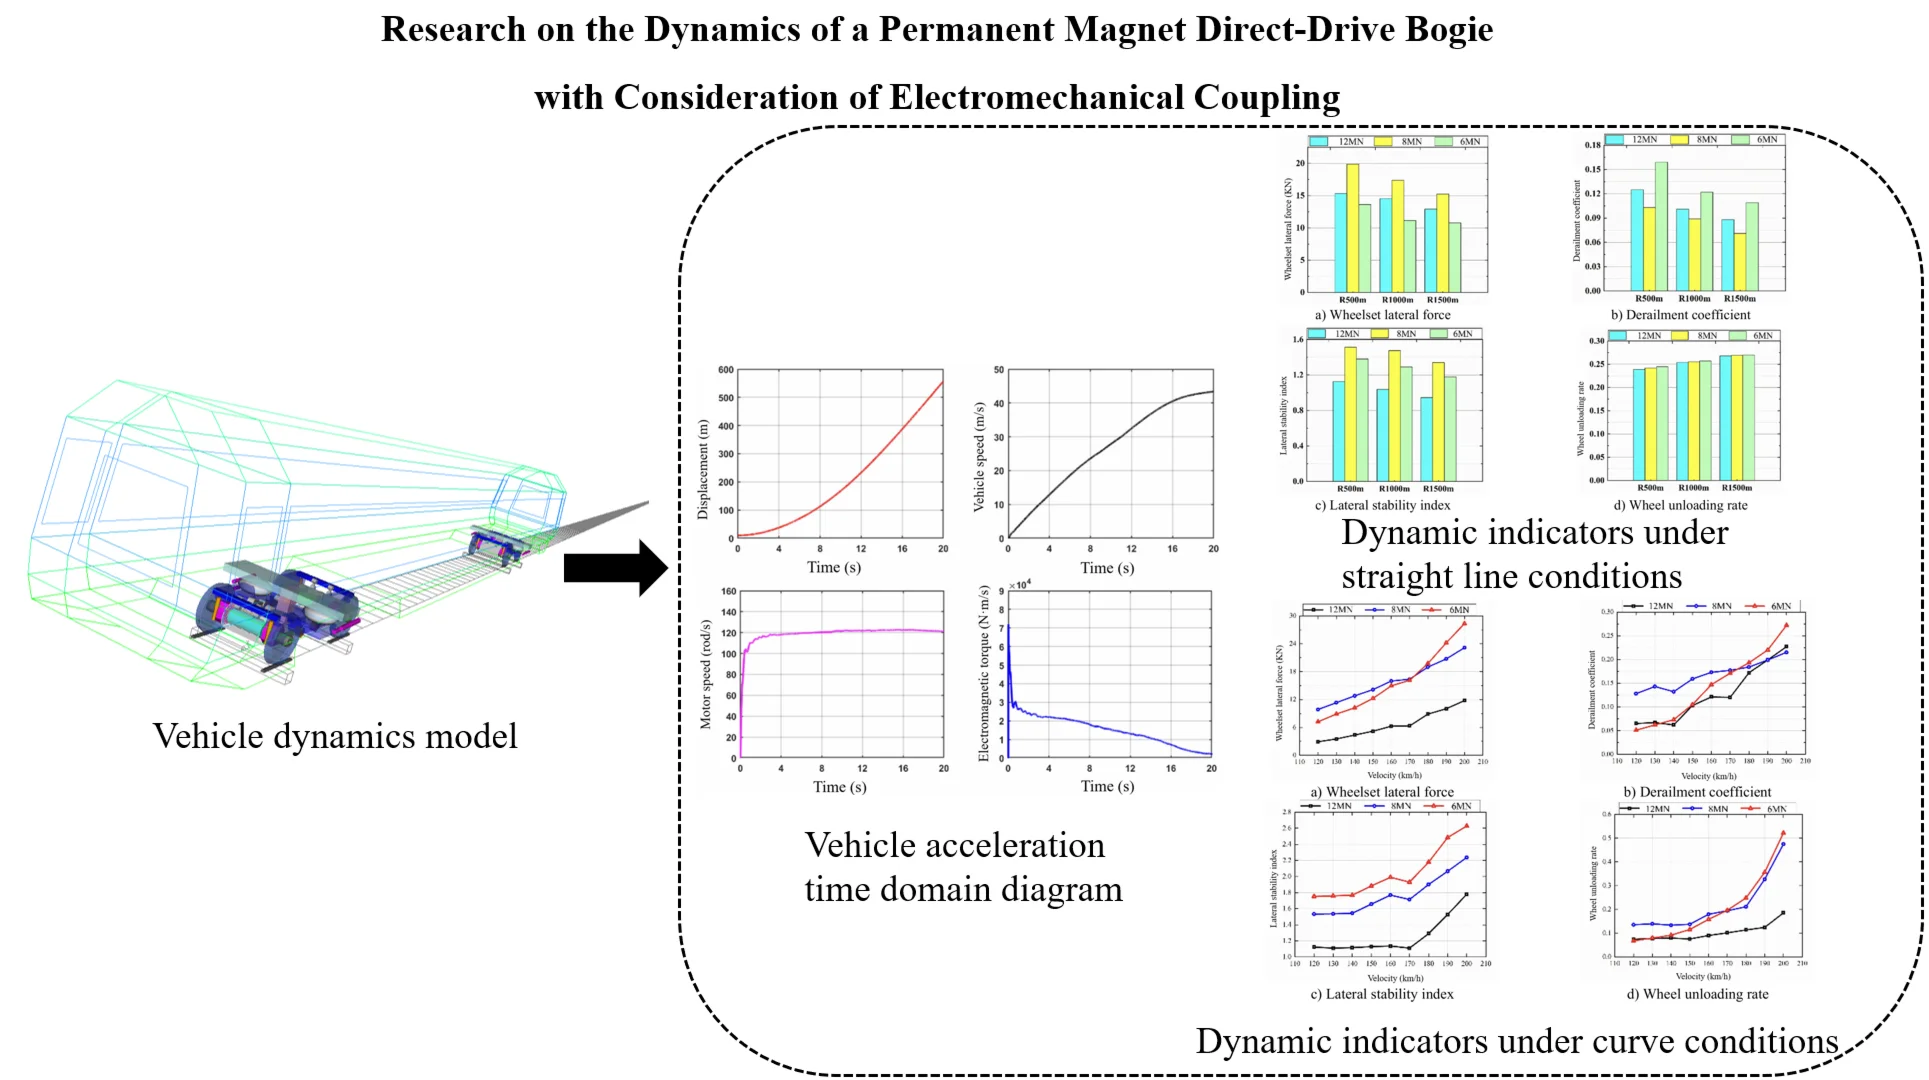
A vehicle–motor coupled dynamic model for a permanent magnet direct-drive (PMDD) axlebox-built-in bogie operating at 120-200 km/h is developed in this study. The model integrates a multibody vehicle system and a PMSM traction system under an SVPWM vector-control strategy to investigate electromechanical coupling effects. The influence of current-loop and speed-loop control parameters on motor output characteristics and vibration transmission is analyzed. Simulation results show that the dominant frequencies of vehicle lateral and vertical vibrations are mainly concentrated in 3-15 Hz, and the vehicle maintains stable dynamic performance during traction. The speed-loop parameters significantly affect the coupled vibration between the motor and the bogie frame and may induce vertical resonance, while the current-loop parameters have minimal impact. Furthermore, the analysis of motor-suspension stiffness indicates that higher stiffness improves high-speed running stability. The proposed model provides guidance for PMDD traction system control optimization and bogie design for 120-200 km/h urban rail trains.
Highlights
- An electromechanical co-simulation model is developed to investigate control-induced vibration in a permanent magnet direct-drive bogie.
- Speed-loop parameters are identified as the dominant factor affecting motor–frame coupled vibration, while current-loop effects are negligible.
- Proper tuning of control and suspension parameters is critical to suppress resonance and improve vehicle dynamic performance at 120–200 km/h.
1. Introduction
Against the backdrop of global urbanization and carbon neutrality initiatives, rail transit is a cornerstone of sustainable transportation. Its energy efficiency and dynamic performance are now key metrics for progress[1]. Traditional asynchronous motor systems, limited by gearbox losses and high unsprung mass, struggle to meet the demands of new urban trains for high power density and low vibration. Permanent magnet direct-drive (PMDD) bogies offer a promising alternative. They provide high efficiency, compact size, low weight, and excellent dynamics. This gearless technology enables direct traction, offers high positioning accuracy, and improves performance on tight curves, making it compatible with independent wheels and radial bogies [2-7].
The suspension configuration critically influences the dynamics of PMDD bogies. Early designs often used axle-hung motors [8-10], which are mounted directly on the wheelset. While efficient for torque transmission, this increases unsprung mass, limiting their use to speeds below 120 km/h. In contrast, frame-mounted and body-mounted suspensions use elastic elements to isolate the motor from the wheelset, effectively dampening high-frequency vibration [11, 12].
Current research primarily focuses on optimizing the mechanical suspension in isolation, paying insufficient attention to its coupling with electromagnetic characteristics and control strategies. Existing studies highlight several key interactions: Feng et al. [13] showed that while direct drive reduces gear-induced vibration, bogie frame flexibility must be optimized to mitigate motor inertia effects. Guo et al. [14] developed a high-speed EMU dynamics model that incorporated a flexible car body and a frame-mounted motor. By deriving the system's transfer function, they analyzed the influence of motor suspension parameters on the vibrations of the car body, the bogie frame, and the motor itself. Xue et al. [15] demonstrated that frame elasticity can amplify electromagnetic excitations, requiring careful frequency separation. Simulation by Wang et al. [16] indicated that a 20 % reduction in the vertical stiffness of an elastically frame-mounted motor could lower car-body vertical vibration by 18 %, though high lateral stiffness is required to prevent excessive motor displacement. Li et al. [17] further identified that the dynamic stiffening effect of such elastic suspensions can amplify high-frequency car-body vibration at elevated speeds, necessitating time-varying damping control. Practical benefits and challenges were confirmed through tests: Xiao et al. [18] reported a mass reduction of 1.1 tonnes per bogie with a frame-mounted PMDD system, but highlighted the need to manage motor-frame clearance on tight curves. Similarly, Ma et al. [19] demonstrated via simulation a 23 % reduction in lateral wheel-rail force under straight-running conditions, though noting increased wheel-rail wear during curving due to motor lateral inertia. Zhao et al. [20] found that current harmonics above 12 % can increase frame vibration by 37 %, necessitating co-optimization of control and mechanical systems. Zhu [21]conducted a comprehensive spectral analysis of these coupled vibrations. Finally, the control system itself introduces constraints, as precise accelerometer feedback is required [22], and methods like field-weakening control [23] directly alter magnetic fields. In summary, the mechanical and electrical domains are deeply intertwined.
To address this gap, this paper develops a co-simulation model that integrates electrical and mechanical dynamics. This model is used to analyze the dynamic coupling between control parameters and suspension settings during traction, straight-line running, and curve negotiation. The study quantifies the impact of these interactions on vehicle vibration. The findings provide a practical foundation for developing future urban rail vehicles designed for speeds of 120-200 km/h.
In this study, we develop a co-simulation platform integrating Simpack and Matlab/Simulink to investigate the electromechanical coupling dynamics of a PMDD bogie. The key contributions include: (1) establishing a high-fidelity vehicle-motor coupled dynamics model considering both mechanical suspension and electromagnetic control; (2) revealing the distinct roles of current-loop and speed-loop parameters in vibration transmission; (3) quantifying the impact of motor suspension stiffness on vehicle safety and ride comfort under traction, straight-line, and curved conditions. These findings provide a practical foundation for the design and control of next-generation urban rail vehicles.
2. Model
Previous research has demonstrated that electromechanical coupling vibration significantly influences traction drive systems. The multi-interaction model proposed in [24] confirms that electromagnetic torque fluctuations can excite mechanical structures through suspension paths. Inspired by these findings, the model developed in this study explicitly accounts for the coupling relationships among motor torque ripple, speed loop dynamics, suspension stiffness, and bogie vibration.
2.1. Permanent magnet synchronous motor (PMSM) model
The voltage and torque equations of the Permanent Magnet Synchronous Motor (PMSM) adopted in this study are established based on classical motor theory and standard vector control formulations. Given that their derivations are well-documented in the literature, they are omitted here for brevity.
To simplify the computational process in motor control, the model is transformed from the three-phase stationary coordinate system to a two-phase rotating coordinate system. The stator voltage equilibrium equations for the permanent magnet direct-drive motor in the M-T coordinate frame are thus obtained as:
where is the stator flux linkage component on the -axis, is the electrical angular velocity, and is the stator flux linkage component on the -axis. Neglecting the motor’s saliency effect, the flux linkage equations are given by:
where and are the direct-axis and quadrature-axis inductances, respectively. Applying the constant-amplitude transformation principle, the electromagnetic torque of the PMSM is given by:
The mechanical equation of motion for the motor is:
where is the load torque, is the mechanical angular velocity, is the damping coefficient, and is the moment of inertia. The parameters of the permanent magnet direct-drive motor used in this study are listed in Table 1.
Table 1Parameters of permanent magnet direct drive motor
Technical parameter | Sign | Numerical value | Unit |
Direct-axis inductance | 8.5×10⁻⁵ | H | |
Cross-axis inductance | 8.5×10⁻⁵ | H | |
Flux linkage | 0.175 | Wb | |
Motor inertia | 0.3 | kg/m2 | |
Viscous damping | 8×10⁻³ | N·m | |
Motor pole pairs | 4 | – |
2.2. Vehicle electromechanical coupling model
The vehicle dynamics model, developed in Simpack, is shown in Fig. 1. The permanent magnet direct-drive (PMDD) vehicle model comprises one car body, two bogie frames, two bolsters, four wheelsets, four PMDD motor units (including stators and rotors), eight axle boxes, and sixteen linkage rods (incorporating axle box arms and motor suspension rods). The car body, bogie frames, bolsters, wheelsets, and linkage rods are modeled with six degrees of freedom each: vertical, lateral, longitudinal, roll, pitch, and yaw. In contrast, the axle boxes, motor stators, and rotors are assigned only a pitch degree of freedom. The key parameters and their corresponding values for the vehicle dynamics model are provided in Table 2.
2.3. Simulation configuration and conditions
To ensure the clarity and reproducibility of the simulation results, the simulation configuration and operational conditions are defined as follows.
– Vibration measurement points:
The car-body acceleration was extracted at virtual measurement points on the cabin floor, located 1.0 m from the centers of the front and rear bogies toward the vehicle centerline. The bogie-frame acceleration was extracted at the primary suspension mounting locations of the front and rear bogies.
– Track excitation and wheel-rail interface:
Simulations were performed under the American Grade V track spectrum. The wheel-rail contact geometry was defined using the LMB10N wheel profile and the CN60N rail profile.
– Nature of the study:
This work is a purely numerical and simulation-based investigation. All vibration responses were obtained from virtual measurement points defined in the Simpack multibody model. No physical experiments or real sensors were involved; thus, all accelerations refer to numerically calculated signals.
Fig. 1Vehicle dynamics model

Table 2Parameters of permanent magnet direct-drive axlebox built-in bogie section
Parameter | Sign | Parameter value | Unit |
Half of bogie wheelbase | 1 | m | |
Vehicle distance | 17.8 | m | |
Tire size | 0.46 | m | |
Track gauge | 1.435 | m | |
Axle box quality | 80 | kg | |
Frame mass | 2300 | kg | |
Vehicle mass | 43000 | kg | |
Wheelset weight | 1440 | kg | |
Stator shell quality of permanent magnet motor | 700 | kg | |
Rotor quality of permanent magnet motor | 300 | kg | |
Primary longitudinal positioning stiffness | 15 | MN/m | |
Primary lateral positioning stiffness | 7.5 | MN/m | |
Secondary transverse reduction stiffness | 205 | kN/m | |
Anti-yaw damper stiffness | 205 | kN/m | |
Secondary transverse damping | 6 | kN·s/m | |
Anti-yaw damper damping | 750 | kN·s/m | |
Motor rod joint stiffness | 46.2 | MN/m | |
Damping of motor pull rod | 46.2 | kN·s/m | |
Stiffness of motor sling joint | 11.5 | MN/m | |
Damping of motor sling | 46.2 | kN·s/m | |
Motor coupling stiffness | 0.12 | kN/m | |
Motor coupling damping | 100 | N·s/m |
3. SVPWM motor control strategy
Space Vector Pulse Width Modulation (SVPWM) [25] is an advanced inverter modulation technique widely adopted in modern motor control due to its high DC bus voltage utilization and low harmonic distortion. The core principle of SVPWM involves mathematically transforming voltage signals from the three-phase stationary coordinate system into a rotating space vector. This transformation enables precise control of the output voltage by strategically sequencing the inverter’s switching states. The phase voltages of the three-phase stator windings, denoted as , , and , are given by:
where is the phase voltage amplitude. Based on the principle of voltage space vector synthesis, the resultant voltage vector can be derived as:
If the influence of stator resistance variation on voltage fluctuation is neglected, the relationship between the resultant stator voltage vector and the flux linkage space vector simplifies to:
3.1. Voltage space vector sectors
To enable rapid switching control of the inverter module, the switching function for a two-level inverter is defined as follows:
where the subscript corresponds to the three-phase legs. This configuration results in eight distinct switching state combinations for the inverter. Among these, six are non-zero vectors, whose corresponding voltage space vectors are given by:
where is the DC bus voltage, and , , are the switching states of the three-phase bridge legs.
A hexagon is formed by these six non-zero voltage space vectors, illustrated in Fig. 2. In the stationary - reference frame, the output voltage vector is decomposed into its components and . Three reference voltages (, , ) are calculated from these components as:
The sector of the voltage vector is determined using three logical variables , defined by:
The sector number is then calculated as . The corresponding relationship between the composite value of and the actual sector is provided in Table 3.
Fig. 2Voltage space vector sector diagram
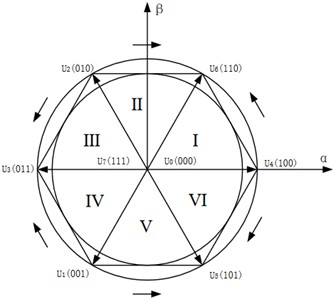
Table 3Correspondence between N and sectors
3 | 1 | 5 | 4 | 6 | 2 | |
Sector | Ⅰ | Ⅱ | Ⅲ | Ⅳ | Ⅴ | Ⅵ |
3.2. Space vector effective time
It can be seen from Fig. 3 that the target vector is located in a certain sector and can be expressed by a linear combination of two adjacent effective vectors and zero vectors. Taking 3 as an example, it can be obtained according to the principle of voltage space vector equivalence:
where , , and are the dwell times for the voltage vectors , , and , respectively, and are calculated as follows:
The relationship between the voltage components () in the stationary coordinate system and the applied voltage vectors with their dwell times is governed by the voltage-second balance principle:
where, and represent the active durations for the two adjacent active vectors used to synthesize the reference voltage in a given sector. The specific pair of adjacent vectors depends on the sector in which is located. The generalized expressions for calculating the absolute dwell times of these adjacent vectors across all sectors are:
The dwell times for the two active vectors and the zero vector in any given sector are provided in Table 4.
Fig. 3Voltage space vector synthesis coordinate system
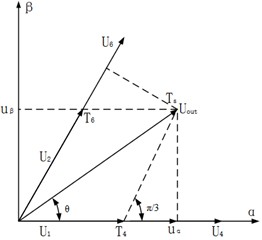
Table 4Starting time of each vector
1 | 2 | 3 | 4 | 5 | 6 | |
During the calculation process, if the sum exceeds the switching period , an overmodulation condition occurs. The dwell times must be adjusted to maintain correct voltage synthesis, as shown in Eq. (21):
3.3. Sector vector switching sequence
The switching time instants for the three-phase inverter, denoted as , , and , are defined through the intermediate time variables , , and , which are derived from the active vector dwell times. The mapping of these switching instants to the six sectors is summarized in Table 5. This completes the SVPWM control system model for the permanent magnet direct-drive motor, as illustrated in Fig. 4 and Fig. 5:
Fig. 4Permanent magnet direct drive motor SVPWM module
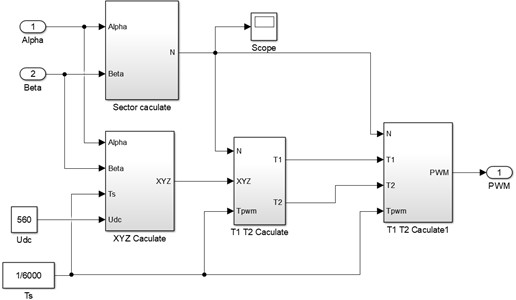
Fig. 5Overall control model of permanent magnet direct drive motor
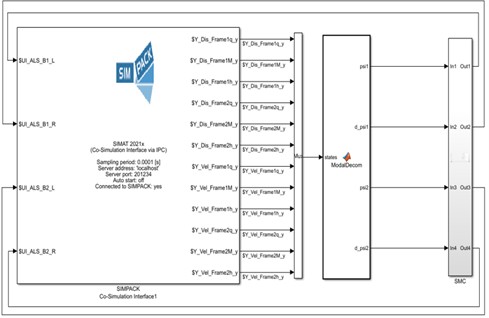
Table 5Switching points of each sector Tcm1, Tcm2, Tcm3
1 | 2 | 3 | 4 | 5 | 6 | |
4. Influence of motor control parameters
Dual-loop PI control is widely used in motor drive systems for precise regulation [26]. This strategy employs separate proportional-integral (PI) controllers for the inner current loop and the outer speed loop. The current loop responds rapidly to adjust motor torque by regulating the current, while the speed loop maintains a stable rotational speed under varying loads and external disturbances. To investigate the influence of the current loop gain and the speed loop gain on motor and vehicle vibration, a simulation was conducted over 30 s. The motor load torque was set to 9000 N·m from 0-10 s, 6000 N·m from 10-20 s, and 2000 N·m from 20-30 s. The control parameters were set as follows: , , , .
4.1. Impact on Motor Performance
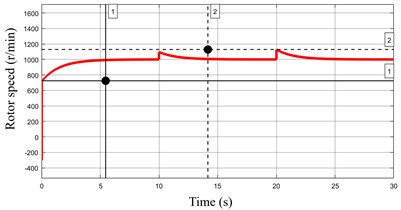
As shown in Fig. 6, when is reduced, the motor’s starting speed at 0 s drops from 724 r/min to 451 r/min, and the time required to reach the rated speed is shortened from 5.46 s to 3.96 s. Furthermore, the speed overshoot at 20 s increases from 1129.90 r/min to 1251.18 r/min. These results indicate that a lower value accelerates the system response but also exacerbates speed overshoot.
Fig. 6Speed of permanent magnet motor under different Kp1 parameter
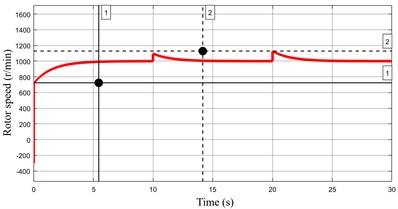
a)220
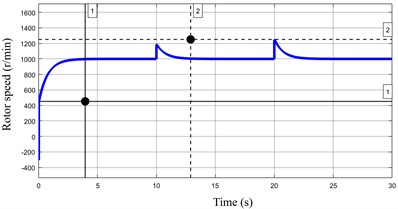
b)110
Fig. 7 shows the electromagnetic torque under the two parameter sets. The torque variation over a selected period at a load of 6000 N·m reveals that with the initial value, the torque fluctuates within a narrow range of 5903-6072 N·m. After reducing , the torque varies between 5897 and 6071 N·m. A comparison of the two states indicates that adjusting has a minor influence on the electromagnetic torque.
Under the same conditions, with held constant, a reduction in was observed to significantly impact motor speed, as shown in Fig. 8. The starting speed at 0 s dropped substantially from 724 r/min to 68 r/min, indicating a considerable slowdown in the system's response. Furthermore, when the load torque changed, the speed exhibited a large overshoot, peaking at 1478 r/min, which corresponds to an overshoot of 47.8 %. These results demonstrate that the speed loop gain has a more pronounced influence on both the response speed and the overshoot than the current loop gain .
The electromagnetic torque under the two parameter sets is shown in Fig. 9. After reducing , the torque exhibits significant harmonic oscillations at 10 s. These oscillations can induce severe motor disturbances during vehicle operation.
Fig. 7Electromagnetic torque of permanent magnet motor under different Kp1 parameter
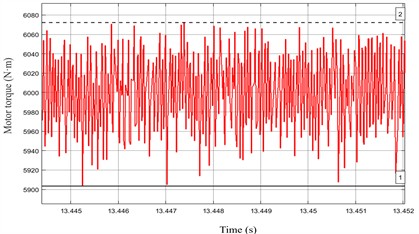
a)220
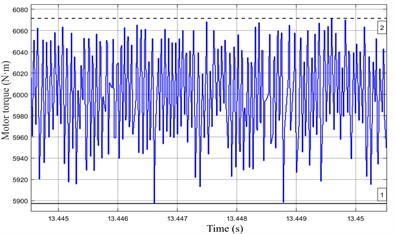
b)110
Fig. 8Speed of permanent magnet motor under different Kp2 parameter
a) 220
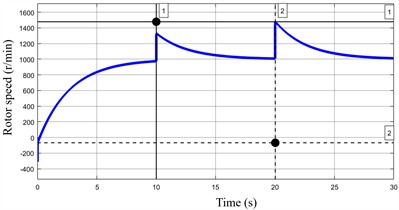
b)110
Fig. 9Electromagnetic torque of permanent magnet motor under different Kp2 parameter
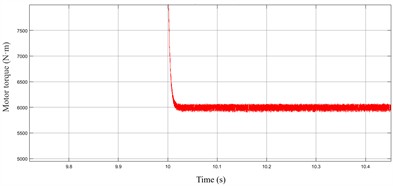
a)220
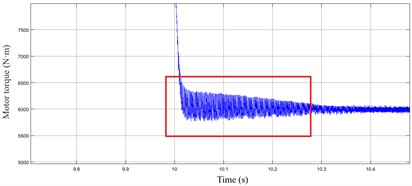
b)110
4.2. Impact on the vehicle system
The same operating condition was selected to compare the lateral and vertical vibration acceleration spectra of the permanent magnet motor and the bogie frame under different and parameters, as shown in Fig. 10. With the original parameters, the dominant frequencies of lateral vibration for both the motor and the bogie frame were concentrated at 4 Hz and in the 17-25 Hz range. After modifying and , the lateral vibration characteristics of the motor and bogie frame showed no significant changes. This indicates that the current loop and speed loop parameters have no substantial influence on the lateral vibration between the motor and the bogie frame.
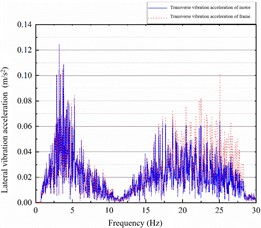
The dominant frequency of vertical vibration at the bogie frame end is minimal, with an amplitude not exceeding 0.02 m/s2. In contrast, the vertical vibration of the motor is concentrated in the 12-25 Hz range, with a peak acceleration amplitude of 0.63 m/s2. The current loop parameter shows no significant effect on the vertical vibration between the motor and the bogie frame. However, reducing the speed loop parameter excites vertical vibration at the bogie frame end.
Fig. 10The transverse vibration spectrum of the motor-frame under the original parameters
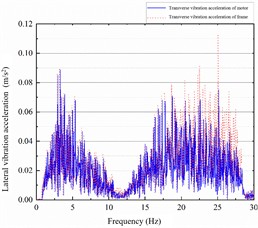
a)12, 220
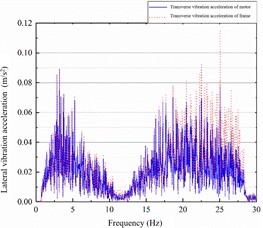
b)6, 220
c)12, 110
Fig. 11Spectrum of motor-frame lateral and vertical vibration under original parameters
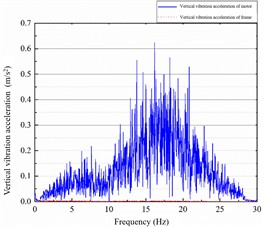
a)12, 220
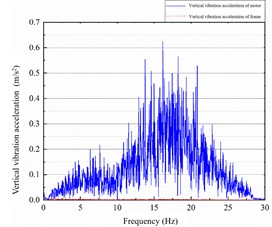
b)6, 220
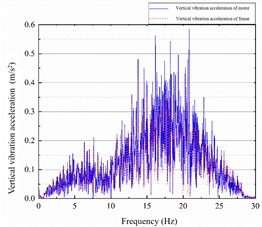
c)12, 110
As shown in Fig. 11, adjusting the current loop parameters has a negligible effect on the vibration transmissibility between the motor and the bogie frame. The transmissibility characteristics indicate that vibration is primarily transmitted from the bogie frame to the motor under both parameter sets. In contrast, after adjusting the speed loop parameters, vibration transmission from the motor to the bogie frame becomes dominant above 9.77 Hz. A significant difference in transmissibility is observed within the 9.77-13.47 Hz range. These results demonstrate that the speed loop parameters of the permanent magnet motor have a substantial influence on the overall vehicle vibration, whereas the current loop parameters have a minimal impact.
Fig. 12Spectrum of vertical acceleration of the front, middle and rear of the car body under 50 % Kp2 parameter
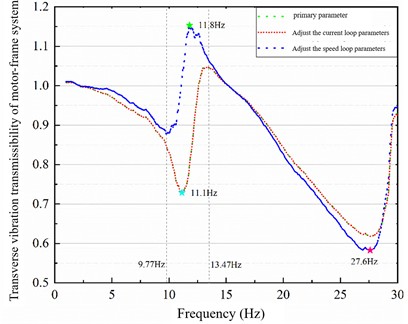
As shown in Fig. 12, the current loop parameters have no significant effect on the vibration transmissibility between the motor and the bogie frame. The transmissibility characteristics indicate that vibration is primarily transmitted from the frame to the motor under both parameter sets. In contrast, after adjusting the speed loop parameters, the motor becomes the dominant source of vibration transmitted to the bogie frame at frequencies above 9.77 Hz. A considerable difference in transmissibility is observed within the 9.77-13.47 Hz range. These results demonstrate that the speed loop parameters of the permanent magnet motor substantially influence the overall vehicle vibration, whereas the current loop parameters have a negligible effect.
“In summary, the speed loop gain exerts a more profound influence on both motor and vehicle dynamics than the current loop gain . Its reduction not only increases speed overshoot and torque harmonics but also excites vertical resonance in the motor-frame system. These findings underscore the necessity of co-optimizing control and mechanical parameters to mitigate electromechanical coupling vibrations”.
5. Dynamic characteristics of the vehicle system
To gain an in-depth understanding of the vibration characteristics of the high-speed train electromechanical coupling model, this section investigates the influence of different motor suspension parameters on vehicle system dynamics under traction, straight-line, and curved track conditions.
5.1. Traction condition
The simulation for the straight-line traction scenario initializes the vehicle speed at 0 km/h. The track irregularity is defined by the American Grade V spectrum, with the LMB10N wheel profile and CN60N rail. The target speed is set to 150 km/h. The vehicle's operational state during this phase is depicted in Fig. 13.
Fig. 13Vehicle acceleration time domain diagram. The vehicle starts and accelerates to 150 km/h
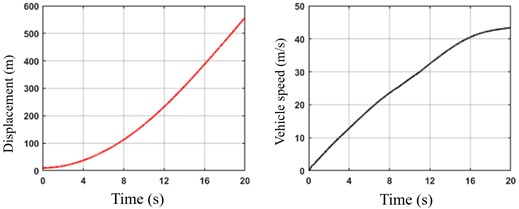
The simulation results indicate that the motor produces a high electromagnetic torque upon starting at 0 s, resulting in a rapid dynamic response. The motor speed reaches the target range within approximately 1 second. As the vehicle attains the target speed, the motor speed gradually stabilizes, and the electromagnetic torque fine-tunes to maintain the required level.
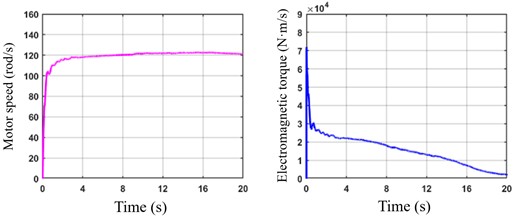
To evaluate the ride comfort and bogie safety of the permanent magnet direct-drive vehicle, the lateral and vertical vibration accelerations of both the car body and the bogie during the starting phase were analyzed. The measurement point for the car body was located on the cabin floor, 1 meter from the center of the front and rear bogies towards the vehicle's center. The bogie measurement points were positioned at the primary suspension locations of both bogies. The lateral and vertical vibration accelerations at the front, middle, and rear of the car body are shown in Fig. 14 and Fig. 15. The frequency-domain responses are obtained by applying the Fourier transform to the acceleration time-history signals; therefore, the vertical axis represents the acceleration amplitude at each frequency, and its unit remains m/s2.
Fig. 14Time-domain and spectral plots of front, middle and rear lateral vibration acceleration of the car body
The maximum absolute lateral vibration acceleration at the front and rear of the car body is 0.25 m/s2, which is approximately twice that measured at the middle section. The dominant frequency of lateral vibration across all three locations falls within the 3-15 Hz range, with a peak amplitude of 0.02 m/s2. For vertical vibration, the maximum absolute acceleration at the front and rear reaches 0.64 m/s2. The dominant vertical frequencies are also concentrated in the 3-15 Hz range, with a maximum amplitude of 0.06 m/s2.
Fig. 15Time-domain and spectral plots of front, middle and rear vertical vibration acceleration of the car body
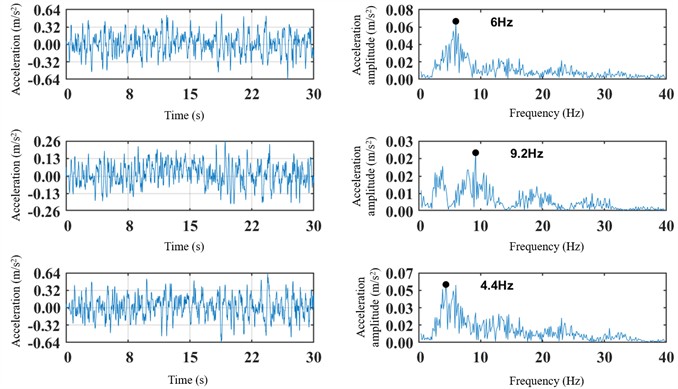
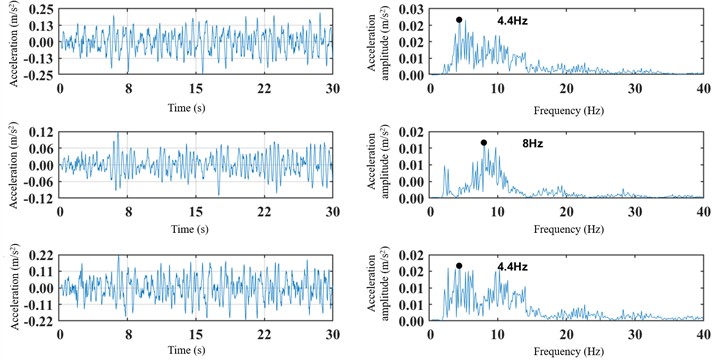
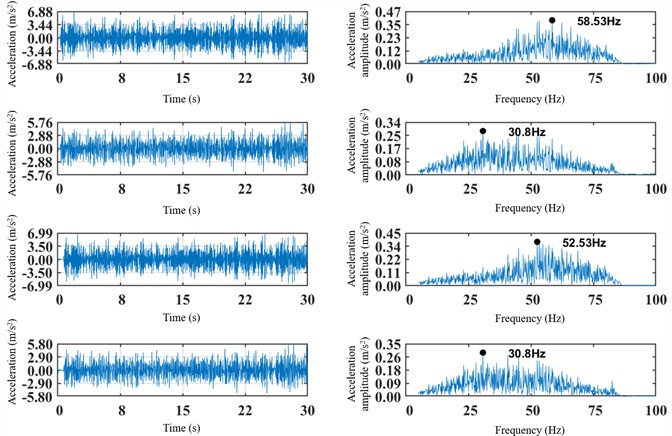
The vibration acceleration metrics for the right-front and left-rear positions of the front and rear bogies are shown in Fig. 16 and Fig. 17. The lateral vibration amplitude of the right-front axle box is generally greater than that of the left-rear position. The vibration at the right-front is concentrated in the 50-80 Hz range, whereas the left-rear vibration is primarily within 5-50 Hz. A comparison of the dominant frequencies at the front and rear ends indicates that the lateral vibration frequency is higher at the front of the bogie. Regarding vertical vibration, the dominant frequency at the front axle box is concentrated around 40-80 Hz, while the rear is around 10-60 Hz. The maximum amplitude is higher at the front than at the rear. Furthermore, the amplitude of the bogie instability acceleration at the front positions is generally 0.2 m/s2 larger than at the rear positions.
Fig. 16Time-domain and spectral plots of lateral vibration acceleration of the right front and left rear of the frame
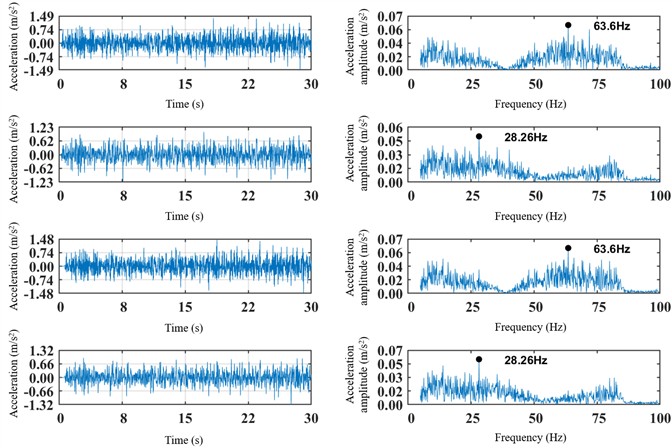
Fig. 17Time-domain and spectral plots of vertical vibration acceleration of the right front and left rear of the frame
Based on the analysis of vibration accelerations at corresponding locations on the car body and bogies, it can be preliminarily concluded that the vehicle’s ride comfort index meets the requirements for normal operation during acceleration to 150 km/h under the startup condition of the permanent magnet direct-drive motor.
5.2. Straight-line condition
Currently, operational permanent magnet direct-drive (PMDD) trains are primarily deployed on lines with speeds of 120 km/h or less. To evaluate their dynamic performance at medium to high speeds, simulations were conducted for the straight-line condition across a target speed range of 120 to 200 km/h. The simulation used the American Grade V track spectrum, LMB10N wheel profiles, and CN60N rails. The analysis focuses on the trends of key metrics – lateral wheel-rail force, derailment coefficient, wheel load reduction rate, and lateral ride index – with increasing speed, and compares the effects of different motor suspension stiffness values on vehicle dynamics.
Fig. 18Dynamic indicators under straight line conditions
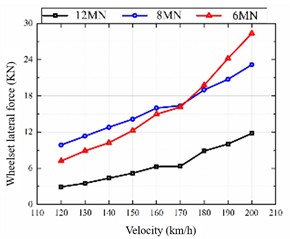
a) Wheelset lateral force
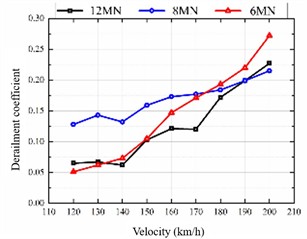
b) Derailment coefficient
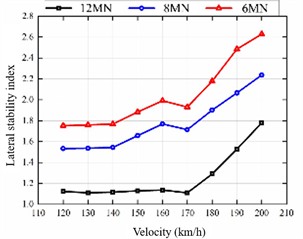
c) Lateral stability index
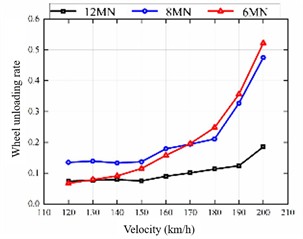
d) Wheel unloading rate
Fig. 18 reveals a clear positive correlation between speed and the values of lateral wheel-rail force, derailment coefficient, wheel load reduction rate, and lateral ride index. The suspension configuration with the lowest stiffness shows the most significant increase. Conversely, the high-stiffness configuration consistently yields lower levels of lateral force, derailment coefficient, and wheel load reduction throughout the tested speed domain, maintaining satisfactory stability at speeds exceeding 180 km/h. These results suggest that a higher motor suspension stiffness contributes positively to the system dynamics of high-speed trains, improving both safety and ride comfort.
5.3. Curved condition
The wheel-rail interaction and consequent dynamic behavior of a vehicle differ substantially during curve negotiation compared to straight-line running. To investigate this, three representative curve radii – 500 m, 1000 m, and 1500 m – were defined in accordance with the Chinese standard TB 10621-2014 (Code for Design of High Speed Railway). This configuration was utilized to assess the impact of motor suspension stiffness on vehicle performance. The simulation model incorporated LMB10N wheel profiles, CN60N rails, and American Grade V track spectrum excitations. This analysis examines how the key safety and ride metrics (lateral wheel-rail force, derailment coefficient, wheel load reduction rate, lateral ride index) vary with curve radius and how they are influenced by different motor suspension stiffness settings.
Fig. 19Dynamic indicators under curve conditions
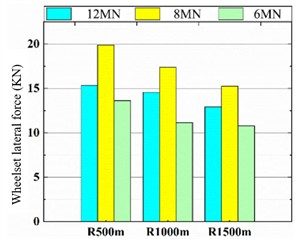
a) Wheelset lateral force
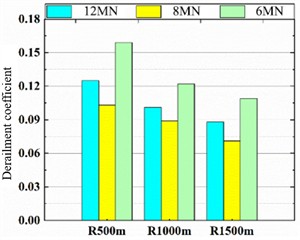
b) Derailment coefficient
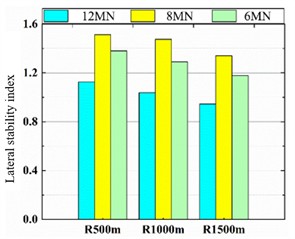
c) Lateral stability index
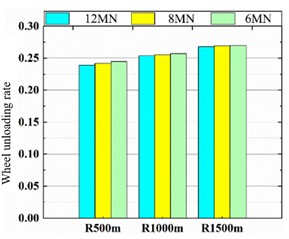
d) Wheel unloading rate
As shown in Fig. 19, the lateral wheel-rail force, derailment coefficient, and lateral ride index generally decrease as the curve radius increases, whereas the wheel load reduction rate shows an upward trend. The influence of suspension stiffness on lateral force and ride index runs counter to its effect on the derailment coefficient. Specifically, at a suspension stiffness of 8 MN/m, the lateral wheel-rail force and lateral ride index reach their maximum values, while the derailment coefficient is minimized. Conversely, a stiffness of 6 MN/m results in the minimum lateral force and ride index, but the maximum derailment coefficient.
The results indicate that vibration-energy distribution exhibits clear clustering within the 3-15 Hz band, corresponding to the primary suspension and car-body bending modes. The speed-loop controller introduces additional dynamic stiffness variation, which explains the resonance observed at 12-25 Hz in the motor-frame interaction. These mechanisms deepen the understanding of electromechanical coupling beyond traditional mechanical-only models.
6. Conclusions
This study develops a Simpack-Matlab co-simulation model for a permanent magnet direct-drive (PMDD) vehicle to investigate its dynamics at 120-200 km/h. The integrated electromechanical model analyzes the vehicle’s dynamic response and reveals the distinct effects of motor control parameters on both motor performance and overall vehicle behavior. The main findings are as follows:
1) The parameters of both the current and speed loops in the PM motor model significantly impact control performance. However, their influence on the resulting electromechanical coupling vibration differs markedly.
2) The current loop parameters have a negligible effect on both the lateral and vertical vibrations between the PM motor and the bogie frame. In contrast, the speed loop parameters notably alter the amplitude of the lateral vibration acceleration and can induce vertical resonance between the motor and the frame. They also increase the lateral vibration acceleration of the car body around 4 Hz. Therefore, the speed loop parameters are strongly correlated with vehicle vibration, while the current loop parameters have a minimal impact.
3) Dynamics simulation under a traction startup condition showed that the dominant frequencies of the car body's lateral and vertical vibrations are concentrated in the 3-15 Hz range. The maximum lateral and vertical accelerations were 0.25 m/s2 and 0.65 m/s2, respectively, indicating excellent ride comfort. Furthermore, research on motor suspension stiffness adaptability demonstrates that a stiffer suspension benefits the system dynamics of high-speed trains, enhancing both operational safety and ride quality.
Despite the comprehensive modeling and analysis, this study has certain limitations. The model assumes ideal track conditions and does not account for temperature effects on motor performance. Future work will incorporate more complex operational scenarios, such as varying track spectra and thermal coupling, and explore advanced control strategies like adaptive PI or model predictive control to further enhance system robustness.
This study focuses on simulation-based analysis to establish a theoretical foundation. Experimental validation is planned as the next phase of this research.
References
-
W. Zhai and C. Zhao, “Frontiers and challenges of sciences and technologies in modern railway engineering,” (in Chinese), Journal of Southwest Jiaotong University, Vol. 51, No. 2, pp. 209–226, Apr. 2016, https://doi.org/10.3969/j.issn.0258-2724.2016.02.001
-
J. Wang, C. Ren, Z. Liu, and M. Mao, “Research on direct drive technology of the permanent magnet synchronous motor for urban rail vehicles,” Mathematical Problems in Engineering, Vol. 2022, pp. 1–13, Dec. 2022, https://doi.org/10.1155/2022/8312121
-
P. Chen and Q. Luo, “Analysis of the development and application of the permanent magnet synchronous traction system at abroad,” (in Chinese), Foreign Rolling Stock, Vol. 54, No. 5, pp. 14–18, 2017, https://doi.org/10.3969/j.issn.1002-7610.2017.05.003
-
X. Zhang, “Development of direct drive bogies with permanent magnet motors at home and abroad,” (in Chinese), Electric Drive for Locomotives, Vol. 62, No. 3, pp. 1–7, May 2020, https://doi.org/10.13890/j.issn.1000-128x.2020.03.001
-
G. Ma et al., “Review on permanent magnet direct drive technology of railway vehicles,” (in Chinese), Journal of Traffic and Transportation Engineering, Vol. 21, No. 1, pp. 217–232, Feb. 2021, https://doi.org/10.19818/j.cnki.1671-1637.2021.01.010
-
D. Gu et al., “Vibration and noise performance analysis and optimal design of V-rotor in permanent magnet synchronous motor: a new strategy for high efficiency and low noise,” Journal of Vibroengineering, Vol. 27, No. 5, pp. 882–898, Aug. 2025, https://doi.org/10.21595/jve.2025.24851
-
Q. Shi, Y. Dong, B. Li, and C. Zhou, “Analysis of electromagnetic vibration and noise of permanent magnet synchronous motor based on field-circuit coupling,” Journal of Vibroengineering, Vol. 24, No. 6, pp. 1188–1199, Sep. 2022, https://doi.org/10.21595/jve.2022.22266
-
G. Xiao et al., “Design of elastic coupling for urban rail vehicle axle suspended permanent magnet direct drive motor,” (in Chinese), Electric Drive for Locomotives, Vol. 62, No. 3, pp. 18–22, May 2020, https://doi.org/10.13890/j.issn.1000-128x.2020.03.004
-
D. Hu et al., “Research and performance of permanent magnet direct drive bogie for B-type subway vehicles,” (in Chinese), Urban Rail Transit, Vol. 25, No. 7, p. 025, Jul. 2022, https://doi.org/10.16037/j.1007-869x.2022.07.007
-
Y. Chu, D. Hu, and L. Zhou, “Design and analysis of a new type of permanent magnet direct drive bogie for subway vehicles,” (in Chinese), Urban Rail Transit Research, Vol. 19, No. 6, pp. 6–11, Jun. 2016, https://doi.org/10.16037/j.1007-869x.2016.06.004
-
Y. Wang and K. Chen, “Contrast and analysis of dynamic performance of 200 km/h high-speed power cars with semi-body and flexible suspensions,” (in Chinese), Electric Drive for Locomotives, Vol. 62, No. 2, pp. 7–9, Mar. 2012, https://doi.org/10.13890/j.issn.1000-128x.2012.02.005
-
Y. Guo, J. Yang, and J. Wang, “Influence of body-suspended drive system on dynamic characteristics of high-speed trains,” (in Chinese), Urban Rail Transit Research, Vol. 28, No. 1, Feb. 2025, https://doi.org/10.16037/j.1007-869x.2025.01.005
-
Z. Feng, D. Hu, and Y. Chu, “Research on dynamic performance of direct-driven flexible bogie for permanent-magnetic synchronous motor,” Railway Locomotive and Car, Vol. 33, No. 3, pp. 73–76, Jun. 2013, https://doi.org/10.3969/j.issn.1008-7842.2013.03.17
-
J. Guo et al., “Vibration analysis of high-speed train considering suspended motor and car body flexibility,” (in Chinese), Journal of Chengdu Institute of Technology, Vol. 23, No. 4, pp. 1–6, Dec. 2020, https://doi.org/10.13542/j.cnki.51-1747/tn.2020.04.004
-
W. Xue et al., “Study on dynamic model for flexible frame bogie with PMSM,” (in Chinese), Journal of East China Jiaotong University, Vol. 30, No. 2, pp. 58–62, Apr. 2013, https://doi.org/10.3969/j.issn.1005-0523.2013.02.013
-
X. Wang, Y. Huang, and X. Zhang, “Influence of suspension parameters of flexible suspension motor on vibration performance of high-speed train,” (in Chinese), Mechanical Engineering and Automation, No. 5, pp. 21–24, 2016, https://doi.org/10.3969/j.issn.1672-6413.2016.05.008
-
Z. Xiao et al., “Bogie of fast passenger locomotive with frame suspended permanent magnet direct drive,” (in Chinese), Electric Locomotives and Mass Transit Vehicles, Vol. 45, No. 3, pp. 6–10, May 2022, https://doi.org/10.16212/j.cnki.1672-1187.2022.03.002
-
G. Li et al., “Research on the adaptability of motor elastic suspension to high-speed trains,” (in Chinese), Journal of Railway Science and Engineering, Vol. 20, No. 2, pp. 441–452, Jun. 2023, https://doi.org/10.19713/j.cnki.43-1423/u.t20220497
-
X. Ma et al., “Study on Dynamic Performance of Frame-mounted Permanent Magnet Direct-drive Bogie,” (in Chinese), Railway Locomotive and Car, Vol. 43, No. 5, pp. 143–150, Oct. 2023, https://doi.org/10.3969/j.issn.1008-7842.2023.05.23
-
X. Zhao et al., “Study on electromechanical coupling vibration of traction drive system of high-speed train and its influence factor,” (in Chinese), Journal of the China Railway Society, Vol. 41, No. 10, pp. 38–46, 2019, https://doi.org/10.3969/j.issn.1001-8360.2019.10.006
-
H. Zhu et al., “Influence of traction motor suspension parameters on vibration characteristics of high-speed train traction transmission components,” (in Chinese), Journal of Traffic and Transportation Engineering, Vol. 23, No. 1, pp. 156–169, Feb. 2023, https://doi.org/10.19818/j.cnki.1671-1637.2023.01.012
-
Y. Zeng et al., “Application of permanent magnet synchronous direct-drive traction system on Xuzhou metro line 1,” (in Chinese), Electric Drive for Locomotives, Vol. 65, No. 5, pp. 94–102, 2022, https://doi.org/10.13890/j.issn.1000-128x.2022.05.014
-
Y. Xu, Q. Li, and J. Xu, “Overview on permanent magnet synchronous motors traction system for urban rail rolling stock,” (in Chinese), Electric Machines and Control Application, Vol. 36, No. 5, pp. 7–10, May 2009, https://doi.org/10.3969/j.issn.1673-6540.2009.05.002
-
Y. Xu, X. Li, J. Liu, J. Liu, and G. Pan, “A multi-interaction electromechanical coupling dynamic model and lateral-torsional vibration mechanism of the propulsion shaft system,” Mechanical Systems and Signal Processing, Vol. 235, p. 112920, Jul. 2025, https://doi.org/10.1016/j.ymssp.2025.112920
-
J. Wang et al., “Fast SVPWM overmodulation algorithm based on 120° coordinate system,” (in Chinese), Electric Machines and Control, Vol. 25, No. 5, pp. 19–25, May 2021, https://doi.org/10.15938/j.emc.2021.05.003
-
Z. Song and S. Xia, “Design and simulation of the fuzzy PI control system for PMSM,” Modeling and Simulation, Vol. 13, No. 6, pp. 5849–5856, Jan. 2024, https://doi.org/10.12677/mos.2024.136533
About this article

This work was supported by the National Natural Science Foundation of China (Grant No. 52388102), (Grant No. 52272406), the Science and Technology Research and Development Program of China State Railway Group Co., Ltd. (Grant No. P2023J054), and the Jilin Provincial Innovation and Entrepreneurship Talent Program (Grant No. 2023QN09).
The datasets generated during and/or analyzed during the current study are available from the corresponding author on reasonable request.
Zunwei Feng: formal analysis, writing-original draft preparation. Jing Zeng: conceptualization, methodology, review and supervision, funding acquisition. Zhiyuan Hu: writing-review, editing and validation.
The authors declare that they have no conflict of interest.
