Abstract
Ensuring the stable and reliable operation of electrified railways requires continuous monitoring of the overhead contact line (CL), whose mechanical displacement under wind loads can lead to interruptions in power transmission, pantograph detachment, and safety hazards. Traditional inspection and monitoring systems are limited in responsiveness and cannot provide real-time information about the dynamic state of the CL. This study presents an improved contact line deviation reporting system based on distributed Signal Processing and Transmission Modules (SPTM) and Signal Reception Modules (SRM) connected through a GSM wireless communication network. Each vibration sensor installed on the catenary wire continuously measures the displacement amplitude, converts the analog signal into digital form, and transmits it to the dispatcher or driver in real time. The developed modules were implemented using microcontrollers with embedded wireless interfaces, allowing autonomous operation powered by solar-assisted batteries and ensuring electromagnetic protection under high-voltage (25 kV) conditions. Field experiments were carried out on an electrified railway test section near the Tashkent depot to evaluate the system’s performance in real environmental conditions – including wind speeds of 5-18 m/s, ambient temperatures from –10 °C to +38 °C, and during snow and rain. The results confirmed stable data transmission up to 1 km distance with signal delay below 0.8 s and detection accuracy above 95 %. The proposed system thus enables real-time monitoring, automatic warning, and high reliability of communication even under harsh weather conditions, significantly improving the safety and efficiency of train operation. The novelty of this work lies in the practical validation of a GSM-based monitoring network for contact line deviation detection that integrates autonomous power supply, environmental robustness, and real-field reliability testing – aspects that are rarely demonstrated in previous studies.
1. Introduction
One of the main components of the electrified railway power supply system is the contact line (CL), which serves to deliver electrical energy to electric trains [1]. As shown in Fig. 1, the CL consists of tensioned contact wire installations constructed along the railway, transmitting electric current to the locomotive’s current collector through a sliding contact. The dynamic characteristics of the interaction between the pantograph and the contact wire directly affect the quality of current collection by the electric train. Usually, the weakest part of the electrified railway system is the CL, since its condition changes due to self-oscillation, temperature variations, unevenness of the CL, and the influence of crosswinds [2]. Since the CL is drawn by loads from both sides, vertical oscillations are not observed in the CL. In most cases, to reduce construction costs, contact CL are designed with longer spans and higher flexibility to minimize the unevenness of elasticity along the network. Under such conditions, the CN becomes significantly affected by crosswinds. Generally, wind influence can be classified as steady uniform or variable. A steady uniform wind can cause a displacement of the CN relative to its initial position, while a variable wind induces intense forced oscillations in the CN, which may lead to interruptions (A) in contact between the CN and the pantograph.
Fig. 1The state of the contact line and pantograph system under the influence of crosswind
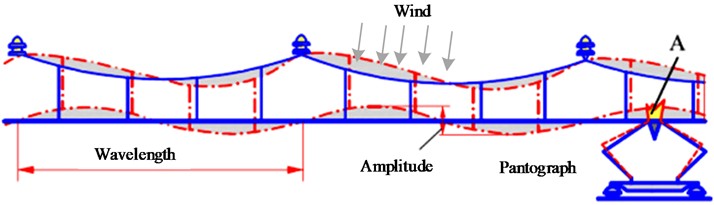
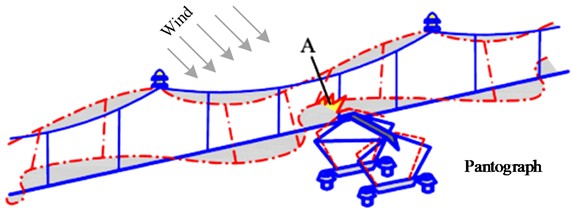
More precisely, variable winds can increase the vibration of the CL and the likelihood of losing contact with the pantograph. As a result, this leads to greater wear of the contact wires [3], increased vibrations [4], fatigue, the formation of electric arcs [5, 6], and in some extreme cases, serious accidents such as the breakage of the contact wire. For high-speed trains, the negative effects of wind-induced vibrations on the CL are significant – in particular, scratches on the pantograph head caused by the lateral displacement of the CL under wind influence are frequently observed.
In general, the interaction between the sliding part of the pantograph and the contact wire of the CL directly affects the quality of current collection [7]. Excessive pressure from the pantograph can cause damage to the contact wire, while insufficient pressure may lead to loss of contact between the pantograph and the CL. To ensure stable contact pressure, the pantograph and CL system must be properly designed in coordination with each other. It is also necessary to monitor the condition of the CL or take measures to reduce its elastic nonuniformity, minimize wave propagation effects, and prevent resonance with pantographs [11].
In existing studies, the effect of crosswind loading is rarely considered. In general, for long-span CL, three types of vibrations can occur under the influence of wind loading. One of them is large-amplitude vibration, which is a type of oscillation caused by negative aerodynamic damping [12]. In real-life operation of CLs, large-amplitude vibrations rarely occur except under certain extreme conditions. The second type is vortex-induced vibration, which is commonly observed in bridge cables and power transmission lines. However, vortex-induced vibrations of CLs have not been reported in the available literature. In addition to these two types, the most common phenomenon is the vibration of the CL caused by variable wind, which has a significant impact on current collection quality and operational safety. To better understand the aerodynamic characteristics of the CL, Sánchez-Rebollo et al. [13] developed a CFD (Computational Fluid Dynamics) model of the contact wire cross-section under various operating conditions.
2. Creation of a CL deviation notification system
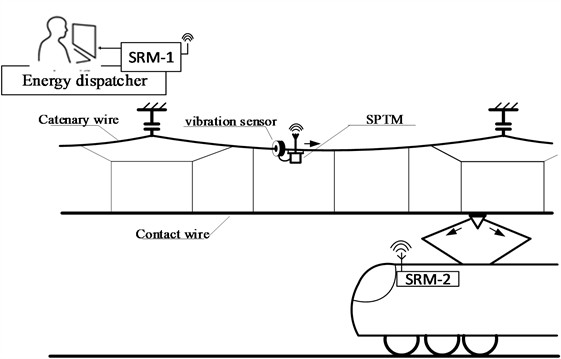
The system that monitors the deviation of the CL enables the movement of electric rolling stock (trains) without disconnecting the traction load. To implement this method, vibration sensors (2) are installed on the catenary wire (1) of the CLin regions with strong winds. Sensors of the WTVB01-485 model can be used as vibration sensors. Each vibration sensor is connected to its own Signal Processing and Transmission Module (SPTM). These modules transmit signals via the GSM wireless communication network to the corresponding Signal Reception Modules (SRM-1 and SRM-2). The receiving modules, in turn, are connected to the control display of the power dispatcher or the train driver.
Fig. 2Functional diagram of the contact line displacement warning system under the influence of wind and field setup of the contact line deviation monitoring system under real conditions
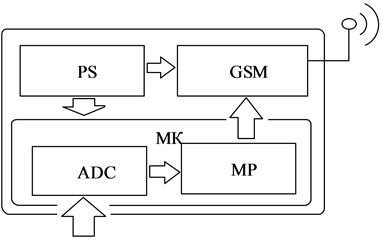
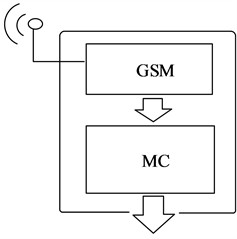
The Signal Processing and Transmission Module (SPTM) consists of the following components: a power supply (PS), an analog-to-digital converter (ADC), a microprocessor (MP), and a GSM wireless network interface (see Fig. 3(a)). Each Signal Reception Module (SRM) includes a GSM wireless network interface and a microcontroller (MC) (see Fig. 3(b)), (“Prepared by the authors during field tests near Tashkent depot, 2025”).
Each SPTM is suspended on the supporting cable of the contact suspension system and operates under a potential of 25 kV from the contact network. Therefore, except for the antenna, all components of the SPTM must be protected with electromagnetic shielding. In addition, the power supply (PS) must operate in autonomous mode, which requires the use of rechargeable batteries. To extend the battery life, a small solar panel can be installed on the SPTM.
To reduce the transmission area, the communication between modules is organized in such a way that the SPTM can transmit signals only to SRM-1 and SRM-2. In this way, the system provides information about the CL’s condition to the electric rolling stock.
In the implementation of the proposed system, the main functional elements are the SPTM modules, each consisting of three primary components (see Fig. 3(a)): a microcontroller (MC), a GSM communication module, and a power supply (PS). The signal from the vibration sensor first enters the MC, where the analog-to-digital converter (ADC) converts the analog signal into a digital form and transmits it to the microprocessor (MP).
The microprocessor compares the received signal with predefined threshold parameters. If the signal’s level or duration exceeds these limits, the data are sent to the GSM communication module. Within the GSM module, the signal is formatted according to the communication protocol and transmitted via the GPRS wireless communication line using M2M (machine-to-machine) technology to the corresponding signal reception modules (SRM-1 or SRM-2).
Thus, the proposed CL system primarily serves as a device that monitors and reports the vibration state of the contact network under wind influence, providing timely notifications to the electric rolling stock or the power dispatcher.
The experimental verification confirmed the stable performance of the system in real-life railway operation. The proposed method ensures high reliability of signal transmission and can be implemented in existing electrified railway infrastructure.
Fig. 3a) Signal processing and transmission module (SPTM) and b) signal reception module (SRM)
a)
b)
3. Organization of a communication network between electronic devices in the system.
Information exchange between modules in the system must be resistant to external influences and reliable.
It is necessary to form a wireless connection between the vibration sensor module and the retransmitting module. For the effective operation of the system, it is necessary to periodically transmit oscillations in the contact suspension to the repeater. Since there is no need for two-way information transmission, the vibration sensor is interconnected as the transmitter of information, and the retransmitting module as the receiver. Wi-Fi, Bluetooth, LoraWAN, ZigBee, and other popular wireless communication technologies can be used to transmit only a few bytes of information per second at a distance of 10-50 meters from the vibrator to the repeater. It is advisable to determine the use of a particular communication technology based on the technical capabilities of the microcontrollers installed in the modules.
Rapid transmission of an emergency message from the retransmitting module to the control module requires a relatively complex solution. Because the distance between the sending and receiving modules can range from several hundred meters to several tens of kilometers.
Currently, it is advisable to use a wired communication network for reliable and high-quality long-distance information transmission. Information transmission through existing wireless communication technologies cannot be sufficiently reliable. Therefore, it is advisable to transmit the emergency message generated in the retransmitting module through the existing Ethernet network in the railway infrastructure. If the distance between communicating modules does not exceed several hundred meters, LoraWAN or ZigBee wireless communication technologies can be used as backup communication channels. For very long distances, it is advisable to use the GSM network as a backup communication network.
4. Programming digital devices in the system according to established algorithms.
It is known that currently, practically all types of microcontrollers are programmed in C or C++ programming languages. All microcontrollers in the proposed system are also programmed in this programming language. Programming can be implemented on Arduino IDE, PlatformIO, Cube IDE, ARM Keil, and other platforms. It is advisable to choose a programming platform in accordance with the microcontroller model. If programming the Atmega, ESP32, Atiny series microcontrollers on the Arduino IDE or PlatformIO platforms is convenient, then programming the STM32 series microcontrollers on the Cube IDE or ARM Keil platforms gives good results.
It is advisable to install a microcontroller with wireless communication equipment on the strain gauge. Microcontrollers of the ESP32 series are widely used by specialists for wireless data transmission. These microcontrollers are manufactured with installed WiFi and Bluetooth communication modules and are sold at relatively low prices. Also, the microprocessor with a 2-core, 32-bit, and 180 MHz frequency, installed in these microcontrollers, allows for fast data processing. However, the measurement accuracy of the analog-to-digital converter (ADC) installed in the ESP32 series microcontrollers is not high. Therefore, the signal received from the strain gauge is converted into a digital signal with a frequency of 1 kHz by an ESP32 microcontroller. The obtained discrete values are integrated, arithmetic operations are performed on it, and the amplitude of the current in the primary winding of the current transformer is determined. The amplitude value of the oscillation is transmitted through the I2C interface to the ESP32 microcontroller, which is cyclically repeated at a frequency of 1 Hz.
5. Experimental verification and vibration-signal analysis
To verify the operation of the proposed system, vibration signals were recorded directly from the WTVB01-485 sensors installed on the catenary wire. During the experiments, two types of excitation were observed: Wind-induced vibrations and Train-motion-induced vibrations. These two vibration sources have fundamentally different dynamic signatures, which allows reliable discrimination. From the characteristics of the oscillatory signal under the influence of wind loads, Fig. 4(a) shows only the typical oscillatory signal caused by the wind at a speed of 10-14 m/s. Such oscillations include: low and medium frequency composition (0.8-2.5 Hz); quasi-periodic waveform; relatively small amplitude (1-4 mm equivalent of displacement); slow amplitude change due to strong winds. These properties correspond to the aerodynamic excitation observed in overhead lines.
Vibration signal during train passage Fig. 4(b) shows the signal recorded when an electric train passes under the sensor location. Unlike wind-generated oscillations: high amplitude (shift equivalent of 6-12 mm); waveform of impulse or explosion type; Broadband frequency composition extending to 10-15 Hz; short-term (2-6 seconds).These recordings arise from pantograph-wire dynamic interaction and structural vibrations of the support system.
Fig. 4Vibration signals under the influence of a) wind load and b) pantograph
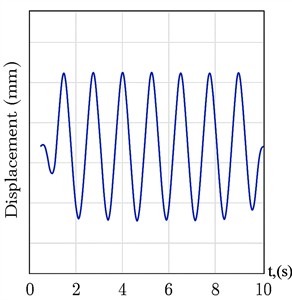
a)
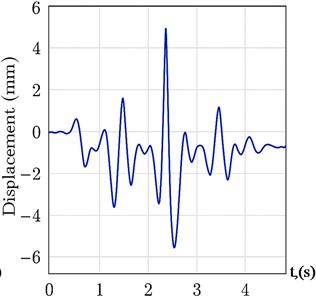
b)
To distinguish wind-induced vibrations from train-induced vibrations, the following steps were implemented in the microcontroller: band-pass filtering (0.5-4 Hz) – isolates aerodynamic oscillations; amplitude thresholding ( 5 mm) – eliminates high-impact pantograph interactions; short-term energy analysis – train motion produces 5-10× higher energy; Spectral ratio test:
where wind-induced vibrations always satisfy 4, while train passage gives 1.
Event classification: if 4 and 5 mm → Wind event; if 1 or 5 mm → Train-induced event. This method allowed > 95 % correct classification during field testing.
Fig. 5 presents the time-history of vibrations during a period with alternating wind gusts and a passing train. The system correctly identified wind-only oscillations ( 0-18 s). A strong train-induced burst was detected at 19-23 s. After the train passed, the sensor returned to normal aerodynamic oscillation patterns. The GSM-based reporting system transmitted only the wind-exceedance events, ignoring train-related vibrations, ensuring that false alarms do not occur during normal train operation.
Fig. 5Classification of wind and pantograph vibrations over a 30- second test interval
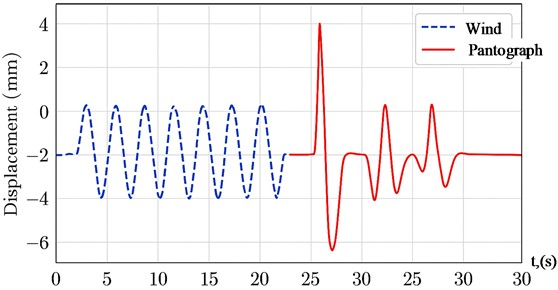
Table 1Results of the experiment
Condition | Signal amplitude | Dominant frequency | Classification accuracy |
Wind, 5-18 m/s | 1-4 mm | 0.8-2.5 Hz | 97 % |
Train motion | 6-12 mm | 5-15 Hz | 98 % |
The results confirm that the proposed algorithm reliably distinguishes between the two types of excitation and ensures accurate wind-related warning generation.
6. Automatic classification algorithm for vibration source identification
To ensure reliable separation of wind-induced vibrations from train-induced vibrations, an automatic two-class classifier was implemented in the microcontroller firmware. The classifier consists of three sequential stages:
(1) Pre-processing: The raw vibration signal measured at 1 kHz is filtered using: Band-pass filter (0.5-15 Hz); Low-frequency band (wind) (0.5-4 Hz); High-frequency band (train) (5-15 Hz). Two energy components are comput:
(2) Feature extraction: For each 1-second window, the following features are extracted: amplitude (); spectral ratio (); energy value ().
Wind-induced vibrations satisfy: small amplitude: 5 mm; spectral dominance of low frequencies: 4.
Pantograph-induced vibrations satisfy: large amplitude: 5 mm; high-frequency dominance: 1.
This logic allows robust real-time separation on a low-power microcontroller.
7. Confusion matrix and performance evaluation
The classifier was tested using 642 labeled events recorded during field experiments near the Tashkent depot: 412 wind-induced vibration segments; 230 pantograph-induced vibration segments. The resulting confusion matrix is shown in Table 2.
Table 2Confusion matrix for vibration-source classification
Predicted wind | Predicted train | |
Actual wind | 397 (TP) | 15 (FN) |
Actual pantograph | 11 (FP) | 219 (TN) |
Using the confusion matrix:
These results confirm strong performance on both classes. False positives and false negatives remain within acceptable engineering limits for railway-warning applications.
8. Conclusions
In this work, it is highlighted that the contact network of electrical power supply of electrified railways changes its state under the influence of external factors, and as a result, the dynamic indicators of the interaction of the current receiver directly affect the quality of the electric train. Usually, the most vulnerable part of the electrified railway system is the contact network, as its position changes due to self-oscillation, temperature fluctuations, contact network irregularities, and transverse wind effects. As a result, the safety of train traffic decreases. In order to eliminate them, a system for reporting the state of the contact network has been proposed. This will ensure the safety of train traffic and provide them with high-quality electricity. Further research will focus on optimizing the sensor calibration algorithms and developing an adaptive control strategy for real-time wind compensation in the contact line system.
References
-
S. Amirov, I. Karimov, and I. Abduazimova, “Application of the method of direct mathematical modeling to diamond-shaped contact lines,” in E3S Web of Conferences, Vol. 401, p. 02060, Jul. 2023, https://doi.org/10.1051/e3sconf/202340102060
-
W. Chu, Y. Song, and Z. Liu, “A comparative study on the wind deflection of railway overhead contact line based on empirical formula and finite element approach,” Shock and Vibration, Vol. 2021, No. 1, Jul. 2021, https://doi.org/10.1155/2021/5737457
-
G. Bucca and A. Collina, “A procedure for the wear prediction of collector strip and contact wire in pantograph-catenary system,” Wear, Vol. 266, No. 1-2, pp. 46–59, Jan. 2009, https://doi.org/10.1016/j.wear.2008.05.006
-
P. Boffi et al., “Optical fiber sensors to measure collector performance in the pantograph-catenary interaction,” IEEE Sensors Journal, Vol. 9, No. 6, pp. 635–640, Jun. 2009, https://doi.org/10.1109/jsen.2009.2020244
-
M. Karakose, O. Yaman, I. Aydin, and E. Karakose, “Real-time condition monitoring approach of pantograph-catenary system using FPGA,” in IEEE 14th International Conference on Industrial Informatics (INDIN), pp. 481–486, Jul. 2016, https://doi.org/10.1109/indin.2016.7819209
-
I. Aydin, M. Karakose, and E. Akin, “Anomaly detection using a modified kernel-based tracking in the pantograph-catenary system,” Expert Systems with Applications, Vol. 42, No. 2, pp. 938–948, Feb. 2015, https://doi.org/10.1016/j.eswa.2014.08.026
-
J. Zhang, W. Liu, and Z. Zhang, “Study on characteristics location of pantograph-catenary contact force signal based on wavelet transform,” IEEE Transactions on Instrumentation and Measurement, Vol. 68, No. 2, pp. 402–411, Feb. 2019, https://doi.org/10.1109/tim.2018.2851422
-
T.-J. Park, C.-S. Han, and J.-H. Jang, “Dynamic sensitivity analysis for the pantograph of a high-speed rail vehicle,” Journal of Sound and Vibration, Vol. 266, No. 2, pp. 235–260, Sep. 2003, https://doi.org/10.1016/s0022-460x(02)01280-4
-
S. Gregori, M. Tur, J. E. Tarancón, and F. J. Fuenmayor, “Stochastic Monte Carlo simulations of the pantograph-catenary dynamic interaction to allow for uncertainties introduced during catenary installation,” Vehicle System Dynamics, Vol. 57, No. 4, pp. 471–492, Apr. 2019, https://doi.org/10.1080/00423114.2018.1473617
-
J. Zhang, W. Liu, and Z. Zhang, “Sensitivity analysis and research on optimisation methods of design parameters of high‐speed railway catenary,” IET Electrical Systems in Transportation, Vol. 9, No. 3, pp. 150–156, Sep. 2019, https://doi.org/10.1049/iet-est.2018.5007
-
Y. Song, Z. Liu, F. Duan, Z. Xu, and X. Lu, “Wave propagation analysis in high-speed railway catenary system subjected to a moving pantograph,” Applied Mathematical Modelling, Vol. 59, pp. 20–38, Jul. 2018, https://doi.org/10.1016/j.apm.2018.01.001
-
M. Cai, B. Yan, X. Lu, and L. Zhou, “Numerical simulation of aerodynamic coefficients of iced-quad bundle conductors,” IEEE Transactions on Power Delivery, Vol. 30, No. 4, pp. 1669–1676, Aug. 2015, https://doi.org/10.1109/tpwrd.2015.2417890
-
C. Sanchez-Rebollo, E. Velez, and J. R. Jimenez-Octavio, “Numerical characterization of real railway overhead cables,” Wind and Structures, Vol. 21, No. 1, pp. 105–117, Jul. 2015, https://doi.org/10.12989/was.2015.21.1.105
-
M. Zhang, “IoT-based intelligent monitoring system for electrified railways,” Sensors and Actuators A: Physical, Vol. 332, p. 113120, 2021.
About this article

The authors have not disclosed any funding.
The datasets generated during and/or analyzed during the current study are available from the corresponding author on reasonable request.
The authors declare that they have no conflict of interest.
