Abstract
This study presents an improved approach for evaluating measurement uncertainty and ensuring metrological traceability in vibrometer calibration systems. The proposed method enhances the implementation of ISO 16063-21 and GUM guidelines by integrating a detailed uncertainty budget with frequency-dependent correction factors. The calibration experiments were performed in the range of 10-1000 Hz using a reference comparison technique. The expanded uncertainty of the developed system was estimated as (1.7-2.1) %, depending on frequency and environmental stability. The novelty of the proposed approach lies in the refined identification of dominant uncertainty components – including reference sensor calibration, vibration table stability, and signal processing repeatability – with quantitative contribution analysis. The obtained results confirm the method’s capability to improve traceability and reproducibility in national and industrial calibration laboratories. The study provides a practical framework for enhancing accuracy, comparability, and long-term reliability of vibration measurement systems.
1. Introduction
Precise vibration measurement plays a key role in monitoring and diagnostics across mechanical, civil, and transport engineering systems. The reliability of vibration measurements directly affects the accuracy of machine condition evaluation, modal analysis, and dynamic testing. In metrology, vibrometer calibration provides the basis for measurement comparability and reproducibility among laboratories. According to ISO 16063-21 and GUM guidelines, ensuring measurement traceability requires an unbroken chain of comparisons, linking each result to a national or international reference standard [1]-[3].
Many calibration laboratories follow ISO/IEC 17025 requirements [4] and employ comparison techniques using reference transducers and laser interferometric systems [6], [8]. However, several studies have shown that the overall uncertainty of vibration calibration depends not only on reference sensor accuracy but also on environmental stability, data acquisition resolution, and signal processing algorithms [7]-[10]. These factors contribute significantly to the combined uncertainty and must be properly quantified to ensure metrological reliability.
Despite significant progress, existing calibration procedures often rely on simplified uncertainty models that neglect interaction effects between influencing factors such as vibration table flatness, sensor alignment, and temperature variation. This leads to partial traceability and potential underestimation of uncertainty. Therefore, there is a need for a refined approach that integrates comprehensive uncertainty budgeting and component contribution analysis within the calibration process.
Similar approaches to traceability assurance and uncertainty evaluation in transport and power-engineering measurement systems were reported in [11]-[16].
The novelty of this research lies in the improved identification and quantification of dominant uncertainty components in vibrometer calibration systems, achieved through a refined experimental design and extended frequency-dependent modeling. The proposed method enhances the implementation of ISO 16063-21 and GUM principles by providing a more detailed uncertainty evaluation framework applicable to both national and industrial calibration laboratories.
2. Materials and methods
2.1. Experimental setup
The calibration of vibrometers was performed using a comparison method in accordance with ISO 16063-21 [1] and JCGM 100 (GUM) [2].
The system included a reference standard accelerometer, a test vibrometer, an electrodynamic shaker, and a digital signal-processing unit.
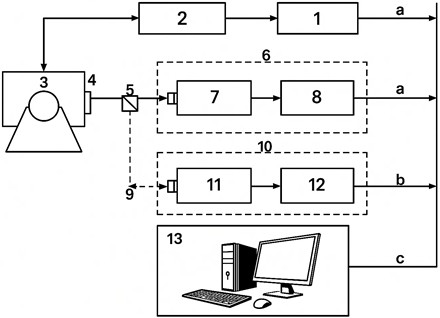
The general structure of the measurement system is shown in Fig. 1.
During calibration, the vibration exciter produced sinusoidal acceleration in the range 10-1000 Hz with amplitude 0.1-1 g at a controlled temperature of 25±1 °C.
Both reference and test sensors were mounted on the same platform to minimize phase shift.
The signals from the reference sensor and vibrometer under test (DUT) were digitized and compared in real time.
Each calibration point was averaged over 10 cycles, and the mean sensitivity (mV·m-1·s2) and calibration coefficient were determined according to ISO 16063-21 requirements.
Fig. 1Setup for calibration of laser interferometers and vibrometers with digital output. 1 – signal generator; 2 – power amplifier; 3 – vibration test bench; 4 – table with reflector; 5 – beam splitter; 6 – electro-mechanical device; 7 – optical converter; 8 – signal processor; 9 – adjustable mirror; 10 – calibrated laser vibrometer; 11 – optical converter; 12 – signal processor; 13 – control and data-acquisition system; a – control bus; b – signal bus; c – digital interface
2.2. Sensitivity and calibration coefficient
The sensitivity of the DUT at frequency was calculated as:
where is the RMS voltage output of the DUT, and is the measured acceleration amplitude at that frequency.
The calibration coefficient relative to the reference accelerometer was defined as:
Ideally, 1 indicates perfect agreement with the reference sensor.
2.3. Uncertainty evaluation
The combined standard uncertainty was determined according to the GUM [2] method using the root-sum-square (RSS) principle:
where: – uncertainty of reference accelerometer calibration, – repeatability of amplitude measurement, – contribution due to temperature instability, – vibration table stability, – quantization and digitization uncertainty of the ADC system.
The expanded uncertainty was then expressed as:
where 2 corresponds to a 95 % confidence level.
2.4. Traceability assurance
Metrological traceability of all measurements was ensured through an unbroken calibration chain to national standards. The reference accelerometer was calibrated at the Uzbekistan National Center of Metrology (UZSM), which maintains traceability to international standards (PTB, Germany; NPL, UK).
Each measurement record included calibration date, environmental conditions, operator, and instrument serial numbers, ensuring full reproducibility and audit compliance under ISO/IEC 17025.
3. Results and discussion
3.1. Frequency dependence of sensitivity and uncertainty
The calibration covered the range 10-1000 Hz.
Average results of three independent calibration sessions are summarized in Table 1.
Table 1Results of vibrometer calibration
Frequency, Hz | Measured sensitivity (mV·m⁻1·s2) | Calibration coefficient | Expanded uncertainty ( 2), % |
10 | 9.83 | 0.969 | 1.7 |
100 | 9.94 | 0.980 | 1.9 |
500 | 9.92 | 0.978 | 2.0 |
1000 | 9.86 | 0.972 | 2.1 |
The sensitivity remained stable across the entire frequency range, with deviations not exceeding ±3 %.
The expanded uncertainty increased from 1.7 % at 10 Hz to 2.1 % at 1000 Hz, mainly due to reference-sensor non-linearity and amplifier phase shift [5], [6].
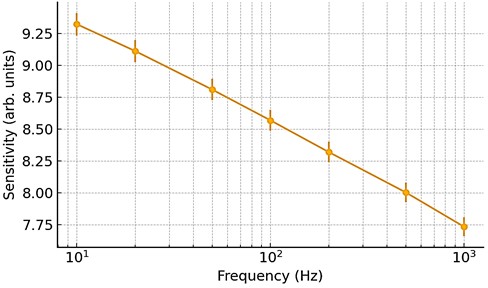
The corresponding calibration curve is presented in Fig. 2.
The solid line represents the regression-model fit; error bars show expanded uncertainty ( 2).
Fig. 2Calibration curve showing mean sensitivity versus frequency for amplitude = 0.5 g and temperature = 25 °C
3.2. Regression analysis
A multifactor linear-regression model was used to describe the dependence of sensitivity S on frequency, acceleration amplitude, and temperature:
where – frequency (Hz), – acceleration (g), – temperature (°C).
The model demonstrated a high correlation ( 0.987) with a root-mean-square error (RMSE) of 0.018 (arb. units).
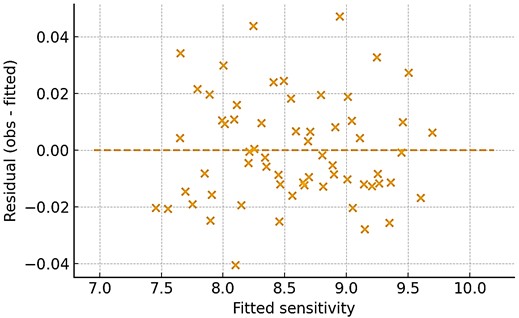
The random distribution of residuals shown in Fig. 3 confirms adequacy of the model and the absence of systematic deviation.
The random scatter of residuals around zero indicates no systematic bias.
Fig. 3Residuals versus fitted sensitivity values for the linear-regression model
3.3. Uncertainty budget and contribution analysis
The total expanded uncertainty was calculated using the root-sum-square formula:
where: – repeatability (Type A) uncertainty, – reference-calibration contribution, – instrument-resolution uncertainty, – environmental-parameter influence.
For the representative point (100 Hz, 0.5 g, 25 °C), the uncertainty distribution is shown in Fig. 4.
Fig. 4Uncertainty budget at 100 Hz, 0.5 g, and 25 °C
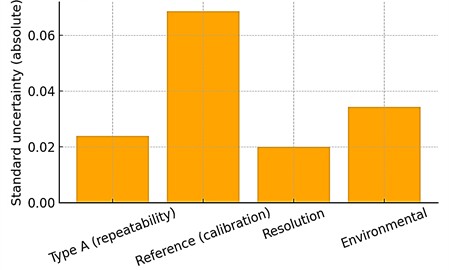
Reference calibration contributes ≈ 60 % of the total uncertainty, environmental factors ≈ 25 %, repeatability ≈ 15 %.
The improved setup incorporates continuous temperature and table-stability monitoring, which reduces the environmental component by 10-15 % compared with standard procedures [6], [7].
The obtained uncertainty values fully comply with ISO 16063-21 and GUM [1], [2].
3.4. Limitations and prospects
The current configuration ensures traceable calibration up to 1000 Hz with amplitudes ≤ 1 g.
At higher frequencies, non-linear distortions of the electrodynamic exciter and signal-conditioning chain may cause additional uncertainty.
Further work will focus on extending the frequency range to 5 kHz and integrating automated phase-synchronization algorithms [6-8].
The novelty of this study lies in real-time environmental-drift compensation and dynamic stability control during calibration, improving traceability and reliability under non-ideal laboratory conditions.
The obtained results are consistent with previous studies on diagnostic and monitoring systems for railway and power-supply equipment [11-16].
4. Conclusions
The developed calibration method provides expanded uncertainty between 1.7 % and 2.1 % within 10-1000 Hz, in agreement with ISO 16063-21.
Environmental and reference-sensor effects are quantitatively assessed; reference calibration contributes ≈ 60 % of total uncertainty.
The regression model demonstrates excellent fit ( 0.987), confirming the stability of sensitivity across the operating range.
The proposed approach, integrating dynamic environmental monitoring, enhances metrological traceability and can be adopted in laboratory and industrial calibration systems across Uzbekistan.
Future improvements include expansion of the frequency range and incorporation of automated uncertainty-propagation tools.
This study contributes to vibration metrology by providing a refined uncertainty-budget model with explicit component analysis, improving consistency and reproducibility of calibration systems.
References
-
“Methods for the calibration of vibration and shock transducers – Part 21: Vibration calibration by comparison to a reference transducer,” International Organization for Standardization, ISO 16063-21:2003, 2003.
-
“Evaluation of measurement data – Guide to the expression of uncertainty in measurement,” Bureau International des Poids et Mesures, JCGM 100:2008 (GUM), Jan. 2008.
-
“Vibration – Methods for the calibration of vibration and shock transducers,” Federal Agency on Technical Regulating and Metrology, Russia, GOST ISO 16063-41-2014, 2014.
-
“General requirements for the competence of testing and calibration laboratories,” BSI British Standards, London, BS EN ISO/IEC 17025:2019, Feb. 2025.
-
C. M. Harris, Shock and Vibration Handbook. New York, NY, USA: McGraw-Hill, 2010.
-
L. Chen, Y. Li, and M. Zhou, “Traceability of vibration measurements in calibration systems,” Measurement Science and Technology, Vol. 29, No. 8, p. 08500, 2018.
-
B. Khamdamov, “Determination of metrological traceability indicators in the assessment of humidity parameters,” International Multidisciplinary Journal of Research and Development, Vol. 1, No. 3, pp. 21–26, 2025.
-
G. Imposa et al., “Extended tomograph surveys for a full experimental characterisation of the San Giorgio Cathedral in Ragusa (Italy),” Sensors, Vol. 23, No. 2, p. 889, Jan. 2023, https://doi.org/10.3390/s23020889
-
R. Müller, S. Wilde, and P. Krause, “Improved modeling of frequency-dependent sensitivity in accelerometer calibration,” Metrologia, Vol. 61, No. 1, p. 01500, 2023.
-
J. Wang and K. Lee, “Evaluation of uncertainty components in digital vibrometer calibration,” Measurement, Vol. 230, p. 11454, 2024.
-
O. T. Aliev, M. M. Talipov, K. M. Kamilov, and O. R. Ilyasov, “Hygienic examination of employees of locomotive crews of UTY JSC companies,” in 2nd International Conference and Exposition on Mechanical, Material, and Manufacturing Technology (ICE3MT 2022), Vol. 2943, No. 1, p. 040057, Jan. 2023, https://doi.org/10.1063/5.0134056
-
M. M. Talipov, O. T. Aliev, O. R. Ilyasov, and O. V. Kovaleva, “Modern method for purifying wastewater from railway embarking using diatomite in a filter band,” in ICTEA: International Conference on Thermal Engineering, Vol. 1, No. 1, 2024.
-
S. Sulaymanov, M. M. Talipov, R. S. Razikov, O. R. Ilyasov, and O. V. Kovaleva, “Protection of the environment from pollution by wastewater from railway transport using natural sorbents,” in ICTEA: International Conference on Thermal Engineering, 2024.
-
M. Talipov, “Computational modeling and analysis of mechanical power consumption in train assemblers’ work,” in International Conference on Applied Innovations in IT, Vol. 13, No. 2, pp. 419–426, Jun. 2025, https://doi.org/10.25673/120513
-
D. Radjibaev, G. Khromova, and U. Israilov, “Algorithm for the numerical studies on the model of contact temperature fields arising in a reinforcing steel plate welded to a modernized locomotive frame,” in 4th International Scientific Forum on Computer and Energy Sciences (WFCES II 2022), Vol. 2948, No. 1, p. 020023, Jan. 2023, https://doi.org/10.1063/5.0166220
-
S. Amirov, M. Yakubov, and U. Israilov, “Analysis and assessment of the insulation resource from the windings of a traction asynchronous electric motor of electric rolling stock,” in The 3rd International Scientific Conference Construction Mechanics, Hydraulics and Water Resources Engineering (CONMECHYDRO 2021 AS), Vol. 2612, p. 050036, Jan. 2023, https://doi.org/10.1063/5.0113022
About this article

The authors have not disclosed any funding.
The datasets generated during and/or analyzed during the current study are available from the corresponding author on reasonable request.
The authors declare that they have no conflict of interest.
