Abstract
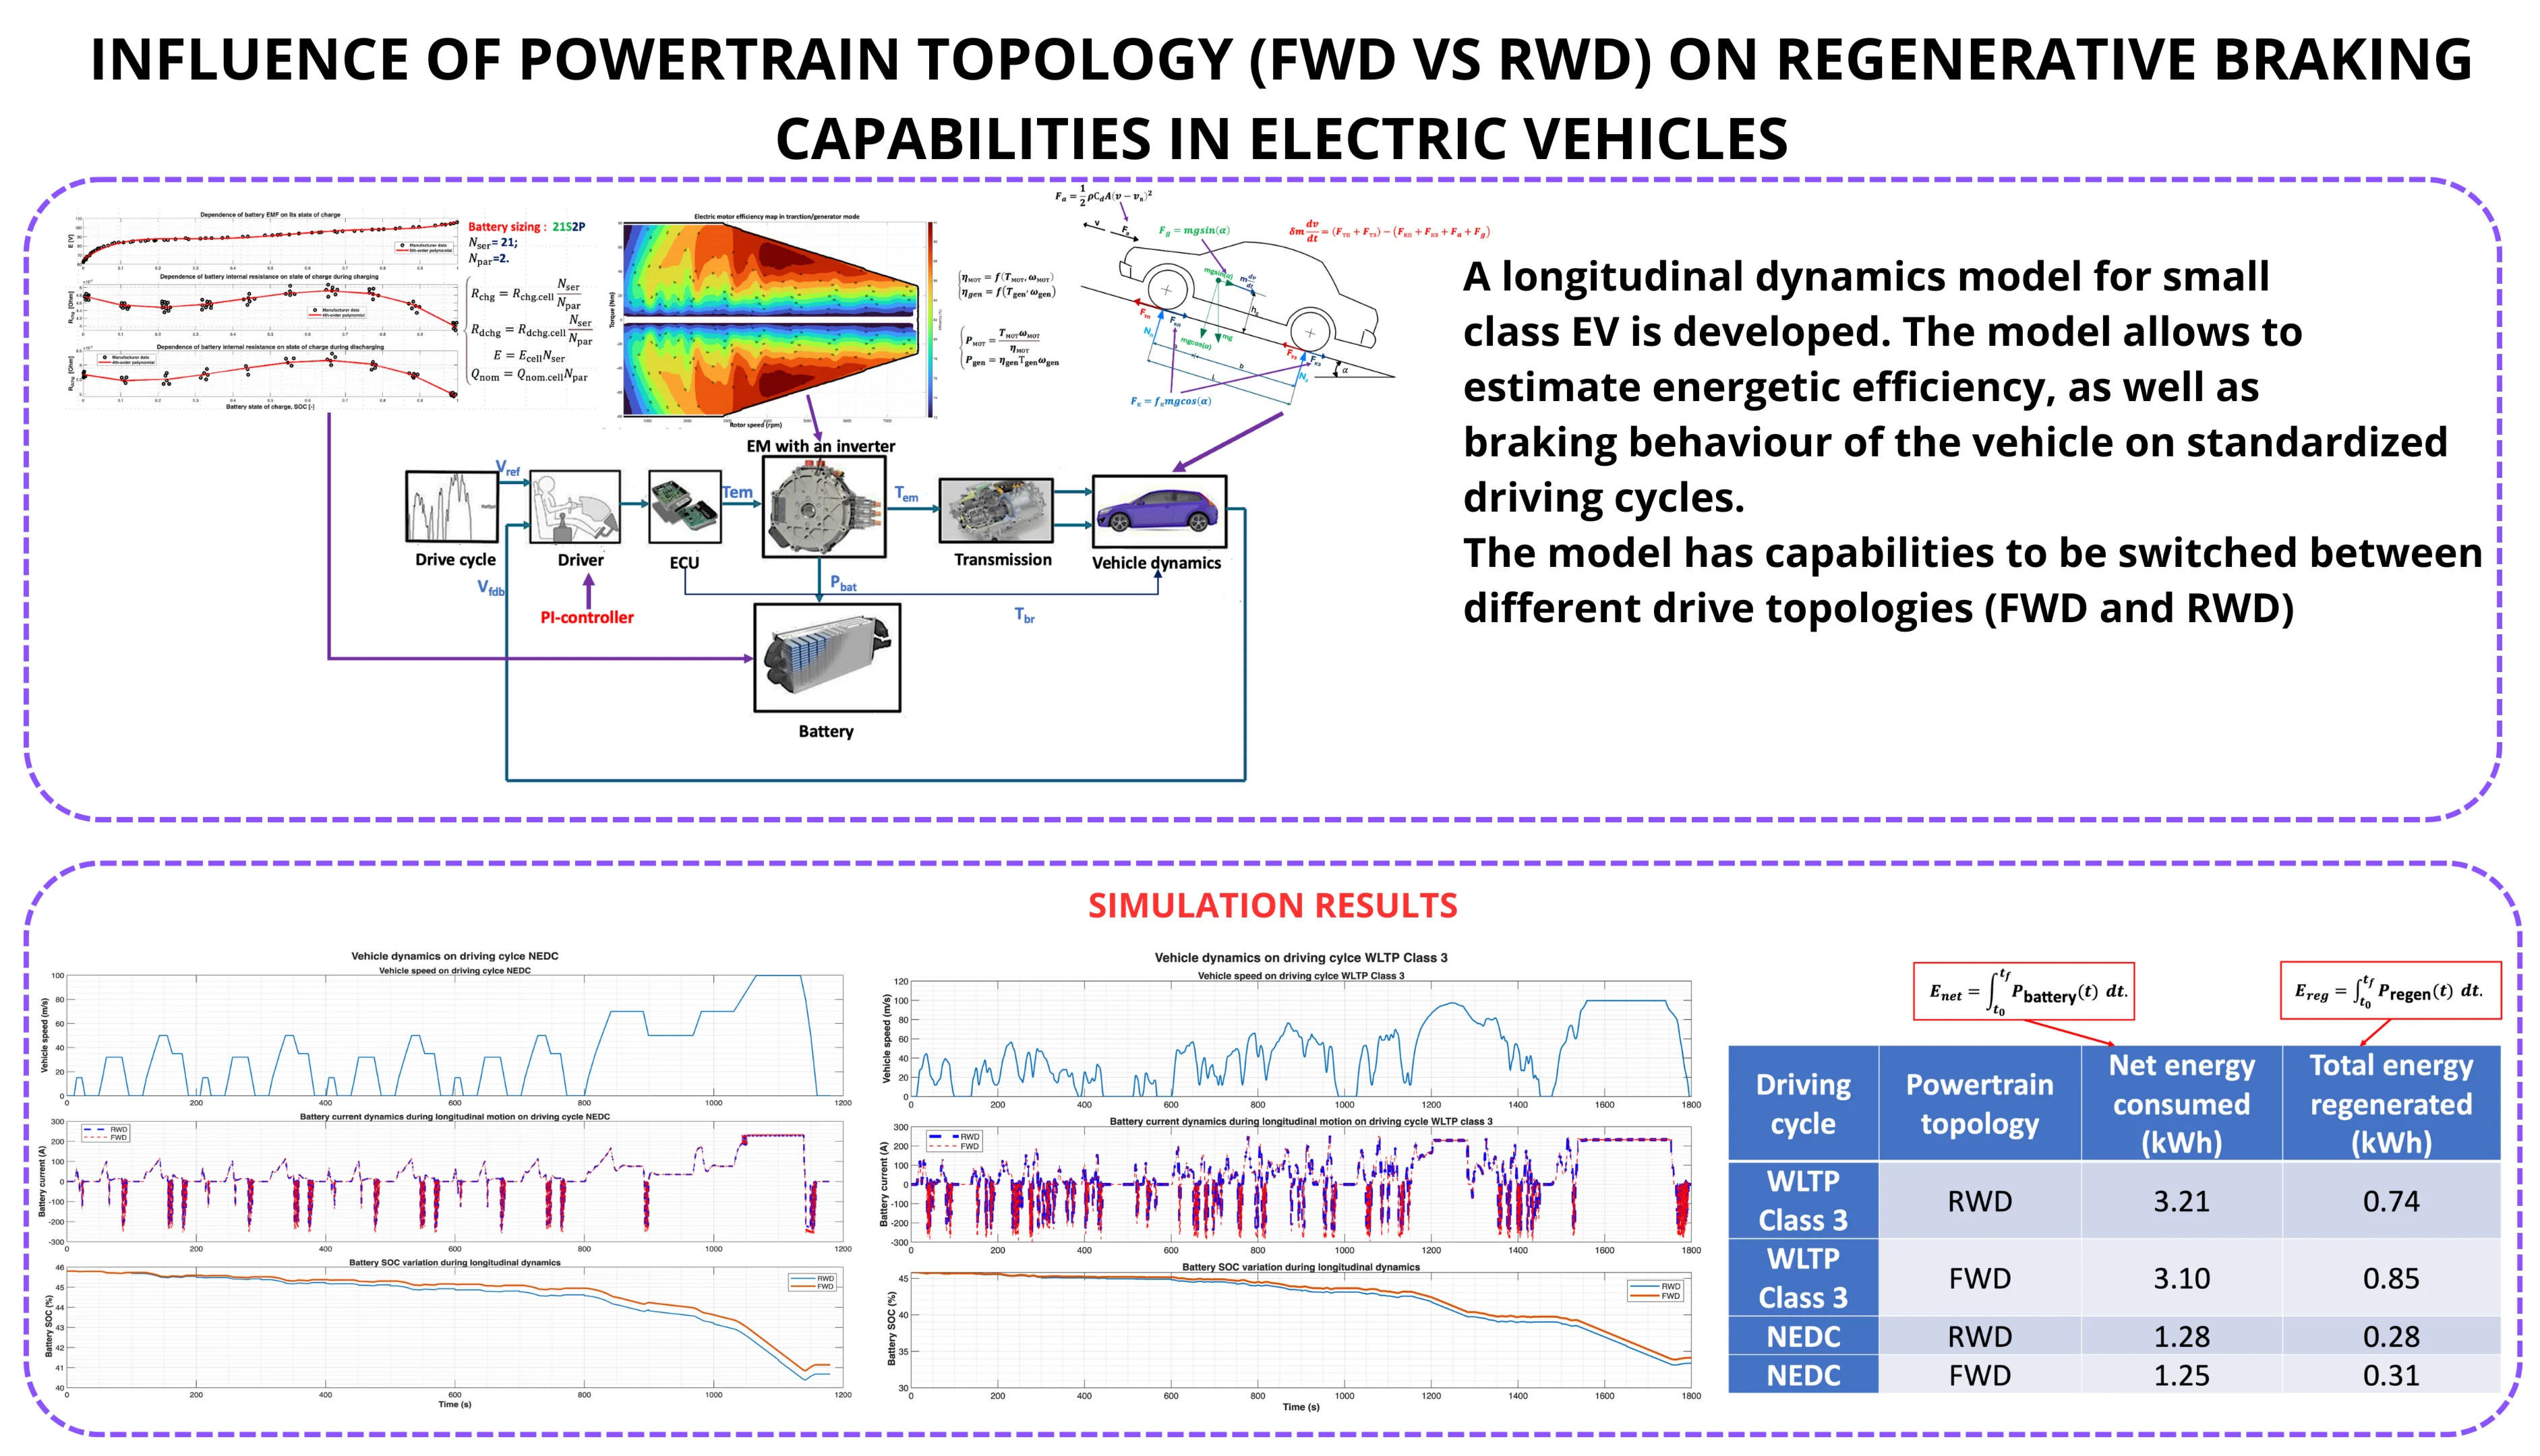
This study compares the regenerative braking capability and energy efficiency of a small-class electric vehicle based on the Wuling Macaron EV with FWD or RWD engine configuration. Both drivetrain configurations were simulated under NEDC and WLTP Class 3 driving cycles using MATLAB/Simulink and parallel regenerative braking control, with the vehicle’s maximum speed limited to 100 km/h to emulate real operating conditions. Drivetrain arrangement significantly affects regenerative energy recovery. FWD had greater negative battery current peaks during deceleration, faster energy recovery, and a slower SOC decline than RWD. FWD layouts achieved up to 15 % greater regeneration energy and 3.4 percent lower net energy use under WLTP conditions. Due to better front-axle load transfer, traction and regenerative torque improve. An average driving distance of 20,000 km in Uzbekistan results in an estimated annual energy savings of 98 kWh, or 88,000 UZS (≈8 USD) per vehicle. Data shows that electric automobiles with higher motor torque and power ratings may have better regenerative braking. The results show that front-wheel drive and proper motor features improve braking energy recovery and vehicle performance more efficiently and economically for small urban electric cars.
Highlights
- FWD vehicle have a higher capability to regenerative braking due to load transfer in the deceleration process.
- Front-wheel driven (FWD) layout of small class EV may regenerate about 15% more energy than rear-whell driven (RWD) vehicles with equal input parameters.
- FWD variant has demonstrated 3.4% better net energy consumption with respect to the RWD one.
1. Introduction
Regenerative braking (RB) is fundamental to energy efficiency in battery electric vehicles (BEVs), enabling the conversion of a portion of the vehicle’s kinetic energy back into electrical energy for storage in the traction battery. Recent assessments consolidate two decades of progress in regenerative braking topologies, control techniques, and energy storage interfaces, consistently indicating significant range improvements when regenerative braking is effectively integrated with hydraulic brakes and limited by battery, motor, and tire-road constraints [1]-[3].
In the construction of battery electric vehicles (BEVs), blended braking distributes wheel torque between electric and friction actuators to ensure safety while optimizing energy recovery [4]. Analytical and experimental investigations indicate that optimum blending may enhance recovered energy without compromising stopping distance or stability, as long as battery power restrictions, motor speed/torque maps, and low-speed cut-off logic are adhered to [5]-[7].
An inadequately examined aspect is how engine configuration – front-wheel drive (FWD) vs rear-wheel drive (RWD) – affects the attainable regenerative torque at the wheels [8]. During braking, longitudinal load transfer elevates the usual load on the rear axle while diminishing it on the front, so modifying tire friction availability and consequently affecting the safe operational envelope for electronic braking at each axle [9]. Analyses of vehicle dynamics and torque distribution indicate that the allocation of longitudinal forces among axles significantly influences yaw stability and traction during both straight-line and combined (brake-in-turn) scenarios [10], [11]. The fundamentals suggest that rear-wheel drive (RWD) configurations can, theoretically, utilize the increased load on the rear axle to accommodate greater regenerative torques before encountering tire slip limits, whereas front-wheel drive (FWD) configurations may emphasize stability and steering response but experience front-tire saturation sooner during moderate to high decelerations [10], [12], [13].
Only a few studies specifically link drivetrain configuration to RB potential. Thesis-level and conference contributions analyzing drive-train topologies indicate that axle-specific mass distribution, center-of-gravity elevation, and controller limitations (ABS/ESC/EBD coordination) may skew recuperation potential towards the driven axle – favoring rear-wheel drive during braking – while adhering to battery reception thresholds and stability limitations [14]-[15]. Recent developments in braking methods explicitly relate regenerative force to topology, for instance, allocating a greater proportion of braking power to the rear in rear-wheel drive configurations within friction constraints to prevent front-axle saturation and understeer [16].
Contemporary RB controllers, encompassing fuzzy-logic distributions, game-theoretic approaches, and hierarchical supervisory frameworks, illustrate that coordination with ABS/ESC and EBD can maintain or enhance stability while optimizing energy recovery across diverse surfaces and deceleration requirements [5], [7], [16]. However, these investigations seldom isolate and quantify the topological influence (FWD vs RWD) on energy recovery and stability under standardized driving cycles and controlled deceleration profiles.
2. Methodology
2.1. Vehicle model
The research utilizes a small-class electric vehicle designed after the Wuling Macaron EV, a tiny battery-electric urban automobile manufactured by SAIC-GM-Wuling. The reference vehicle is equipped with a permanent-magnet synchronous motor (PMSM) rated at 20 kW peak power and 85 N·m maximum torque, paired with a rear-wheel-drive (RWD) single-speed gearbox. For comparison examination, a front-wheel-drive (FWD) model is developed by transferring the propulsion and regenerative braking capabilities to the front axle while preserving the same geometry, mass, and drivetrain specifications. This method separates the influence of powertrain configuration on regenerative efficiency and stability. Table 1 delineates the vehicle and ambient factors used in the simulation of longitudinal dynamics.
Table 1Main parameters of the modeled vehicle Wuling Macaron EV
Parameter | Symbol | Value | Unit | Remarks |
Vehicle mass | 700 | kg | Curb weight | |
Wheelbase | 1.94 | m | Distance between axles | |
Track width | 1.29 | m | Average front / rear | |
Center of gravity height | 0.25 | m | Estimated from geometry | |
Tire radius | 0.27 | m | Equivalent rolling radius | |
Maximum motor torque | 85 | N·m | PMSM rated torque | |
Motor rated/peak power | 20 | kW | Nominal power | |
Nominal battery voltage | 105 | V | Based on 13.8 kWh pack | |
Battery capacity | 13.8 | kWh | Lithium-ion pack | |
Regenerative torque limit | 85 | N·m | Equal to motor torque limit | |
Adhesion coefficient | 0.9 / 0.6 | – | Dry / low-adhesion surfaces | |
Low-speed cut-off | – | 10 | km/h | Below which regeneration is disabled |
Both FWD and RWD configurations retain identical mechanical and electrical properties. Only the axle responsible for propulsion and regenerative braking differs, ensuring that all observed performance variations stem from the drivetrain topology.
2.2. Drivetrain topology comparison setup
Two configurations were constructed in the MATLAB/Simulink environment:
RWD configuration: the baseline Wuling Macaron EV, where both traction and regenerative braking torque are applied at the rear axle.
FWD configuration: identical motor, inverter, and battery characteristics, with the drive and regenerative torque reassigned to the front axle.
All other subsystems – vehicle mass distribution, suspension, and control logic – were maintained constant. The comparison therefore isolates the effect of powertrain topology on longitudinal dynamics and regenerative efficiency.
2.3. Regenerative braking control strategy
This study utilizes a parallel regenerative braking approach that emphasizes energy recovery while adhering to stability and safety limitations. The supervisory controller regulates electric and hydraulic brake torques during braking, taking into account immediate load transfer, motor constraints, and battery charge-acceptance capacity. A crucial stability factor is that regenerative braking is mostly delivered to the driving axle; excessive torque on a weakly laden axle may result in wheel slip and yaw instability. In the FWD layout, front-axle load transfer during braking often enhances tire grip, allowing for more regenerative output without sacrificing directional control. Excessive front-axle braking may increase the danger of understeer during simultaneous turning and braking actions if not synchronized with ESC/EBD systems. In the case of rear-wheel drive, excessive unloading of the rear axle might increase the likelihood of oversteer if regeneration is not sufficiently restricted, requiring more cautious torque mixing to ensure stability.
Key control features include:
1) Real-time constraint of regenerative torque by motor limits and the battery’s charge-acceptance power .
2) Low-speed cut-off (below 10 km/h) to ensure smooth vehicle stop.
3) Anti-lock safety logic ensuring at each axle.
4) Identical control law for both RWD and FWD cases, differing only in the driven-axle assignment.
Longitudinal load transfer is computed during braking to modify the permissible regenerative torque on the driving axle. In the RWD arrangement, augmented rear-axle weight during deceleration facilitates more regenerative torque prior to wheel slip; conversely, in the FWD configuration, enhanced front-axle load improves stability but may limit electric output owing to steering and traction factors.
Although this study focuses on straight-line braking, the control framework aligns with industry practice, whereby regenerative torque is actively curtailed during aggressive steering inputs or slip events, transitioning to friction braking to preserve stability. Future iterations of this model may incorporate full nonlinear tire dynamics, yaw-rate feedback, and ESC-regeneration coordination to further analyze trade-offs in cornering scenarios.
2.4. Simulation environment and drive cycles
All simulations are conducted in MATLAB/Simulink using the Powertrain Blockset with specialized subsystems that depict the longitudinal vehicle model, battery dynamics, and the parallel regenerative braking controller.
Major components include:
1) Vehicle dynamics block: computes longitudinal motion and load transfer during braking.
2) Tire model: linear slip-limited or simplified Pacejka formulation to estimate available longitudinal forces.
3) Motor model: mapped PMSM torque–speed characteristics for both motoring and generating quadrants.
4) Battery model: SOC-dependent open-circuit voltage and internal resistance, with charge-power limits.
5) Supervisory controller: executes the parallel braking algorithm and coordinates motor-brake blending, as well as performs power arbirtration of the electric motor for traction/braking.
Two representative drive cycles are applied:
1) Urban cycle (NEDC-urban): low average speed with frequent stops, typical of city traffic.
2) Mixed cycle (WLTP Class 3): includes steady-speed cruising and medium-intensity decelerations.
Each simulation records vehicle speed, regenerative power, SOC trajectory.
2.5. Data analysis
Simulation outputs are post-processed to evaluate and compare.
1) Total recovered energy:
2) State-of-charge (SOC) variation during complete drive cycles.
3) Net consumed energy during longitudinal motion:
3. Results and discussions
Fig. 1 illustrates the simulated vehicle dynamics throughout the NEDC driving cycle for both rear-wheel-drive (RWD) and front-wheel-drive (FWD) configurations. The modeled Wuling Macaron EV, with a maximum speed of 100 km/h, necessitated truncating the reference driving cycle at this limit to maintain operation within its realistic performance parameters.
Fig. 1Battery current and SOC evolution for RWD and FWD configurations under the NEDC cycle. The FWD layout exhibits stronger negative current peaks and a slightly slower SOC decline, indicating improved regenerative energy recovery compared to RWD
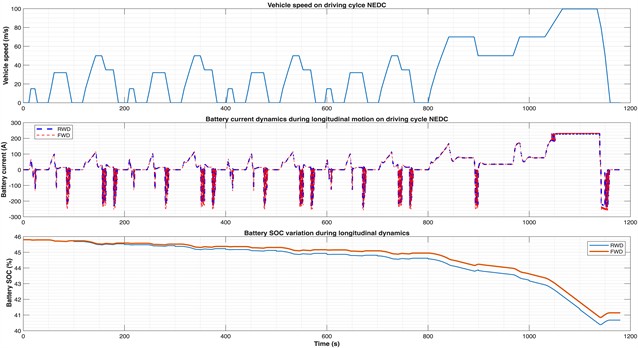
During propulsion events, both topologies display essentially equal current peaks due to the uniformity of powertrain components, vehicle mass, and aerodynamic characteristics. The distinctions manifest during deceleration: the FWD arrangement exhibits greater negative current amplitudes – up to 10-15 % larger-signifying enhanced regenerative energy transfer to the battery.
The aggregate impact of these disparities is shown in the SOC curve: at the cycle’s conclusion, the FWD car maintains around 0.4-0.5 % higher SOC than the RWD vehicle. This benefit stems from two factors:
1) Higher instantaneous regenerative current at the front axle during decelerations, yielding greater recovered electrical energy.
2) More frequent braking utilization of the driven axle in the FWD case, as most NEDC segments involve moderate decelerations that favor front-axle braking contribution.
Fig. 2 illustrates the simulated vehicle dynamics during the WLTP Class 3 driving cycle for both rear-wheel-drive (RWD) and front-wheel-drive (FWD) configurations. The WLTP Class 3 cycle has increased acceleration and extended steady-speed portions relative to NEDC, offering a more accurate depiction of mixed urban-highway performance. The vehicle speed was capped at 100 km/h, aligning with the specified maximum velocity of the Wuling Macaron EV, hence keeping the simulation within plausible dynamic parameters.
The top subplot illustrates the vehicle speed profile during the whole 1800-second cycle. The central subplot illustrates the battery current response, with positive values indicating traction power (discharge) and negative values representing regenerative braking (charging). The lower subplot illustrates the temporal change of the battery state-of-charge (SOC) for both drivetrain configurations.
In traction phases, the current profiles of both systems closely align, since the propulsion power requirements and total vehicle mass are equivalent. The primary difference occurs during braking: the FWD arrangement displays more pronounced negative current peaks, often 10-20 % greater in amplitude than those seen in the RWD scenario.
Fig. 2Battery current and SOC evolution for RWD and FWD configurations under the WLTP Class 3 cycle. The FWD topology demonstrates more pronounced regenerative current peaks and higher final SOC, confirming superior energy recuperation over RWD during mixed urban-highway operation
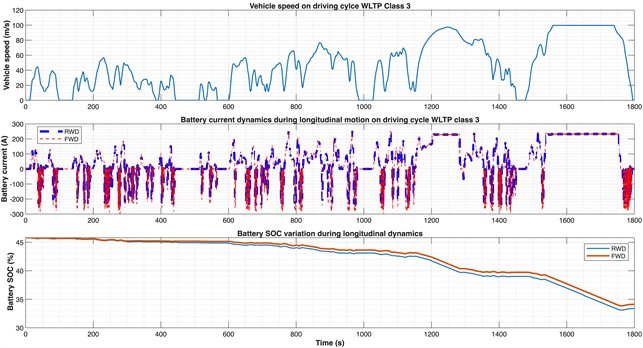
Thus, the size and duration of the regeneration current are reduced in the RWD design.
These differences accumulate throughout the WLTP cycle and are evident in the SOC trajectories. By the end of the test, the FWD configuration maintains approximately 0.7-0.9 % higher SOC than the RWD one. This SOC gap arises because the FWD system:
1) Recovers more energy per braking event due to higher allowable regenerative torque on the loaded front axle.
2) Encounters more frequent moderate decelerations at mid-speeds (40-80 km/h) in WLTP, where front-axle braking dominates and regeneration is most efficient.
Table 2 summarizes the comparative energy indicators for the front-wheel-drive (FWD) and rear-wheel-drive (RWD) configurations of the modeled Wuling Macaron EV under two standardized driving cycles: NEDC and WLTP Class 3.
The results clearly show that the FWD topology demonstrates superior energy efficiency and regenerative performance in both test cycles. Under WLTP Class 3 conditions, the FWD vehicle consumed 3.10 kWh of net energy compared to 3.21 kWh for the RWD configuration, representing a reduction of approximately 3.4 % in total energy consumption. Simultaneously, the total regenerated energy increased from 0.74 kWh (RWD) to 0.85 kWh (FWD) – an improvement of roughly 15 %.
A same trend is seen in the NEDC cycle, whereby the FWD configuration attained marginally reduced net energy consumption (1.25 kWh compared to 1.28 kWh) and enhanced energy recuperation (0.31 kWh vs 0.28 kWh). Despite the reduced disparities under NEDC owing to its decreased average deceleration intensity, they affirm the persistent superiority of FWD in regeneration performance.
Table 2Summary of comparison of energetic indicators of FWD and RWD vehicle
Driving cycle | Powertrain topology | Net energy consumed (kWh) | Total energy regenerated (kWh) |
WLTP Class 3 | RWD | 3.21 | 0.74 |
WLTP Class 3 | FWD | 3.10 | 0.85 |
NEDC | RWD | 1.28 | 0.28 |
NEDC | FWD | 1.25 | 0.31 |
4. Limitations and future research directions
This work lacks physical experimental validation, with conclusions derived only from simulation-based analysis. A simple tire model was used, which fails to adequately represent combined slip, nonlinear tire saturation, or road-friction variability under severe or transitory situations. These simplifications may limit the accuracy of stability behavior forecasts during intense steering-braking interactions. Subsequent study will integrate actual chassis-dynamometer or road-test data and use a comprehensive nonlinear tire model with yaw-rate feedback and ESC-regeneration coordination to more precisely depict real-world dynamics and substantiate the results.
5. Conclusions
This research examined the impact of engine configuration (FWD vs RWD) on the regenerative braking efficacy and total energy efficiency of a small-class electric vehicle patterned after the Wuling Macaron EV. The study was conducted in MATLAB/Simulink using a parallel regenerative braking control approach, with both configurations evaluated under standardized NEDC and WLTP Class 3 driving cycles.
The enhancement in the FWD design mostly results from the more advantageous front-axle load transfer during braking, allowing the controller to implement more regenerative output without surpassing tire adhesion thresholds. Conversely, the RWD layout undergoes rear axle unloading during deceleration, diminishing its regenerative capacity.
Economically, the FWD layout may save around 98 kWh annually for an average driving distance of 20,000 km. With a charging cost of 900 UZS per kWh in Uzbekistan, this equates to an annual savings of around 88,000 UZS (nearly 8 USD) per car. When expanded to a fleet of thousands of electric vehicles, the aggregate advantage becomes significant, along with further reductions in brake wear and maintenance expenses.
References
-
E. M. Szumska, “Regenerative braking systems in electric vehicles: a comprehensive review of design, control strategies, and efficiency challenges,” Energies, Vol. 18, No. 10, p. 2422, May 2025, https://doi.org/10.3390/en18102422
-
P. Saiteja, B. Ashok, A. S. Wagh, and M. E. Farrag, “Critical review on optimal regenerative braking control system architecture, calibration parameters and development challenges for EVs,” International Journal of Energy Research, Vol. 46, No. 14, pp. 20146–20179, Jul. 2022, https://doi.org/10.1002/er.8306
-
W. Li et al., “Regenerative braking control strategy for pure electric vehicles based on fuzzy neural network,” Ain Shams Engineering Journal, Vol. 15, No. 2, p. 102430, Feb. 2024, https://doi.org/10.1016/j.asej.2023.102430
-
F. Umerov, S. Asanov, O. Daminov, U. Komiljonov, and I. Avazov, “Energy savings in public transport: Estimating the impact of regenerative braking in electric buses in public transport of Tashkent,” in 4th International Scientific and Technical Conference “Actual Issues of Power Supply Systems”: ICAIPSS2024, Vol. 3331, p. 030080, Jan. 2025, https://doi.org/10.1063/5.0306144
-
J. Ruan, P. D. Walker, P. A. Watterson, and N. Zhang, “The dynamic performance and economic benefit of a blended braking system in a multi-speed battery electric vehicle,” Applied Energy, Vol. 183, pp. 1240–1258, Dec. 2016, https://doi.org/10.1016/j.apenergy.2016.09.057
-
B. Xiao, H. Lu, H. Wang, J. Ruan, and N. Zhang, “Enhanced regenerative braking strategies for electric vehicles: dynamic performance and potential analysis,” Energies, Vol. 10, No. 11, p. 1875, Nov. 2017, https://doi.org/10.3390/en10111875
-
S. Heydari, P. Fajri, I. Husain, and J.-W. Shin, “Regenerative braking performance of different electric vehicle configurations considering dynamic low speed cutoff point,” in 2018 IEEE Energy Conversion Congress and Exposition (ECCE), p. 2018, Sep. 2018, https://doi.org/10.1109/ecce.2018.8558324
-
O. Daminov et al., “Electric vehicle battery technology and optimization,” in 4th International Scientific and Technical Conference “Actual Issues of Power Supply Systems”: ICAIPSS2024, Vol. 3331, p. 060026, Jan. 2025, https://doi.org/10.1063/5.0306143
-
C. Qiu, G. Wang, M. Meng, and Y. Shen, “A novel control strategy of regenerative braking system for electric vehicles under safety critical driving situations,” Energy, Vol. 149, pp. 329–340, Apr. 2018, https://doi.org/10.1016/j.energy.2018.02.046
-
J. Duclos and T. Hofman, “Battery-electric powertrain design analysis for an efficient passenger vehicle,” in IEEE Vehicle Power and Propulsion Conference (VPPC), pp. 1–8, Oct. 2021, https://doi.org/10.1109/vppc53923.2021.9699155
-
P. Spichartz and C. Sourkounis, “Comparison of drive train topologies for electric vehicles with regard to regenerative braking,” in 14th International Conference on Ecological Vehicles and Renewable Energies (EVER), pp. 1–8, May 2019, https://doi.org/10.1109/ever.2019.8813592
-
F. Umerov, S. Asanov, O. Daminov, J. Mirzaabdullaev, and A. Yangibaev, “Improving the performance of light vehicle cooling system with mechatronic system,” in 4th International Scientific and Technical Conference “Actual Issues of Power Supply Systems”: ICAIPSS2024, Vol. 3331, p. 030079, Jan. 2025, https://doi.org/10.1063/5.0306145
-
C. Li, L. Zhang, S. Lian, and M. Liu, “Research on regenerative braking control of electric vehicles based on game theory optimization,” Science Progress, Vol. 107, No. 2, May 2024, https://doi.org/10.1177/00368504241247404
-
E. Mehrdad, G. Yimin, L. Stefano, and E. Kambiz, Modern Electric, Hybrid Electric, and Fuel Cell Vehicles. Boca Raton: CRC Press, 2018, https://doi.org/10.1201/9780429504884
-
J. G. Hayes and G. A. Goodarzi, Electric Powertrain. Wiley, 2017, https://doi.org/10.1002/9781119063681
-
C. Wang, W. Zhao, and W. Li, “Braking sense consistency strategy of electro-hydraulic composite braking system,” Mechanical Systems and Signal Processing, Vol. 109, pp. 196–219, Sep. 2018, https://doi.org/10.1016/j.ymssp.2018.02.047
About this article

The authors have not disclosed any funding.
The datasets generated during and/or analyzed during the current study are available from the corresponding author on reasonable request.
The authors declare that they have no conflict of interest.
