Abstract
Identifying seismic disaster precursors and instability early warning signs in tunnels is critical for seismic design and catastrophe warning. Current approaches predominantly rely on static assessments of specific states, either post-event or at peak response. Thus, they fail to capture the continuous evolution and abrupt transitions inherent in nonlinear dynamic systems. For this purpose, the Load/Unload Response Ratio (LURR) theory was introduced to evaluate the seismic stability of tunnels. Definitions were established for loading and unloading parameters, response parameters, and the LURR during the seismic response of tunnels. According to the principles of the LURR theory, shaking table model tests were performed on an unlined tunnel to study how the LURR varies and how the soil’s stability changes with different seismic intensities. Research shows that as seismic amplitude increases, the stability of an unlined tunnel evolves through three distinct phases: stable bearing capacity, localized collapse, and overall collapse. A correlation is observed between the time-history curve of the LURR of the surrounding soil and the progression of stability. During the stable bearing phase, LURR values fluctuate at low magnitudes, while the maximum LURR at the weakest structural location (the arch foot) gradually rises with increasing seismic amplitude. As stability deteriorates, the LURR displays a localized growth pattern in the crown and sidewall regions (monitoring points 1-4). A declining trend in the regional LURR peak value corresponds to the onset of localized collapse in that specific area. Following the initial localized collapse, the maximum LURR shifts from the crown zone to the sidewall foot and invert waist areas. When the regional peak LURR in this secondary zone begins to decrease, the tunnel experiences overall collapse that propagates to the ground surface. Based on shaking table model test results, the decline of the first localized LURR peak, combined with its spatial migration, can serve as a criterion for assessing localized tunnel instability. Furthermore, the decline of two or more localized LURR peaks provides a predictive indicator for the overall instability of the tunnel.
Highlights
- A novel computational LURR model for tunnel seismic stability assessment is proposed, linking seismic wave loading/unloading with acceleration responses at key tunnel locations.
- Unlined tunnel stability evolves through three distinct stages with increasing seismic amplitude: stable bearing, localized collapse, and overall collapse.
- The temporal-spatial evolution of LURR serves as a critical precursor, where its extreme values and regional patterns can predict both localized and overall seismic instability of tunnels.
1. Introduction
Tunnels are critical elements of transportation and energy infrastructure. They play an indispensable role in regional economic development and public safety, which highlights the importance of their seismic performance. Although tunnels generally demonstrate superior seismic resistance to above-ground structures due to the constraints offered by the surrounding soil, numerous instances of seismic damage have been documented following major earthquakes, including the Great Hanshin, Wenchuan and Turkey doublet events [1-3]. Under intense seismic loading, tunnel structures are particularly susceptible to instability and collapse. Consequently, developing accurate and reliable methods for assessing instability is crucial for the seismic design of tunnels and for establishing effective early warning systems during earthquake-induced disasters.
Currently, the analysis of the seismic response of tunnels predominantly relies on numerical simulations and physical model tests. Researchers worldwide have conducted extensive investigations into methodologies for determining tunnel seismic instability, yielding several key findings.
Conventional approaches often use material strength thresholds or permissible deformation limits as criteria for instability. For instance, Do et al. [4] used bolt yield strength and concrete cracking strain as failure criteria for shield tunnel segment joints in a two-dimensional finite element analysis. Lakirouhani et al. [5] on the other hand, used the exceedance of Mises stress over the dynamic strength of materials as a criterion when performing three-dimensional model analyses of tunnel seismic behaviour. Similarly, Gharizade Varnusfaderani et al. [6] examined the combined impact of near-fault ground motions and fault rupture, using permanent lining deformation (e.g. exceeding 10 cm) and concrete crushing strain as comprehensive indicators of instability. However, these methods have limitations in adequately capturing the complex dynamic interactions observed under real conditions.
With the evolution of performance-based seismic design methodology, researchers have increasingly characterized structural performance levels through global or local deformation indices, including inter-story drift angles and joint opening displacements. For example, based on model tests of immersed tunnels, Zhang et al. [7] established a correlation between joint opening displacement and moment-curvature relationships, thereby proposing deformation-based performance criteria. In their soil-structure interaction model, Zhang et al. [8] designated a joint opening displacement of 5 mm as the performance limit under moderate seismic loading. Similarly, the Japanese “Specifications for Tunnel Seismic Design” explicitly integrates joint deformation into a three-tiered performance-based design framework [9].
As our understanding of seismic damage mechanisms has advanced, some researchers have investigated energy- and cumulative damage-based evaluation approaches. These methods emphasize the dissipation and distribution of seismic energy within the rock-structure system and seek to quantify cumulative effects via damage indices, thereby offering a more comprehensive theoretical framework. For instance, Park et al. [10] characterized damage states using inelastic frame analysis (based on the number of plastic hinges), defining the damage index as the ratio of the elastic moment to the yield moment. Based on the energy balance principle, Wen et al. [11] proposed a criterion for evaluating tunnels' dynamic stability involving total energy, releasable elastic strain energy, and dissipated energy, and formulated an equation for this assessment.
Generally, most existing evaluation methods rely on static assessments of specific states, either after or at the moment of peak seismic response. However, these methods are inadequate for capturing and utilizing the dynamic evolution patterns during the instability initiation process and fail to explore the continuous progression of nonlinear dynamic systems transitioning from a stable state to instability-induced failure.
This study introduces the LURR theory as a means of evaluating the seismic instability of tunnels. A shaking table model test has been designed to simulate the dynamic response of unlined tunnels under different seismic intensities. Key cross-sections are monitored in real time to track deformation behavior, and the time-dependent variation of the LURR is computed. By comparing the characteristics of falling blocks and collapse in unlined tunnels, a relationship is identified between LURR trends and tunnel stability. This analysis enables a new precursor criterion for tunnel seismic disasters to be established based on the LURR.
2. Characteristics of the load/unload response in tunnel seismic response
2.1. LURR theory
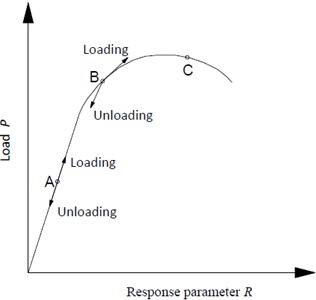
The LURR theory was initially introduced by Yin Xiangchu in 1994 for earthquake prediction and has since demonstrated a high success rate in forecasting. The fundamental premise of the theory is that when a material or nonlinear system is damaged or approaches an unstable state, its response to loading increases markedly, while the response to unloading remains relatively stable. Consequently, the ratio of the loading response rate to the unloading response rate can serve as an indicator of such damage and instability [12, 13]. Fig. 1 provides a schematic illustration of the underlying mechanism.
Fig. 1LURR mechanism
LURR is defined as follows:
where indicates the response ratio during loading, and represents the response ratio during unloading, represents the load increment, and corresponds to the incremental change in the LURR parameter induced by .
When the system operates within the linear elastic stability regime, , yielding 1. As the system transitions into the plastic damage stage, , leading to 1, with increasing progressively as damage accumulates. At the onset of instability, the value of exhibits a sharp discontinuity or diverges towards infinity.
The application of the LURR theory is based on three fundamental components: the appropriate definition of loading and unloading loads; the selection of responsive parameters during loading and unloading; and the rigorous formulation of the LURR.
2.2. Definition of LURR components for tunnel seismic response
As the LURR theory continues to advance, its application in predicting failures within nonlinear systems has progressively extended to assessing instability in geotechnical engineering. Notable examples include experiments on rock damage and failure [14], landslide prediction [15] and the evaluation of stability during tunnel construction [16]. The dynamic stability of tunnel engineering also exhibits pronounced non-linear behavior. Furthermore, periodic cyclic loads, such as those induced by seismic events and blasting vibrations, inherently possess load/unload characteristics, thereby establishing the conditions necessary for implementing LURR theory. Preliminary attempts in this area have already been undertaken [17]. When analysing tunnel seismic response, the three core components of the LURR theory are defined as follows:
The input seismic wave time history represents both loading and unloading conditions:
If : loading;
If : unloading,
where represents the overall mass matrix, and denotes the input acceleration vector at the -th discrete time point.
To accurately capture the tunnel’s dynamic response under seismic loading, the acceleration responses at key locations along the tunnel’s periphery – the vault, haunch, springing, midpoint of sidewall, invert springing, invert haunch, invert bottom – are defined as loading and unloading responses.
Since seismic loads exhibit random periodic vibrations with substantial variability in peak ground acceleration and frequency content, the seismic time history is divided into uniform micro-time intervals. This division mitigates the influence of load inhomogeneity on computational outcomes. Within each interval, the ratio of the cumulative loading response to the cumulative unloading response is calculated and defined as the LURR for the tunnel under seismic excitation. This ratio is expressed as follows:
where denotes the LURR for the i-th loading-unloading interval; and represent the cumulative loading and cumulative unloading amounts, respectively, during a specified loading-unloading interval; and correspond to the total loading response and total unloading response, respectively, within the same interval; and indicate the loading amount and unloading amount at the -th time point, respectively, where the superscript + signifies an increase in the absolute acceleration value, and the superscript − denotes a decrease in the absolute acceleration value; and refer to the loading response and unloading response, respectively, at the time points corresponding to and ; is the number of loading actions within the loading-unloading interval; and is the number of unloading actions within the same interval.
3. Shaking table model test design
The goal of this section is to validate the feasibility of using the LURR theory to evaluate the seismic instability of tunnels. To gain further insight into failure mechanisms, shaking table tests are conducted to study the seismic response of unlined tunnels under earthquake loading.
3.1. Testing equipment
The experimental tests in this study were performed using the shaking table facility at the State Key Laboratory of Mountain Bridge and Tunnel Engineering at Chongqing Jiaotong University. The vibration system consists of a unidirectional, electro-hydraulic, servo-controlled shaking table manufactured by ANCO Corporation in the USA. See Fig. 2 for an illustration of the table.
The principal technical specifications of the shaking table are summarized below:
– Table dimensions: 3.0 m × 3.0 m.
– Direction of motion: Unidirectional (horizontal).
– Peak acceleration: 1.5 g with a 10-ton load.
– Peak velocity: 100 cm/s.
– Peak displacement: ±100 cm.
– Frequency range: 0-50 Hz.
– Maximum replication duration: Up to five minutes.
Fig. 2Shaking table and loading system. Image credit: Xukai Tan, State Key Laboratory of Mountain Bridge and Tunnel Engineering, 2025
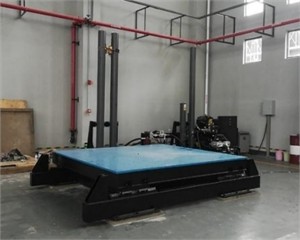
a) Shaking table
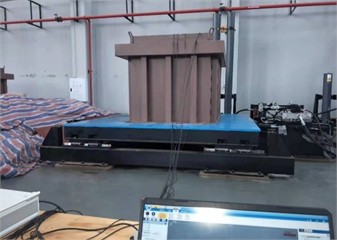
b) Loading system
3.2. Design of similarity relationships
This experimental study investigates the correlation between the LURR and the system stability by analyzing deformation and stress evolution patterns in the soil of an unlined tunnel. A model test was established based on similitude theory, with the following fundamental similarity ratios defined: geometric similarity ratio (1/64), acceleration similarity ratio (1/1), and density similarity ratio (1/1). Additional physical quantities were scaled in accordance with similitude principles, and the resulting similarity relationships are summarized in Table 1.
To replicate failure behavior under controlled conditions, an unlined tunnel model was adopted. The primary objective of this work is to clarify the mechanistic role of the LURR in governing tunnel stability, rather than to precisely simulate a specific natural prototype. Consequently, real soil materials were employed in the model construction. This approach preserves the essential mechanical properties of the soil and enhances the generality of the derived mechanistic insights.
Table 1Design of similarity ratios for various physical quantities
Parameter | Similarity relation | Similarity ratio |
Length | 1/64 | 1/64 |
Density | 1 | 1/1 |
Acceleration | 1 | 1/1 |
Time | 1/8 | |
Frequency | 1/0.125 | |
Displacement | 1/64 | |
Velocity | 1/8 |
3.3. Model box design
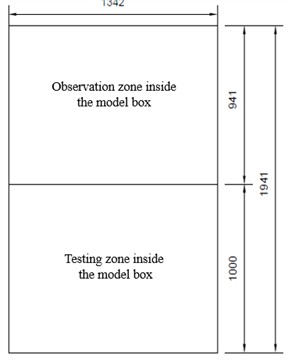
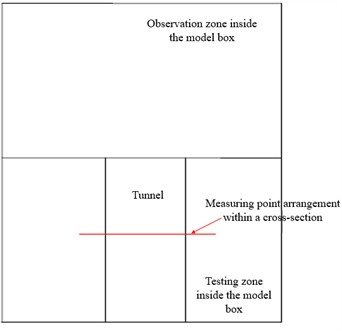
A conventional geotechnical rigid model box with external dimensions of 2.0 m×1.5 m×1.5 m and internal dimensions of 1.941 m×1.342 m×1.498 m) was used in this experiment. A slot was welded at the midpoint along the length of the model box. A 10-cm-thick Plexiglas panel was installed in the slot to facilitate tunnel excavation and enable real-time observation. Following this modification, the internal dimensions of the model box were adjusted to: 1.0 m in length, 1.342 m in width, and 1.25 m in height. A layer of polyethylene foam board was affixed to the inner walls of the model box to mitigate boundary effects.
The tunnel was designed with a three-centered arch profile and a cross-sectional span of 0.445 m and a height of 0.293 m, representing a super-large cross-section tunnel under scaled conditions based on a geometric similarity ratio of 1:64. An opening corresponding to the tunnel cross-section (0.445 m×0.293 m) was precut into the plexiglas panel to allow for chamber excavation. The center of the opening was located 0.600 m from the top and 0.357 m from the bottom of the panel.
Figs. 3 and 4 provide the detailed design dimensions and a photograph of the experimental setup.
Fig. 3Design dimensions of the model container (in millimeters)
a) Top view showing the planar dimensions
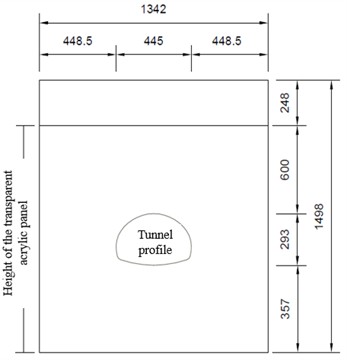
b) Front view highlighting the internal observation area
Fig. 4Physical photographs of the model container. Image credit: Xukai Tan, State Key Laboratory of Mountain Bridge and Tunnel Engineering, 2025
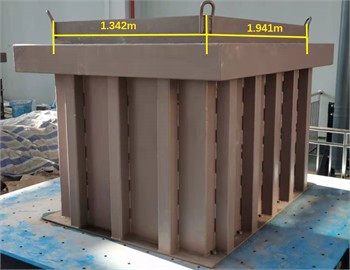
a) The external appearance of the container
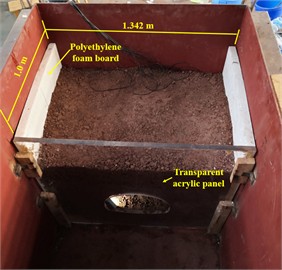
b) The internal configuration of the container
3.4. Testing scheme and sensor arrangement
In this shaking table test, the accelerometers serve as the primary sensors that acquire the seismic acceleration responses of the surrounding soil at critical locations around the tunnel's perimeter. Key measurement points include the vault, haunch, springing, midpoint of sidewall, invert springing, invert haunch, invert bottom. The sensor layout is depicted in Fig. 5.
3.5. Testing procedure and model construction
To accurately represent the mechanical behavior of the tunnel, the initial stress state of the soil mass and the stress relief resulting from tunnel excavation were simulated in the testing process. A shaking table model test was then performed under these initial stress conditions to investigate the tunnel’s seismic instability characteristics. The testing procedure consisted of the following steps:
1) Preparation of model soil.
As a mechanistic and exploratory study, this work aims to elucidate the relationship between the instability of geomaterials – treated as nonlinear materials – and the LURR. The present research constitutes an initial phase in this direction, focusing on controlled variables, systematic phenomenon observation, and the establishment of semi-quantitative correlations. To accurately reflect the genuine mechanical behavior of soil, all experiments employed actual undisturbed soil. A stringent protocol for source and process control was implemented to ensure high repeatability and comparability of the physical and mechanical states across all test groups. This approach guarantees that any observed differences are exclusively attributable to the predefined experimental variables, rather than to material heterogeneity.
To maintain consistency among specimens within each test series, all soil material was obtained from a single stockpile originating from the same location and depth. Prior to testing, the undisturbed soil was uniformly crushed and sieved (using a 5 mm sieve), thereby eliminating macroscopic variations in particle composition and initial clump structure. After crushing and sieving, the soil was air-dried under laboratory conditions until its apparent state stabilized, after which it was uniformly sealed and stored. All tests were performed under identical short-term, stable ambient humidity conditions to ensure relatively constant moisture content across different test groups.
Fig. 5Layout of measuring points
a) Schematic diagram of monitoring cross-section locations
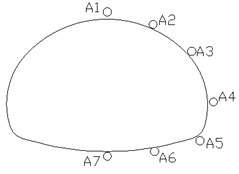
b) Measuring point arrangement within a cross-section
2) Filling of model soil and pre-embedding of acceleration sensors.
To achieve consistent soil property parameters in each test, a layered filling method was adopted, taking advantage of the homogeneity of the prepared raw model soil. Each layer was loosely spread to a nominal thickness of 10 cm and subsequently compacted using fixed compaction tools and a predetermined number of passes. Compaction consistency was controlled via material density; preliminary calibration tests correlating the degree of compaction with density indicated that each 10 cm loose layer was compacted to a final thickness of approximately 8 cm. To ensure integral bonding between successive layers, the surface of each compacted layer was scarified to an adequate depth before placing the next layer.
During the filling process, the acrylic tunnel opening section was positioned in place. Wooden strips were employed to compact the soil within the observation zone of the model box, ensuring uniform stratum compaction prior to excavation. Acceleration sensors were embedded concurrently with soil placement according to a predefined sensor layout, with reference to the position of the acrylic tunnel opening.
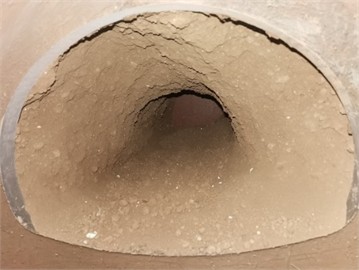
3) Excavation of the tunnel cavity.
After the model soil was filled and compacted, the acrylic opening section was removed. Using small iron shovels and other tools, the tunnel cavity was excavated according to the shape of the tunnel opening on the acrylic.
4) Shaking table vibration test.
The key aspect of the model test lies in establishing a reasonable initial stress state for the tunnel. On one hand, it is essential to ensure the self-stability of the soil during excavation; on the other hand, it is necessary to guarantee that the tunnel soil undergoes instability and collapse during the vibration process.
3.6. Test loading scheme
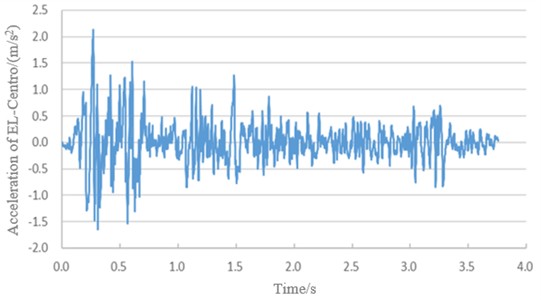
The ground motion used for this shaking table model test was the El Centro seismic record for the first 30 seconds. The original seismic wave was temporally compressed based on a time similarity ratio of 1/8, as shown in Fig. 6.
The seismic excitation was applied in the horizontal direction. A sequential loading protocol was implemented with peak acceleration amplitudes of 0.2 g, 0.4 g, 0.6 g, 0.8 g, 1.0 g, and 1.2 g. After each loading stage, the conditions of the cavern and tunnel were documented systematically to assess structural stability and identify failure mechanisms under varying levels of seismic intensity.
Fig. 6Acceleration time history of the EL-Centro wave
4. Analysis of shaking table failure test results for the tunnel
4.1. LURR results from shaking table model test
During the initial stage of the experiment, the tunnel’s gravitational field and full-face excavation procedure were simulated to reproduce in-situ stress conditions. Building upon this model, seismic wave loads were applied subsequently. The input acceleration of the shaking table was measured directly using an integrated table accelerometer. Meanwhile, the response accelerations at critical locations around the tunnel were captured via accelerometers embedded within the soil. Each load-unload micro-time interval was defined with a unit duration of 1.0 s. The recorded table acceleration was used to identify the loading and unloading phases. Specifically, an increase in the absolute acceleration value denotes loading, while a decrease indicates unloading. The LURR of the response accelerations at different positions around the tunnel under EL-Centro wave excitation were then computed.
The specific computational procedure is as follows:
1) The input seismic acceleration time history, , is discretized. The absolute variation of the input acceleration at each time point is calculated. Time intervals are then classified according to the sign of this variation: points with a positive variation are categorized as loading points, denoted as , whereas points with a negative variation are categorized as unloading points, denoted as . Correspondingly, the structural response value at a loading point time is defined as the loading response, , and the response value at an unloading point time as the unloading response, .
2) A duration of 1.0 s is defined as one complete loading-unloading cycle. The total 30 s seismic record is thus divided into 30 consecutive intervals. For the -th interval, the LURR is calculated using the following formula:
where and represent the number of loading and unloading points within the interval, respectively.
3) Using the calculated LURR for all intervals, the time-history curve of the LURR is constructed.
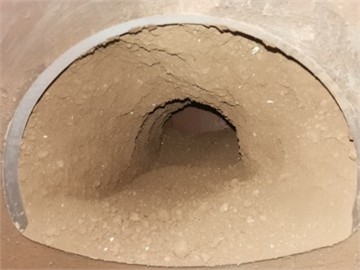
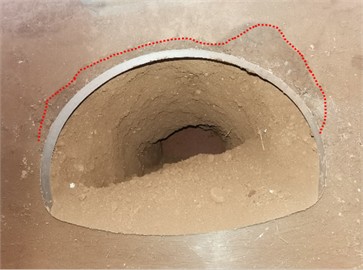
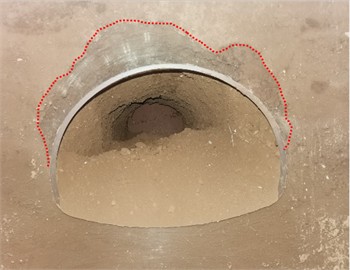
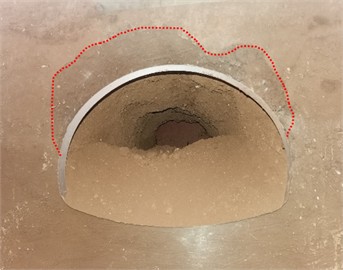
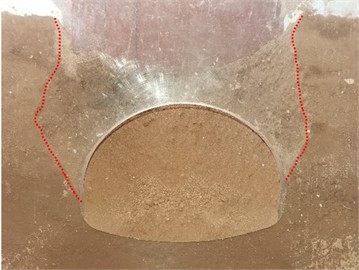
After each excitation, we examined the measurement area inside the container to document the stability conditions and failure patterns of the surrounding soil through annotations and photographs. Figs. 7-12 present the variations in LURR and stability states of the tunnel under varying seismic wave amplitudes, with failure modes delineated by red dashed lines.
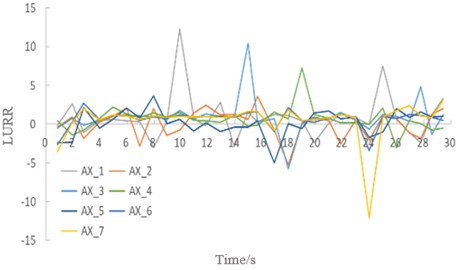
Fig. 7LURR and stability of the soil under seismic excitation with an amplitude of 0.2 g. Image credit: Xukai Tan, State Key Laboratory of Mountain Bridge and Tunnel Engineering, 2025

a) Time history curve of the LURR
b) Stability evolution of the soil
Fig. 8LURR and stability of the soil under seismic excitation with an amplitude of 0.4 g. Image credit: Xukai Tan, State Key Laboratory of Mountain Bridge and Tunnel Engineering, 2025
a) Time history curve of the LURR
b) Stability evolution of the soil
Fig. 9LURR and stability of the soil under seismic excitation with an amplitude of 0.6 g. Image credit: Xukai Tan, State Key Laboratory of Mountain Bridge and Tunnel Engineering, 2025
a) Time history curve of the LURR
b) Stability evolution of the soil
Fig. 10LURR and stability of the soil under seismic excitation with an amplitude of 0.8 g. Image credit: Xukai Tan, State Key Laboratory of Mountain Bridge and Tunnel Engineering, 2025
a) Time history curve of the LURR
b) Stability evolution of the soil
Fig. 11LURR and stability of the soil under seismic excitation with an amplitude of 1.0 g. Image credit: Xukai Tan, State Key Laboratory of Mountain Bridge and Tunnel Engineering, 2025
a) Time history curve of the LURR
b) Stability evolution of the soil
As illustrated in Figs. 7-12, the following observations can be made:
1) There is a clear correlation between the time-history curve of the LURR and the stability state of the soil.
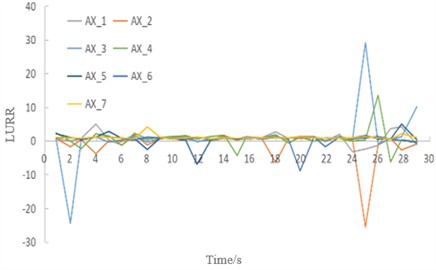
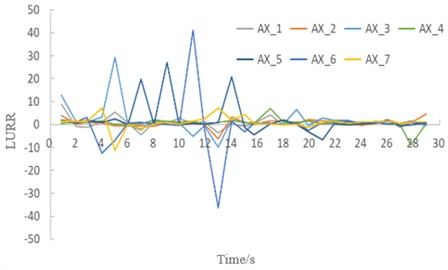
2) Under seismic intensities of 0.2-0.4 g, when the soil of the tunnel remains stable, the LURR oscillates at low values and maintains an overall steady state (see Figs. 7 and 8). Throughout this stage, the location corresponding to the maximum LURR (point 3# at the springing) and the time of its occurrence (25 seconds) remain constant as the seismic amplitude increases, while the magnitude of the maximum LURR increases.
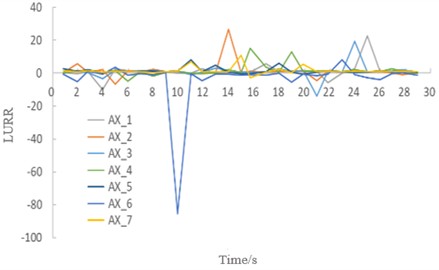
3) When regional failure occurs in the soil under higher seismic intensities (0.6-1.0 g), initial failure emerges at the location previously associated with the maximum LURR during the stable stage (i.e., the springing) and propagates progressively toward the crown region. Concurrently, LURR values in both the crown and sidewall regions increase continuously (Figs. 9-11). During this stage, the maximum LURR at the springing slightly reduces, the peak LURR location shifts dynamically, and the occurrence time advances.
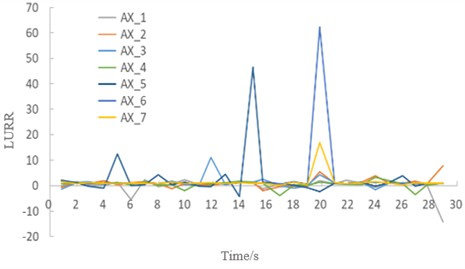
4) At a seismic intensity of 1.2 g, the soil collapses overall, accompanied by surface subsidence (Fig. 12). Under these conditions, LURR values across all monitored regions of the tunnel's soil demonstrate a pronounced increase.
Fig. 12LURR and stability of the soil under seismic excitation with an amplitude of1.2 g. Image credit: Xukai Tan, State Key Laboratory of Mountain Bridge and Tunnel Engineering, 2025
a) Time history curve of the LURR
b) Stability evolution of the soil
4.2. Correlation between LURR and tunnel stability in shaking table model tests
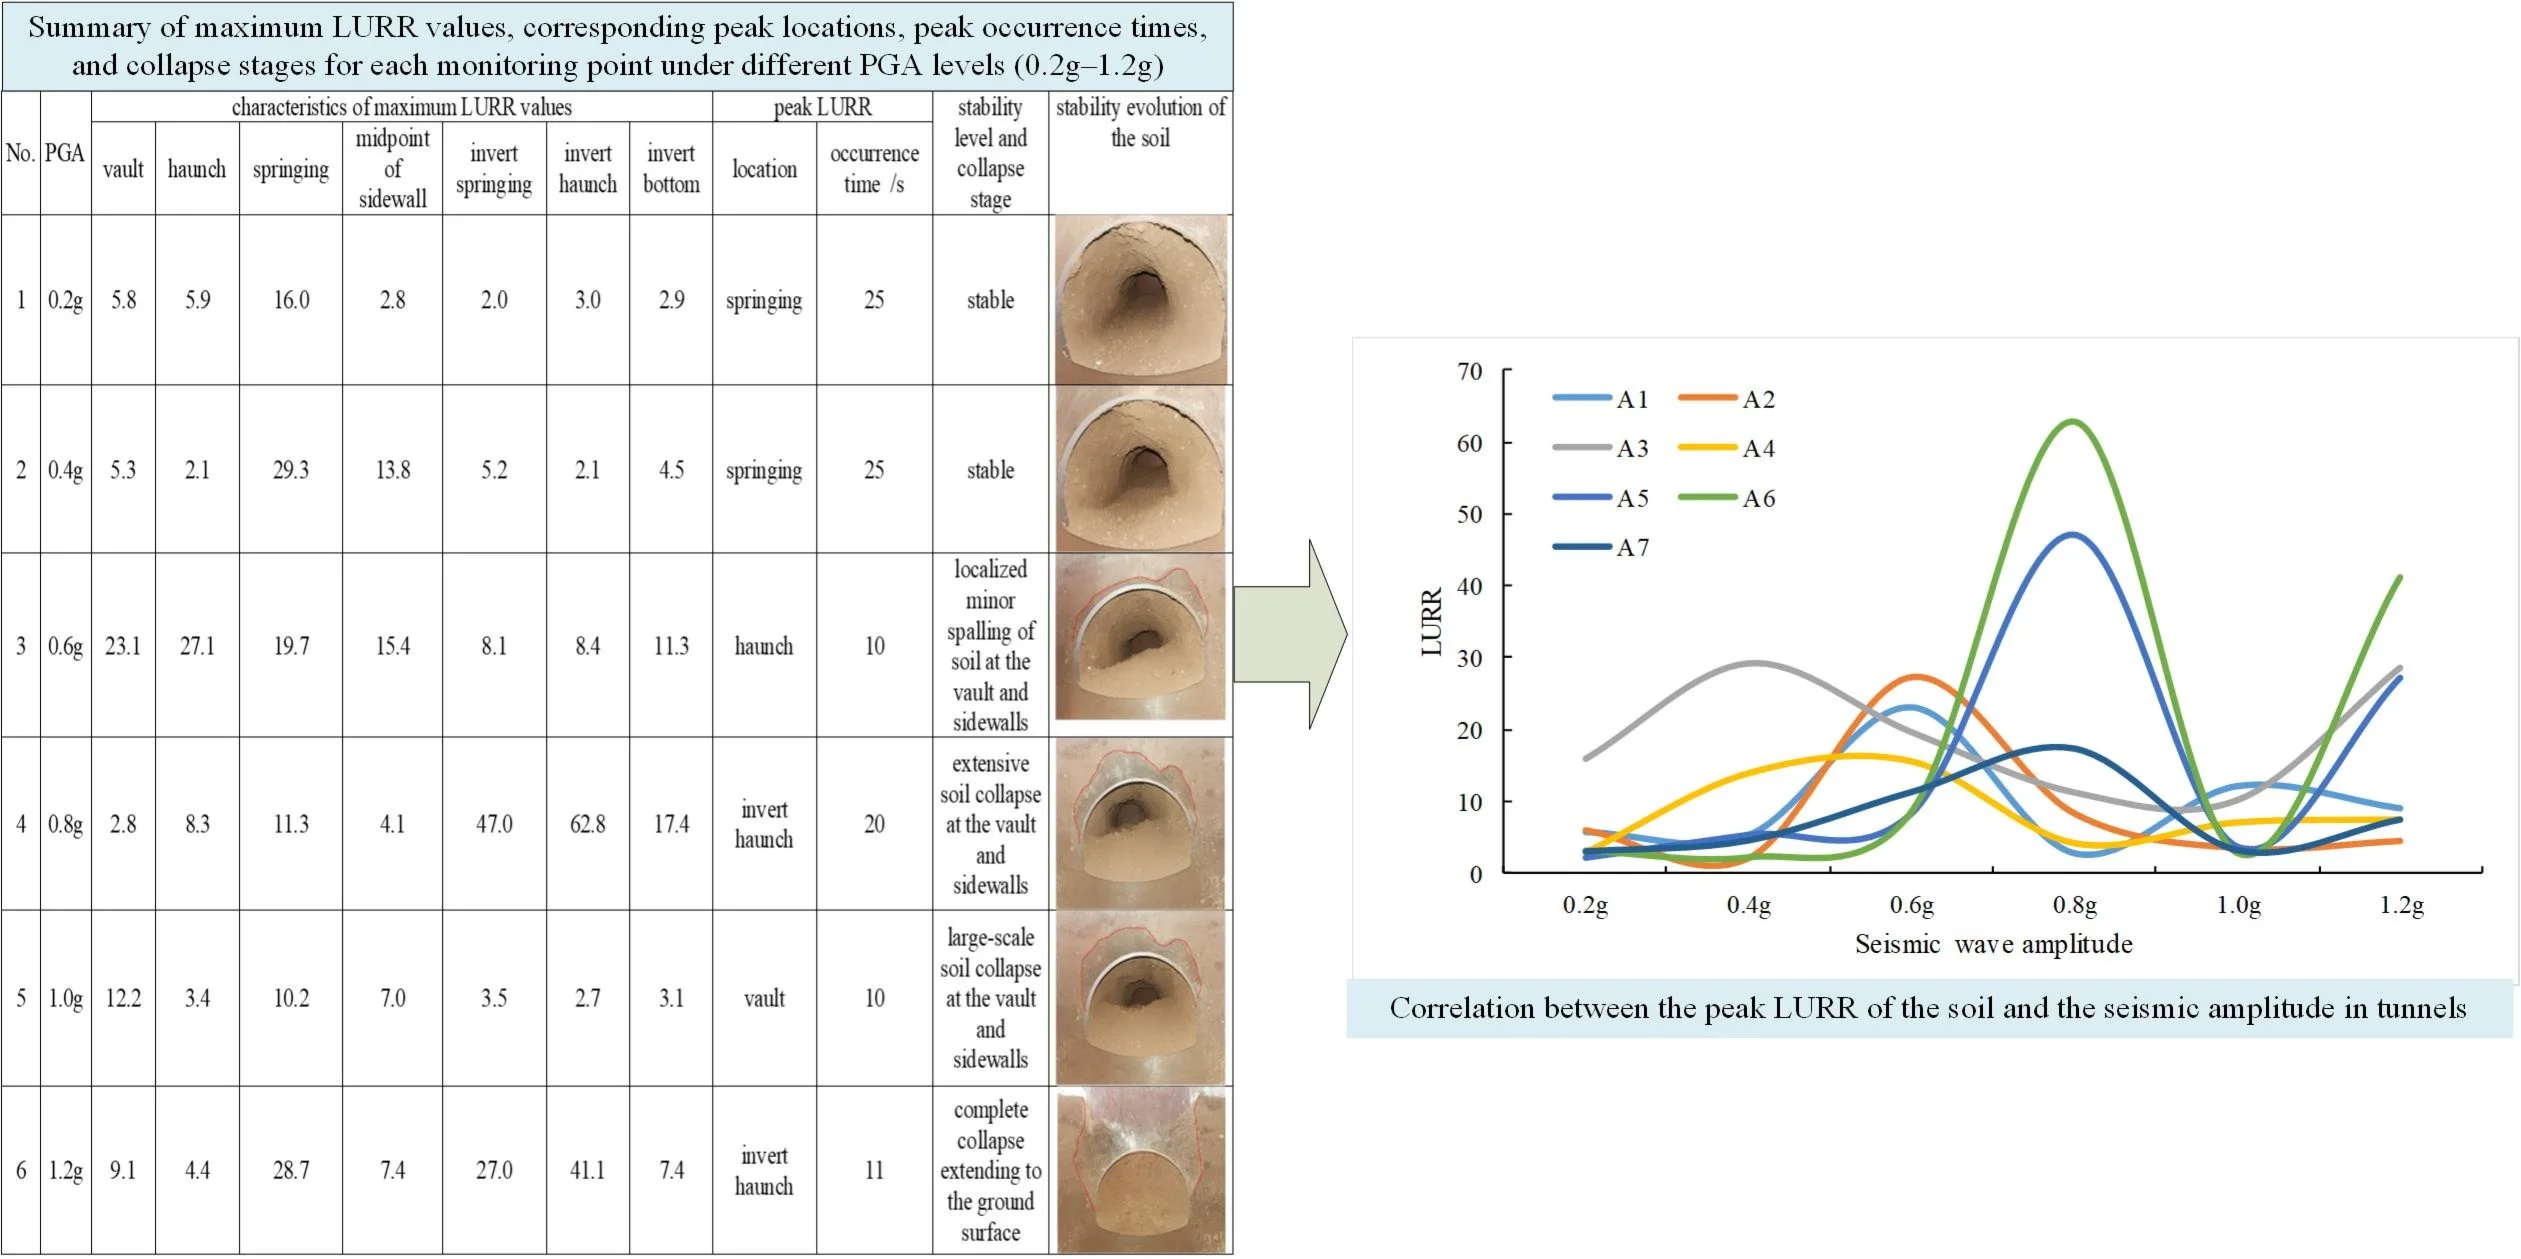
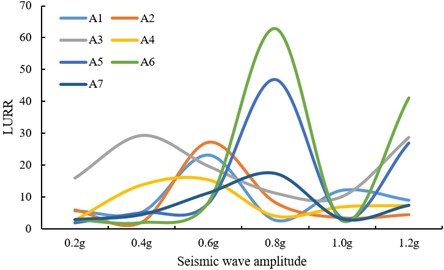
To further examine the relationship between LURR and tunnel stability, the variation of maximum LURR values at key locations in the soil was analyzed under increasing seismic amplitudes (see as Table 2 and Fig. 13).
Fig. 13Correlation between the peak LURR of the soil and the seismic amplitude in tunnels
As shown in Table 2 and Fig.13, the following observations can be drawn:
1) Across varying seismic amplitudes, the maximum LURR of the surrounding soil acceleration generally increases initially and then decreases with increasing seismic intensity. The positions corresponding to the peak LURR values shift progressively around the tunnel. In the present model, the sequence of occurrence is as follows: the springing (point 3#, 0.4 g) → the vault, haunch, and midpoint of sidewall (points 1#, 2#, 4#, 0.6 g) → the invert springing and invert haunch(points 5#, 6#, 0.8 g). This overall progression follows the order of increasing structural stability, which aligns essentially with the collapse sequence observed in shaking-table tests.
2) When the peak LURR values in the vault and sidewall regions (points 1-4#) attain their maxima and subsequently decline (at 0.6 g), local collapse occurs in the relatively weak vault and sidewall zones, transferring the main load-bearing function of the soil to the sidewall foot. As the peak LURR values in the sidewall foot area (points 5#, 6#) reach their maxima and then decrease (at 0.8 g), the collapse extends further, signaling precursor indications of overall failure. When the peak LURR values at multiple locations around the tunnel (points 3#, 5#, 6#) exhibit pronounced fluctuations (at 1.2 g), the tunnel system undergoes complete collapse, revealing a distinct behavioral mode. This phenomenon is attributed to the accelerometers being dispersed within the loosened collapsed soil, resulting in highly nonlinear responses.
In summary, the decline of the first regional peak LURR value, accompanied by a shift in its location, is identified as a criterion for assessing regional local instability of the tunnel. The decline of peak LURR values in two or more regional zones is established as a precursor warning criterion for overall tunnel instability.
Table 2Summary of maximum LURR values, corresponding peak locations, peak occurrence times, and collapse stages for each monitoring point under different PGA levels (0.2 g-1.2 g)
No. | PGA | Characteristics of maximum LURR values | Peak LURR | Stability level and collapse stage | |||||||
Vault | Haunch | Springing | Midpoint of sidewall | Invert springing | Invert haunch | Invert bottom | Location | Occurrence time / s | |||
1 | 0.2 g | 5.8 | 5.9 | 16.0 | 2.8 | 2.0 | 3.0 | 2.9 | Springing | 25 | Stable |
2 | 0.4 g | 5.3 | 2.1 | 29.3 | 13.8 | 5.2 | 2.1 | 4.5 | Springing | 25 | Stable |
3 | 0.6 g | 23.1 | 27.1 | 19.7 | 15.4 | 8.1 | 8.4 | 11.3 | Haunch | 10 | Localized minor spalling of soil at the vault and sidewalls |
4 | 0.8 g | 2.8 | 8.3 | 11.3 | 4.1 | 47.0 | 62.8 | 17.4 | Invert haunch | 20 | Extensive soil collapse at the vault and sidewalls |
5 | 1.0 g | 12.2 | 3.4 | 10.2 | 7.0 | 3.5 | 2.7 | 3.1 | Vault | 10 | Large-scale soil collapse at the vault and sidewalls |
6 | 1.2 g | 9.1 | 4.4 | 28.7 | 7.4 | 27.0 | 41.1 | 7.4 | Invert haunch | 11 | Complete collapse extending to the ground surface |
5. Conclusions
Shaking table failure tests were conducted to investigate the seismic response of unlined tunnels during an earthquake. The variation of the LURR under seismic loading was analyzed, as was its correlation with tunnel stability and critical instability conditions. The main conclusions are summarized below:
1) A computational model for LURR in tunnel seismic stability was established. In this model, the input seismic wave time-history load is defined as the loading/unloading input, while the acceleration responses at key points around the tunnel periphery – namely the vault, haunch, springing, midpoint of sidewall, invert springing, invert haunch, invert bottom – are taken as the loading/unloading responses. The LURR for the tunnel's seismic response is defined as the ratio of the total loading response to the total unloading response within a specified uniform micro-time-history interval.
2) As the seismic amplitude increases, the stability of unlined tunnels evolves through three distinct stages: stable bearing, localized collapse and overall collapse.
3) A correlation has been observed between the temporal variation of the LURR in the soil of a tunnel and the evolution of its stability. Under stable bearing conditions, the LURR oscillates at low magnitudes; however, the maximum LURR at the most vulnerable structural location increases as seismic amplitude rises. In instances of localized collapse, initial failure occurs at the springing – the region exhibiting the highest LURR during the stable phase – and propagates progressively towards the vault. Throughout this process, the LURR in both the vault and sidewall regions increases continuously, with peak values occurring earlier. Concurrently, the maximum LURR at the springing decreases slightly. When the soil of the tunnel experiences a comprehensive collapse extending to the ground surface, LURR values across all peripheral regions increase significantly. Based on the results of shaking table model tests, the occurrence of a maximum point in the preliminary LURR reaching an extreme value, along with a regional increase in the LURR, can serve as a precursor indicator for forecasting seismic instability in tunnels.
4) The results of the shaking table model test demonstrate that the decline of the first regional extreme point of the LURR, combined with the shift in its extremum location, can be adopted as a criterion for assessing regional local instability in tunnels. Furthermore, the decline characteristic exhibited by two or more regional LURR extreme points may serve as a precursor criterion for predicting the overall instability of the tunnel.
6. Limitations and future work
Although this study introduces a method for evaluating seismic instability of tunnels based on LURR, several limitations persist, which warrant further investigation in subsequent research:
1) The present analysis assumes an unlined tunnel structure. Future studies should incorporate lining models to examine their influence on the dynamic response of the tunnel under seismic loading.
2) Only horizontal unidirectional seismic excitation is considered herein. Subsequent work should account for vertical seismic components and multi-directional ground motion inputs to better represent real earthquake conditions.
3) The validity and generalizability of the conclusions drawn require verification through additional engineering case studies. Building upon multiple case datasets, a future early warning model will be developed that integrates dynamic evolution characteristics of LURR with statistically derived thresholds.
4) This study establishes a semi-quantitative relationship between LURR and soil instability. Systematic quantitative research is needed to elucidate the influence of key geotechnical parameters – such as cohesion, internal friction angle, saturation, and particle size distribution – on the evolutionary behavior of LURR and on the threshold values for instability early warning.
References
-
X. L. Du, Y. Li, C. S. Xu, D. C. Lu, Z. G. Xu, and R. Jin, “Review on damage causes and disaster mechanism of Daikai subway station during 1995 Osaka-Kobe Earthquake,” (in Chinese), Chinese Journal of Geotechnical Engineering, Vol. 40, No. 2, pp. 223–236, Feb. 2018, https://doi.org/10.11779/cjge201802002
-
H.-T. Yu, J.-T. Chen, Y. Yuan, and X. Zhao, “Seismic damage of mountain tunnels during the 5.12 Wenchuan earthquake,” Journal of Mountain Science, Vol. 13, No. 11, pp. 1958–1972, Oct. 2016, https://doi.org/10.1007/s11629-016-3878-6
-
L. Chen, J. Lei, and Y. Wang, “Liquefaction phenomena following the February 6th, 2023, Turkiye earthquakes: observation and lessons,” Natural Hazards, Vol. 120, No. 12, pp. 10709–10726, Apr. 2024, https://doi.org/10.1007/s11069-024-06623-z
-
N. A. Do, D. Dias, and P. Oreste, “2D seismic numerical analysis of segmental tunnel lining behaviour,” Bulletin of the New Zealand Society for Earthquake Engineering, Vol. 47, No. 3, pp. 206–216, Sep. 2014, https://doi.org/10.5459/bnzsee.47.3.206-216
-
A. Lakirouhani and M. Saberi, “Evaluation of analytical solutions and two-dimensional models in estimating the internal forces of tunnel lining against seismic loading, compared with three-dimensional analysis,” Arabian Journal of Geosciences, Vol. 15, No. 12, Jun. 2022, https://doi.org/10.1007/s12517-022-10385-y
-
M. Gharizade Varnusfaderani, “Analysis of cylindrical tunnels under combined primary near-fault seismic excitations and subsequent reverse fault rupture,” Acta Geodynamica et Geomaterialia, Vol. 14, No. 1, pp. 5–26, Aug. 2016, https://doi.org/10.13168/agg.2016.0024
-
X. Zhang, L. Song, H. Chen, S. Chen, Z. Hu, and Y. Li, “Shaking table test investigation on seismic performance of joint model of immersed tunnel,” Shock and Vibration, Vol. 2022, pp. 1–18, Mar. 2022, https://doi.org/10.1155/2022/1095986
-
G. Zhang, W. Zhang, J. Qi, R. Niu, and C. Zhang, “Seismic response analysis of anchor joint in shield-driven tunnel considering soil-structure interaction,” Applied Sciences, Vol. 12, No. 13, p. 6362, Jun. 2022, https://doi.org/10.3390/app12136362
-
“Specifications for tunnel seismic design,” Japan Society of Civil Engineers, Japan, 2017.
-
D. Park, T.-H. Lee, H. Kim, and J. Park, “Identification of damage states and damage indices of single box tunnel from inelastic seismic analysis,” Journal of Korean Tunnelling and Underground Space Association, Vol. 18, No. 2, pp. 119–128, Mar. 2016, https://doi.org/10.9711/ktaj.2016.18.2.119
-
Y. Wen et al., “The stability analysis of tunnel lining structure with seismic excitation based on the energy evaluation principle,” Shock and Vibration, Vol. 2021, No. 1, Jul. 2021, https://doi.org/10.1155/2021/9995682
-
X. C. Yin, Load/Unload Response Ratio Theory and Its Application. Beijing, China: Science Press, 2015.
-
W. G. Chen and K. Q. He, “Research progress of load-unload response ratio theory in the field of geological disaster forecast,” (in Chinese), Mechanics in Engineering, Vol. 37, No. 1, pp. 25–32, 2015, https://doi.org/10.6052/1000-0879-14-081
-
S. L. Li, M. J. Zhou, Z. P. Gao, D. X. Chen, J. L. Zhang, and J. Y. Hu, “Experimental study on acoustic emission characteristics before the peak strength of rocks under incrementally cyclic loading-unloading methods,” (in Chinese), Chinese Journal of Rock Mechanics and Engineering, Vol. 38, No. 4, pp. 724–735, Apr. 2019, https://doi.org/10.13722/j.cnki.jrme.2018.1410
-
T. Jiang, J. Ma, and B. Xu, “Dynamic analysis method of slope stability based on LURR theory,” (in Chinese), Chinese Journal of Rock Mechanics and Engineering, Vol. 26, No. 3, pp. 626–631, Apr. 2007, https://doi.org/10.3321/j.issn:1000-6915.2007.03.027
-
X. K. Tan, F. Gao, and W. Xu, “Static instability criterion and safety factor of tunnels based on loading/unloading response ratio,” (in Chinese), Chinese Journal of Geotechnical Engineering, Vol. 44, No. 9, pp. 1644–1653, Sep. 2022, https://doi.org/10.11779/cjge202209009
-
Q. Hui, F. Gao, X. Tan, and D. You, “Determining tunnel stability across fault zones under seismic loading based on load/unload response ratio theory,” Journal of Vibroengineering, Vol. 25, No. 7, pp. 1285–1304, Nov. 2023, https://doi.org/10.21595/jve.2023.23284
About this article

This work was supported by the Natural Science Foundation of Chongqing (Grant No. CSTB2023NSCQ-MSX0503), the Science and Technology Research Program of Chongqing Municipal Education Commission (Grant No. KJQN202500728), and the Science and Technology Research Project of Chongqing Education Commission (Grant No. KJZD-M202400702).
The datasets generated during and/or analyzed during the current study are available from the corresponding author on reasonable request.
Xukai Tan: conceptualization, methodology, software, formal analysis, writing - original draft, funding acquisition, resources. Maolei Ye: investigation, formal analysis, writing-review and editing. Zhengdong Chen: investigation, writing-review and editing. Guangping Lu: investigation, project administration. Feng Gao: resources, methodology, writing-review and editing. Hao Ding: Resources, methodology, writing-review and editing.
The authors declare that they have no conflict of interest.
