Abstract
The cone penetration test (CPT) is widely used because of its minimal soil disturbance, simplicity, low-cost and dual functionality for exploration and testing. However, conventional CPT technology encounters significant difficulty in dense sands, which limits its applicability. To address this challenges, a novel ultrasonic-assisted CPT probe was developed based on an ultrasonic-vibration drilling technique, a series of penetration tests were performed in sand with relative densities () ranging from 30 % to 90 % to quantify the effects of and ultrasonic vibration on penetration resistance and particle breakage. Besides, the particle breakage mechanism of sand and interaction between probe and sand under ultrasonic vibration were revealed. The results showed that the penetration load increases with . Ultrasonic vibration effectively reduced the penetration load, however, the reduction decreased from 60 % to 18 % as increased from 30 % to 90 %. As increases, particle breakage around the cone tip becomes more pronounced, with a higher breakage rate closer to the cone tip. Under the ultrasonic-static coupling, particle breakage was mainly caused by ultra-high-frequency impacts between particles and the cone tip, particles collided with each other, vertical and shear stress around the probe, The stress state of the sand and soil around the ultrasonic CPT probe was divided into five regions. This study introduces a novel ultrasonic vibration CPT probe, quantifies its penetration benefits in the dense sand, and reveals the particle breakage mechanisms under the ultrasonic-static coupling. The investigation will provide insights for applications of CPT in dense sands.
Highlights
- Design ultrasonic static penetration probe
- Compared with the traditional static penetration load of the static cone penetration test
- Revealing the particle crushing mechanism under static-vibration coupling
1. Introduction
The cone penetration test (CPT) is an efficient in-situ testing technology in geotechnical engineering and is widely used to assess foundation bearing capacity, classify soil strata, and evaluate liquefaction potential using real-time measurements of cone tip resistance () and sleeve friction resistance () [1]. Its standardized operating procedures and wealth of empirical correlations make CPT a core tool for site investigation under complex geological conditions [2]. However, conventional CPT faces significant limitations in dense sand or hard strata [3]. On the one hand, high penetration resistance causes probe wear and may even interrupt testing, compromising data continuity. On the other hand, the effect of particle breakage on the soil’s physical and mechanical properties is not yet well understood, resulting in systematic deviations in parameter interpretation based on classical elastoplastic theory.
In recent years, the vibratory pile driving technology have been developed rapidly [4-8]. Many studies have shown that vibratory pile driving can effectively reduce the penetration resistance of piles and increase the driving rate. Researchers have introduced vibration factors into soil-structure interaction model experiments to explore the impact of vibration on the mechanical properties of granular materials such as sand. For example, Denies et al. [9] conducted sphere penetration tests in vibrated sand. It is found that vibration significantly increases the sinking rate of the penetrator in the sand samples. Baptiste et al. [10] performed small-scale vibratory pile penetration tests with glass beads, it was found that pile base vibration caused localized fluidization of the surrounding glass material, reducing penetration resistance by a factor of about ten. Denies [11], [12] pointed out that when the vibration amplitude exceeds 1 g, vibration causes fluidization in the sand and leads to a complete loss of shear strength as the acceleration increases. The experimental results of Johnson [13], [14] showed that under vibration, local fluidization occurs in the shear band of granular materials, resulting in strength degration. Jiang [15] developed a soil-structure interface shear testing device capable of coupling high-frequency vibration with static shear, revealing the strength degradation behavior of granular material-structure interfaces under vibration. Ye [16] improved a triaxial apparatus and applied axial high-frequency vibration to sand specimens, observing a significant reduction in deviatoric stress accompanied by additional axial strain. In summary, the interaction between granular materials and structures under vibration conditions will change. However, in CPT, vibration is rarely taken into consideration to improve the feasibility in dense sands.
Until now, the ultrasonic rock-breaking technology in geotechnical engineering has demonstrated its feasibility for assisting penetration [17]. Researchers have developed a range of devices, including direct-drive ultrasonic drills, rotary ultrasonic-vibration drills, and high-frequency acoustic rotary-impact rock-breaking drills [18-20]. These devices operate on the principle that an ultrasonic transducer converts electrical energy into high-frequency mechanical vibrations, enabling efficient drilling. For example, Li [21] designed a rotary-impact ultrasonic sampler for lunar soil and permafrost resource development and conducted drilling tests in simulated lunar permafrost. The results showed that the average drilling force was reduced by 52 % under the application of ultrasonic vibration. These achievements provide a clear pathway for integrating ultrasonic technology into static penetration testing, it is expected to break through the technical limitations of CPT equipment in dense strata. Given the difference in loading mode, the mechanisms of resistance reduction in ultrasonic vibration CPT remain unclear.
In terms of the research on the penetration mechanism in sandy soil layer, the influence of particle breakage on the mechanical behavior of soil during the piling has been widely investigated. Many researchers have systematically investigated the distribution characteristics of the particle breakage zone at the pile tip through pile penetration tests. Based on visual observation technology and particle image velocimetry (PIV) detection, it was found that there is a conical “nose cone” particle breakage zone below the pile tip, the breakage in the zone is uneven, and the breakage mainly concentrated in the shear zone. Especially, the maximum breakage degree directly below the pile tip [22], [23]. The breakage zones in the sand can be classified into a severely fragmented shear zone, significantly breakage non-shear zone, and a moderately fragmented non-shear zone [24]. According to the Digital image correlation (DIC) and X-ray tomography, the fine particle shear bands and radial flow within the soil-pile interface was observed [25], [26]. The relationship between particle fragmentation and penetration resistance is a key research focus in pile foundations and static penetration testing (CPT). Areshed [27] conducted static penetration tests on three different types of crushable silica sands, whereas Peng [28] performed pile penetration tests on coral reef sand foundations. Both studies found that the penetration load was lower was lower for crushable sands than for non-crushable sands. In addition, Mao et al. [29-32] demonstrated experimentally that acoustic emission (AE) can effectively monitor the bearing behavior of piles. The time histories of multiple AE parameters were found to closely resemble the load-settlement curves of model piles, and the location and evolution characteristics of fragmentation during penetration could also be pinpointed. In recent years, the Discrete Element Method (DEM) has been widely used to simulate CPT of granular materials, enabling the reproduction of soil discontinuities and large deformations [33]. O. Falagush and colleagues [34] used DEM to study the effect of particle fragmentation on the cone resistance in CPT and found that the cone resistance in the fragmentable model was significantly lower than in non-fragmented model. Abouzar [35], Ge [36], Huang [37], and Song [38] conducted numerical simulations of static penetration tests in a calibration chamber and analyzed the factors influencing cone resistance from both macro-and micro-scales. These findings provide valuable insights for further understanding the penetration mechanism in CPT. However, most existing studies have focused on pile penetration. The combined effects of static loading and vibration- especially high-frequency vibration, have not been explored in the context of ultrasonic and static penetration (CPT). However, existing studies mainly focus on the static penetration, the particle-breakage mechanism under coupled static loading and high-frequency vibration remains unclear.
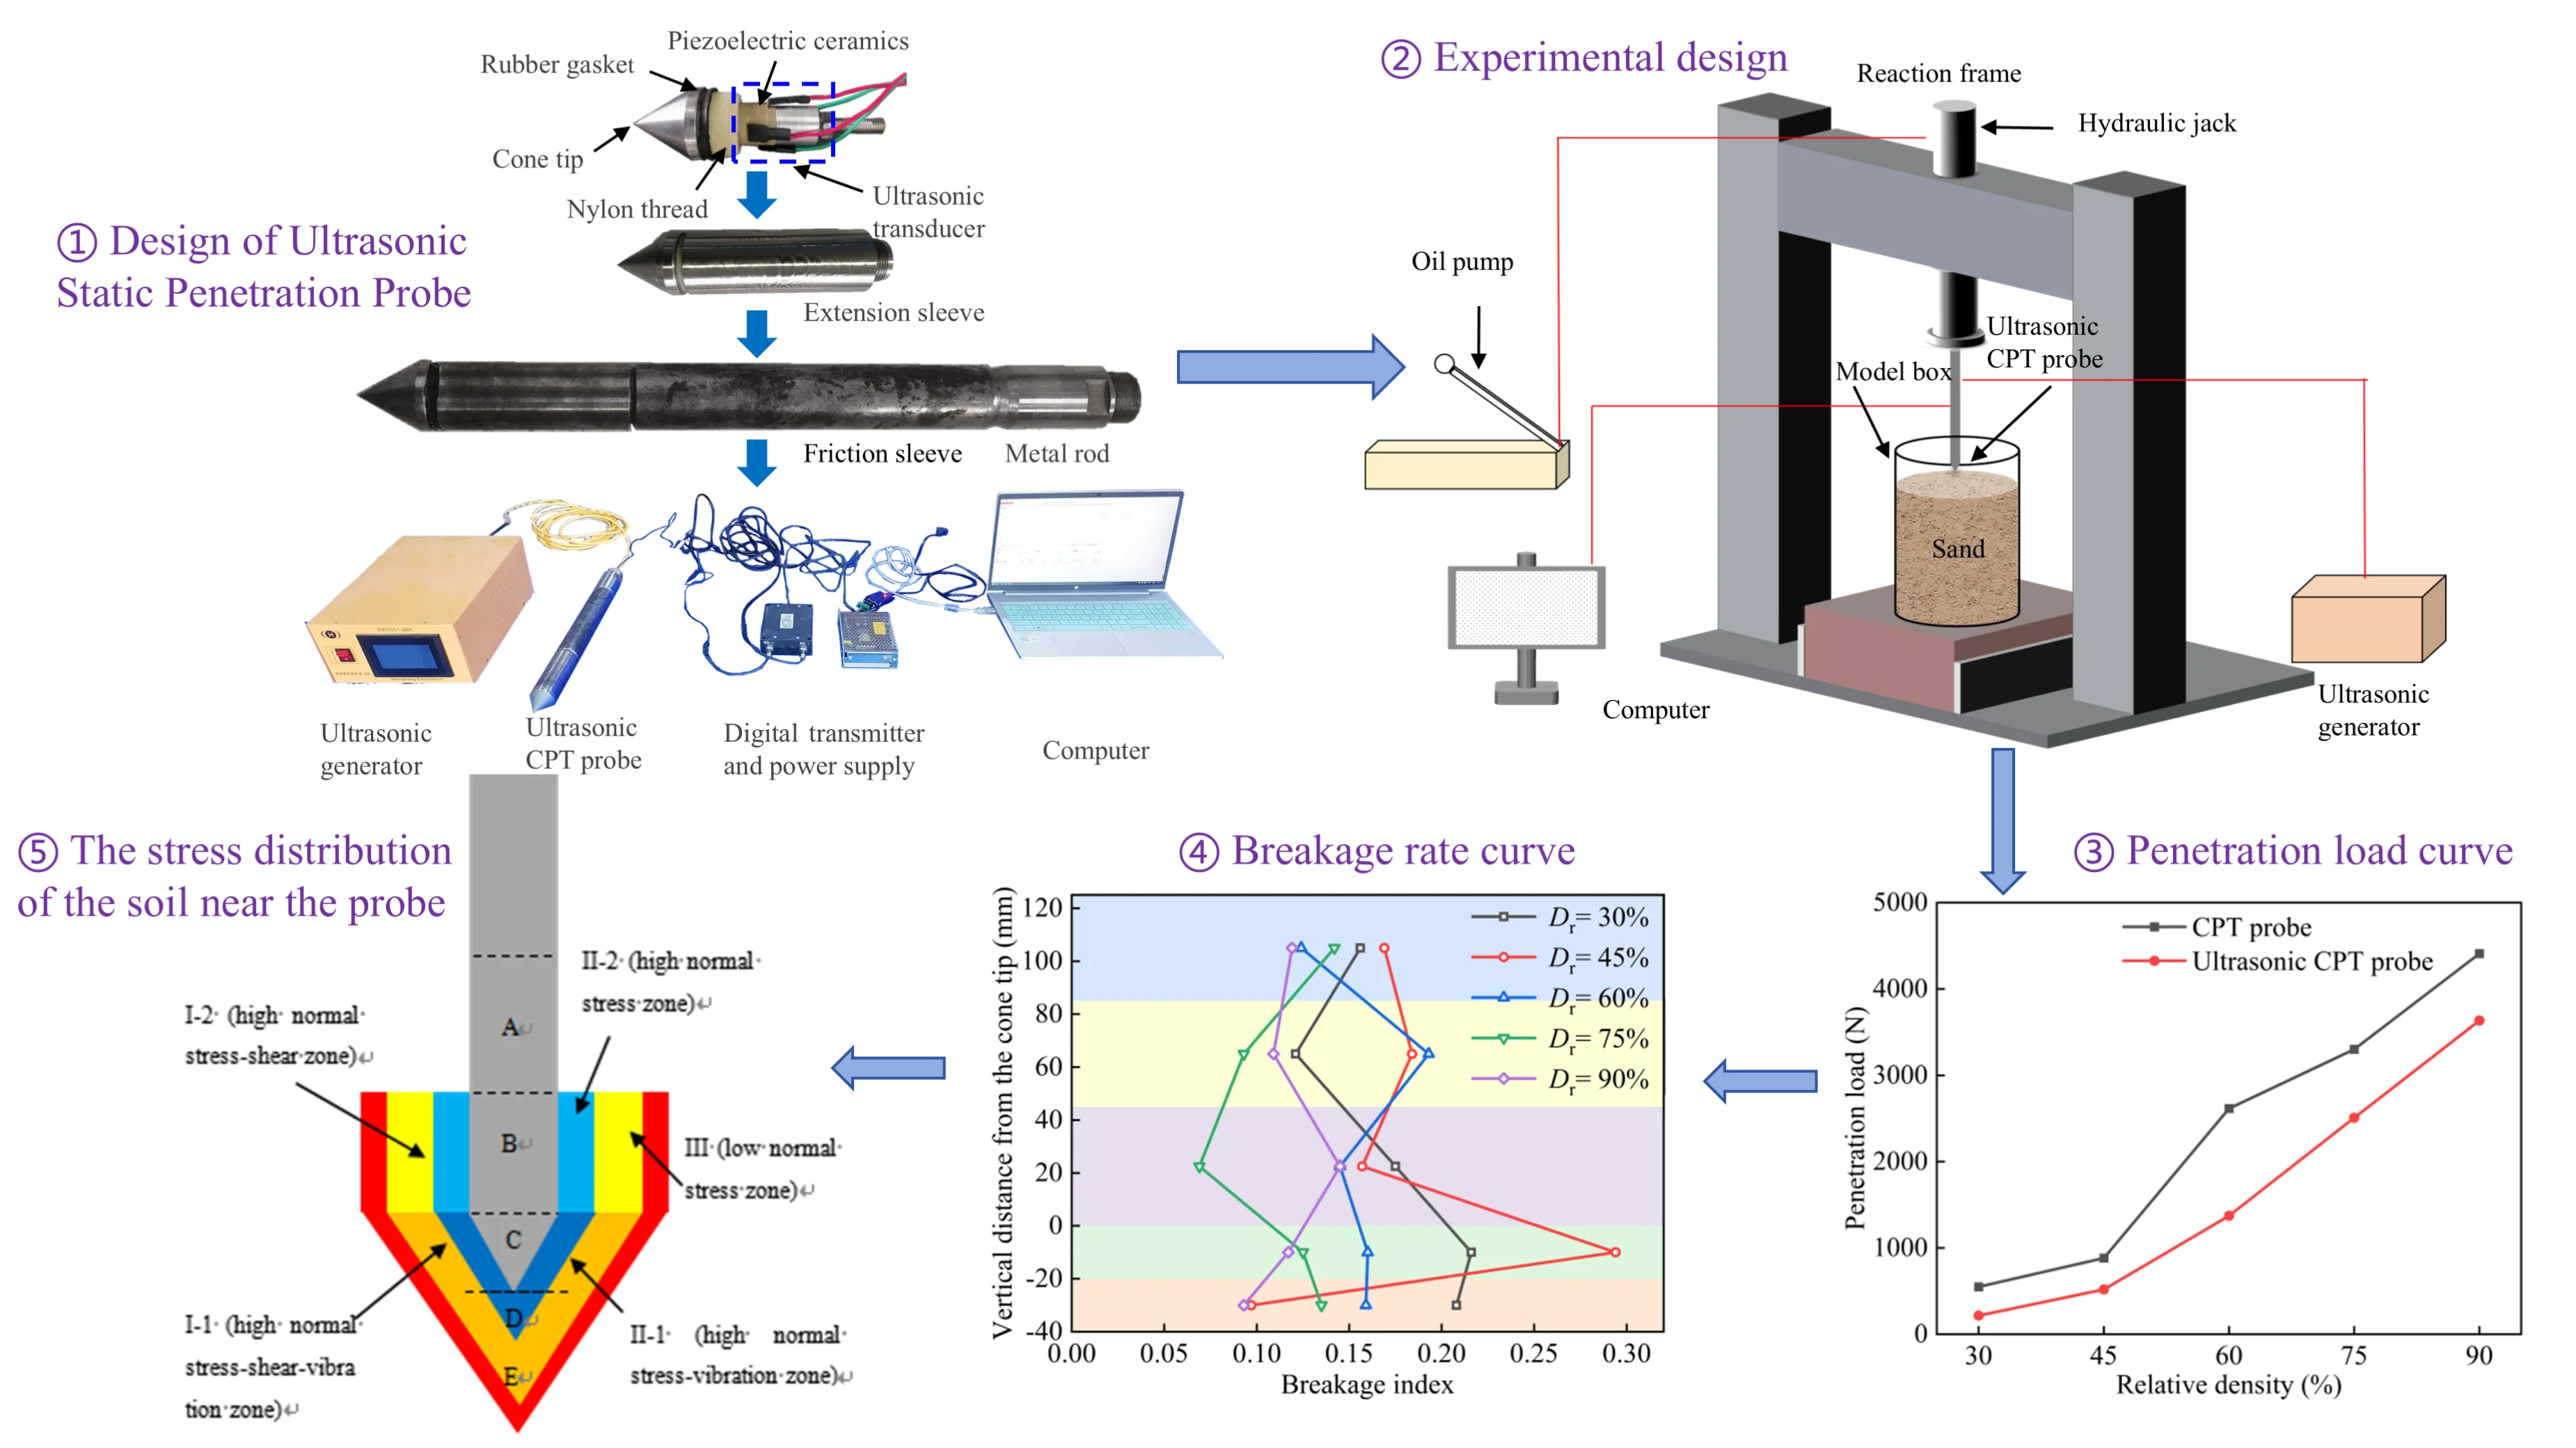
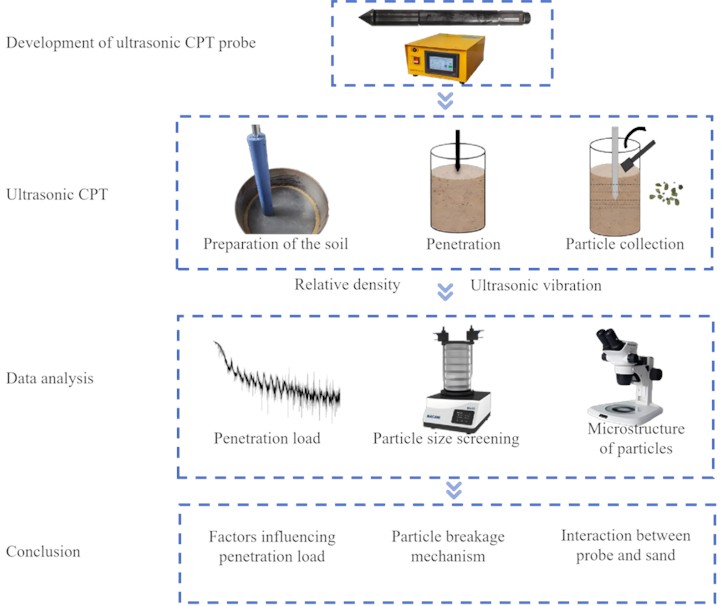
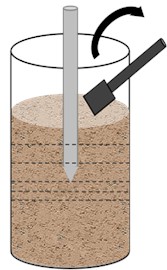
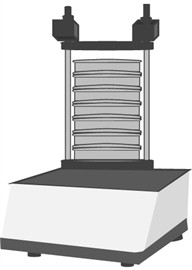
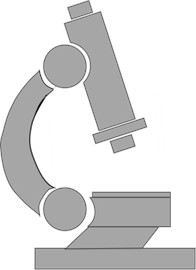
To enhance CPT penetration capacity, a novel ultrasonic CPT probe was developed in the study. Subsequently, ultrasonic CPT were conducted on the sand with different , the effectiveness of the device is verified. Subsequently, the effects of and ultrasonic vibration on the penetration load and the particle breakage were quantified. The particle-breakage mechanism under ultrasonic-static coupling and the probe-sand interaction under ultrasonic vibration were revealed. The research process is shown in Fig. 1. The main contributions of this study are as follows: (1) A new ultrasonic CPT probe was developed, achieving dual functions of dynamic and static cone penetration. (2) The influence of relative density of the sand and ultrasonic vibration on the penetration load of the ultrasonic probe was analyzed. (3) The particle breakage mechanism and stress state of the sand under the ultrasonic-static coupling were revealed.
Fig. 1Research process. The photos were taken by Yuanlong Li at Shaoxing University on March 10, 2024
2. Experimental methodology
This section describes the operating principle and procedures of the ultrasonic CPT probe. To verify the device’s feasibility, we conducted, a series of ultrasonic CPTs in sand at different relative densities.
2.1. The design of the ultrasonic CPT probe
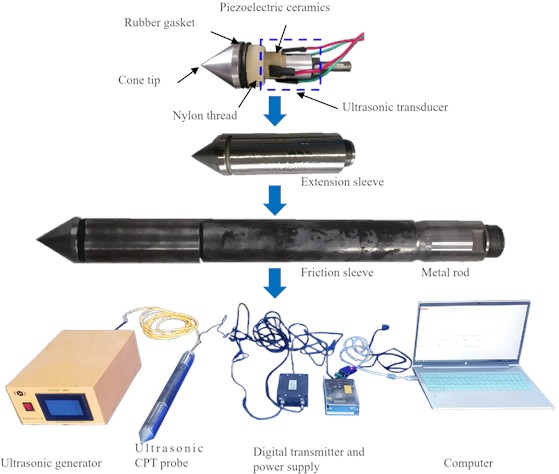
The structure of the ultrasonic CPT probe is shown in Fig. 2. The external dimensions of this probe are identical to those of the conventional dual-bridge CPT probe, with a total length of 475 mm and a diameter of 43.7 mm. The cross-sectional area and the cone angle of the tip are 15 cm2 and 60°, The outer diameter of the thread is 39 mm. The ultrasonic vibration unit is integrated within the CPT probe. The ultrasonic CPT probe consists of the cone tip, extension sleeve, ultrasonic transducer, ultrasonic generator, friction sleeve, metal rod and a sensor for measuring the total penetration resistance. The extension sleeve is a 110-mm-long stainless steel tube that connects the cone tip to the main body of the probe, with the ultrasonic transducer installed inside the extension sleeve. The ultrasonic transducer consists of front and rear cover plates, four PZT-8-type piezoelectric ceramics with an outer diameter of 25 mm, electrode slices, wires, and bolts. When powered, the ultrasonic generator rectifies and filters the 220 V (50/60 Hz) AC supply to 310 V DC, which is then converted into a specific high-frequency AC drive signal. The high-frequency signal is amplified to several kilovolts by the high-frequency transformer to drive the ultrasonic transducer. Under high-voltage, high-frequency excitation, the piezoelectric ceramic discs deform via the inverse piezoelectric effect, electrical energy is converted into mechanical vibrational energy. The transducer transmits the ultra-high frequency axial vibrations to the cone tip, thereby intensifying soil agitation around the tip during penetration, reducing the penetration resistance. The ultrasonic generator is equipped with a control module that tunes the operating frequency and power for penetration. To prevent the ultrasonic wave transmit to the probe body, a nylon threaded was installed at the outer layer of the cone tip, which concentrates the energy at the cone tip. Thereby minimizing measurement interference and improving the accuracy of the force sensor [40, 41].
Fig. 2Structure of the ultrasonic CPT probe. The photos were taken by Zhehong Shen at Shaoxing University on October 23, 2024
To measure the total penetration resistance, a sensor is mounted at the top of the probe. The sensor has a 50 kN capacity with an accuracy of ±0.5 %. The sensor operates based on resistive strain-gauge force measurement. When an axial load is applied to the load-bearing member in the sensor, the electric resistance is changed. According to the relationship between axial strain (Eq. 1), the strain is obtained. Subsequently, according to Eqs. (2-3), the penetration resistance is measured:
where is the nominal resistance, is the change in electric resistance, represents the gauge factor. is the effective area of load-bearing member, is Young’s modulus of the load-bearing member. and are strain and stress, respectively. is the total penetration resistance. To convert the small resistance variation into a measurable electrical signal, the gauges are wired in a Wheatstone bridge. With an excitation voltage , the bridge output voltage can be approximated for small strains as:
where is a configuration-dependent coefficient (for a full-bridge configuration, 1). Substituting Eq. (3) yields the force-voltage relation:
where, is the conversion coefficient provided by the manufacturer through static-load calibration, which is used to convert the output voltage of the acquisition system (after signal conditioning/amplification and data acquisition) into the total penetration load .
Due to the presence of the cone tip, the vertical penetration load is resolved on the cone surface into a normal component and a frictional component; the cone surface is subjected to the normal stress and friction characterized by the cone-soil friction coefficient , as shown in Fig. 3. The probe shaft is subjected to the horizontal normal stress and the corresponding shaft friction . Under simplified assumptions (Coulomb friction and an equivalent mean stress acting on the contact surface), the force equilibrium together with the probe geometry yields the following relationship between the cone resistance and the normal stress on the cone surface:
Considering an effective contact area at the cone tip (taken as the circular area with probe diameter ), the total cone-tip resistance is:
The unit shaft friction can be expressed in a Coulomb form as:
Fig. 3Forces acting on the probe
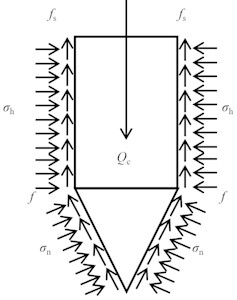
Accordingly, the total penetration load acting on the probe can be expressed as the sum of the cone-tip and shaft contributions:
It should be noted that the force sensor in this study directly measures the total penetration load (in N), which is used to evaluate the resistance-reduction effect of ultrasonic vibration.
The operating procedure of ultrasonic CPT is similar to that of the conventional CPT. During the test, the ultrasonic CPT probe is connected to the ultrasonic generator, and the CPT probe is steadily advanced into the soil with a rate of (20±5) mm/s. Total penetration load are monitored by sensors. When hard soil layers are encountered, the ultrasonic generator is activated to induce high-frequency vibrations at the cone tip. Depending on the geological conditions, parameters such as ultrasonic frequency, amplitude, and power can be adjusted accordingly to optimize penetration performance.
2.2. Ultrasonic CPT in dense sandy soils
2.2.1. Preparation of the sand specimen
The sand sample was collected from a river in Shaoxing, Zhejiang Province. Based on sieve test, the grain size distribution curve was obtained, as shown in Fig. 4. The median particle diameter was 0.447 mm, the coefficients of uniformity was 4.67, and the coefficient of curvature was 1.26. The maximum and minimum dry densities were measured using the vibration-hammer method and funnel-cylinder method, respectively. The maximum dry density was 1.96 g/cm3, and the minimum was 1.45 g/cm3. In the experiment, the sand was compacted in layers within a model box to simulate a sand foundation. To ensure uniform compaction, the sand was compacted in 10 layers, each 4 cm thick. Five different relative densities () were prepared for sand: 30 %, 45 %, 60 %, 75 %, and 90 %. The dry densities corresponding to the five relative densities were 1.57, 1.64, 1.72, 1.8, and 1.89 g/cm3, respectively. According to the density-volume relationship, the required masses for each target relative density were 78.92, 82.44, 86.46, 90., and 95 kg, respectively.
2.2.2. Experimental equipment
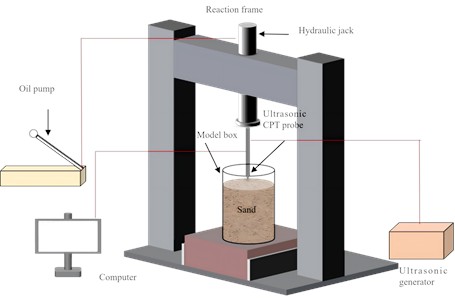
In this study, a series of ultrasonic CPTs were conducted to examine the effects of sand relative density and ultrasonic vibration on the penetration load of the ultrasonic probe and particle-breakage mechanism in sand. The experimental setup comprises an ultrasonic CPT probe, a model box, a loading system and load-monitoring system, as illustrated in Fig. 5. The model box is 40 cm in diameter and 50 cm in height. The loading system includes a reaction frame and a hydraulic jack with a maximum stroke of 600 mm. The hydraulic jack applies normal force to the ultrasonic CPT probe. The load-monitoring system consists of pressure sensors, a computer, and data-acquisition software.
Fig. 4The particle distribution curve of the river sand
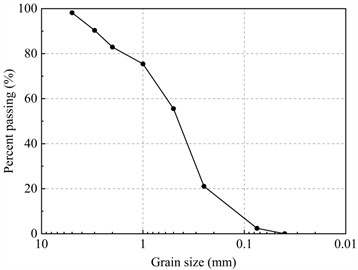
Fig. 5Schematic diagram of the experimental setup
2.2.3. Experimental process
The ultrasonic CPT procedure for dense sandy was as follows:
(1) The sand was compacted in 10 layers to the target relative density until the total height reached 400 mm. After that, the sample was then allowed to stand for 12 hours to achieve a uniform stress distribution in the sand (Fig. 6(a)).
(2) The ultrasonic CPT probe, ultrasonic generator, and computer were connected. The sensor sampling frequency was set to 10 Hz, and the ultrasonic frequency was set to 30.71 kHz before loading.
(3) After the preparation, the ultrasonic CPT probe was advanced into the sand by the hydraulic jack at a rate of 2 mm/s. At the same time, the ultrasonic generator and load-acquisition software were activated simultaneously. The sum of the cone resistance and sleeve friction was recorded. When the penetration depth reaches 160 mm, the test terminated, and the ultrasonic generator and load-monitoring system were switched off (Fig. 6(b)).
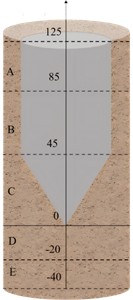
(4) After penetration, sand samples surrounding the ultrasonic CPT probe were collected (Fig. 6(c)). As shown in Fig. 7, regions around the cone tip were defined at distances of 85-125 mm (A), 45‐85 mm (B), 0‐45 mm (C), –20‐0 mm (D), and –20 to –40 mm (E) from the tip. The sand in A, B, C, D, and E were collected using ring cutters with a diameter of 61.8 mm. To facilitate sampling, the sand was moistened before the penetration of the ring cutters. The collected samples from each region were then placed in an oven at 70 °C and dried for 24 hours until completely dry.
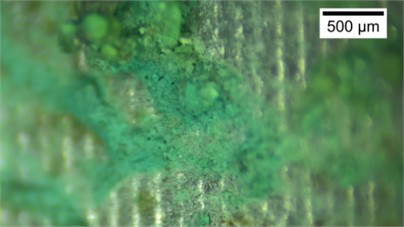
(5) Sieving tests were carried out on the sand samples. The microscopic of adhering to the probe sidewall in regions A, B, and C was observed under a stereomicroscope (Figs. 6(d-e)).
Fig. 6Schematic of ultrasonic CPT in sand
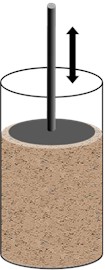
a) Layered compaction
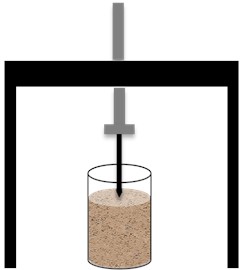
b) Penetration
c) Sampling the sand around the ultrasonic CPT probe
d) Sieving tests
e) observation of the microstructure of sand grains
Fig. 7Schematic diagram of excavation regions
3. Effect of relative densities of the sand on the penetration load and particle breakage under the penetration of the ultrasonic CPT probe
This section examines the penetration load behavior from the perspectives of and ultrasonic vibration. First, the variation of penetration load-depth curves and penetration mechanisms under ultrasonic penetration at different is analyzed. Subsequently, conventional penetration and ultrasonic-assisted penetration are compared at the same relative density to quantify the resistance-reduction effect induced by ultrasonic vibration and its dependence on .
3.1. Penetration load under different relative densities
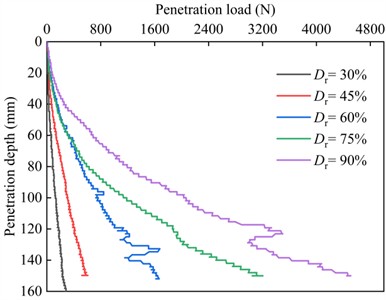
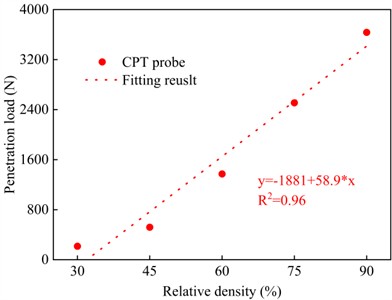
The variations of the penetration load with penetration depth for different relative densities are shown in Fig. 8(a), All curves exhibit a similar pattern trend across different relative densities, and can be divided into a linear stage and nonlinear stage. As increases, the penetration load increases gradually, with a greater rate of increase at higher . Taking a depth of 140 mm as an example, Fig. 8(b) plots penetration load versus . When 30 %, 45 %, 60 %, 75 %, and 90 %, the corresponding penetration loads were 215.6 N, 519.4 N, 1372 N, 2508.88 N, and 3635.8 N, respectively.
The results indicate that the penetration load increases with the increasing . This is because both the internal friction angle and the shear strength of sand increase with relative density [42, 43], and higher strengthens the soil’s force-chain network, thereby increasing the penetration load. At the initial stage of loading, the penetration load increases linearly with depth, and the sand particles around the probe are compressed [31, 44]. Sandy with low relative density has higher compressibility, providing more space for particle rearrangement and reorganization during penetration, resulting in a longer linear stage. In contrast, sandy with high relative density has lower compressibility, and more tightly packed particles, making particle motion difficult and shortening the duration of the linear stage. As the penetration depth increases, the penetration load rises nonlinearly, with a gradually increasing slope. During this stage, the shear load applied by the probe causes plastic deformation and particle fragmentation in the surrounding sand [30]. According to Coulomb’s law, the shear strength of sand is proportional to the normal stress on the shear plane. Sliding friction between particles and the interlocking of rough surfaces generate frictional resistance, which increases with . As increases, soil porosity decreases, the contact area between the soil and the probe increases, and the particles become more tightly packed. This increases the normal stress between particles and the internal friction angle, thereby enhancing the shear strength of the soil. Therefore, a greater penetration load is required to penetrate sand at high . Additionally, fluctuations are observed in the penetration curves for 60 %, 75 %, and 90 %, which can be attributed to the layered artificial compaction of the sand. At higher , compaction is more challenging, make it difficult to ensure uniformity.
Fig. 8Penetration load acting on the CPT probe at different relative densities
a) Penetration load- depth curve
b) Relative density-penetration load curve
3.2. Penetration load under static load and ultrasonic vibration
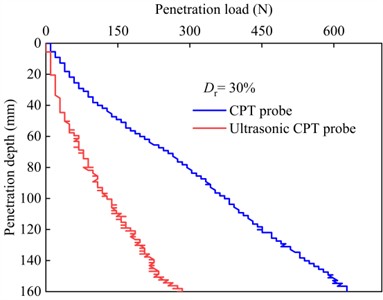
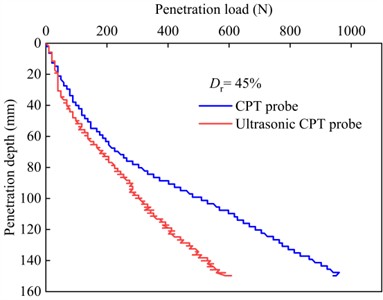
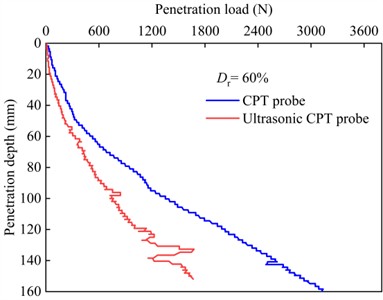
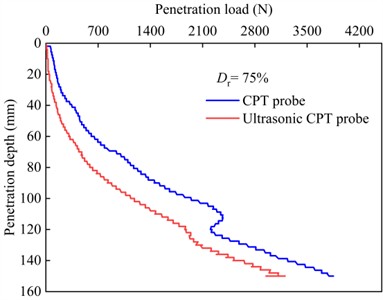
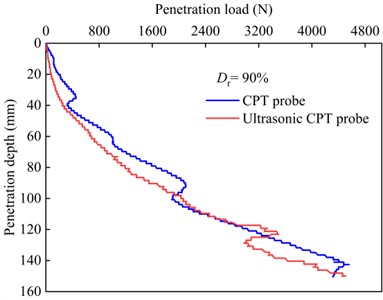
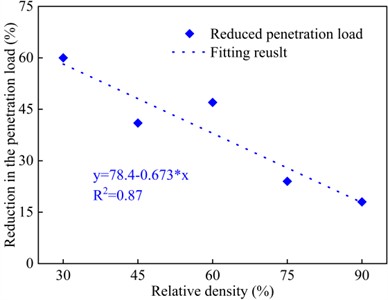
The variations of the total penetration load with penetration depth for both the CPT and ultrasonic CPT probes in the sand at different relative densities are shown in Fig. 9. From the figure, it can be observed that the trend of the total penetration load under ultrasonic vibration is similar to that of the static CPT, the total penetration load increases with increasing the penetration depth. Furthermore, as shown in Fig. 10(a), at the same penetration depth, a higher relative density corresponds to a greater total penetration load. Additionally, under the ultrasonic vibration, the total penetration load is significantly reduced. However, as shown in Fig. 10(b), the reduction in penetration load decreases as the relative density of the sand increases. At a penetration depth of 140 mm, the total penetration load for ultrasonic CPT is reduced by 60.0 % for 30 %, 41.0 % for 45 %, 47.0 % for 60 %, 24.0 % for 75%, and 18.0 % for 90 %.
Fig. 9Curve of penetration load with depth for ultrasonic vibration probe and conventional probe
a) 30 %
b) 45 %
c) 60 %
d) 75 %
e) 90 %
The experimental results indicate that ultrasonic vibration effectively reduces penetration load, thereby enhancing the penetration capability of the CPT. However, compared to loose sand, the reduction in penetration resistance is smaller in high relative density sands. In both penetration modes, the probe is subjected to normal and shear stress, causing compression and shear deformation of the surrounding sand. Gong [39] utilized the DEM to clarify that under vibration, the contact normal anisotropy, normal contact force anisotropy, and tangential contact force anisotropy parameters of granular soil all decrease, leading to a reduction in the shear strength of the sand. During the vibratory penetration process, the high-frequency vibration of the cone tip causes particles in the contact area to rearrange, reducing the normal contact force between particles and the frictional force at the probe interface. The sand particles undergo fluidization [40-42], and the force chains between sand particles break [11], resulting in a local decrease in stiffness [43]. Therefore, the penetration load under vibratory conditions was observed to be lower than that under conventional penetration conditions.
Fig. 10Comparison of the penetration load of acting on the CPT probe and ultrasonic CPT probe at penetration depth of 140 mm
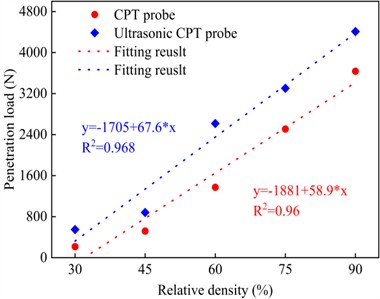
a) Penetration load-relative density curve
b) Reduction in the penetration load-relative density curve
Research has found that the degree of shear strength attenuation is significantly affected by the sample density. As the sample density increases, the weakening effect of vibration on the strength of sandy soil diminishes [44]. Denies [12] suggested that vibration causes particle collisions, generating a “shaking pressure” effect, which macroscopically resembles excess pore-water pressure in saturated soils. This effect reduces the internal friction angle of the sand and weakens the effective normal stress. In loose sand, the friction between the soil and the probe is lower, and the larger pores allow particles around the cone tip to move and rotate. During the penetration process, soil particles flow around the probe and collide, resulting in fragmentation. This combined effect significantly reduces the penetration load. In the penetration of high relative density sand, the friction between the soil and the probe is greater, and the influence of the cone tip vibration is limited to a smaller area. The smaller pore space and tighter particle contact restrict particle movement and rotation, increasing the strength of the force chains between particles [45-47]. This suppresses the strength attenuation caused by vibration, leading to limited particle fragmentation. As a result, the reduction in penetration load is less compared to that in low relative density sand.
4. Effect of ultrasonic vibration and relative densities on the broken mechanism of sand particles
Under ultrasonic vibration-static coupling, sand particles are broken, thereby reducing the penetration load. To reveal the particle breakage mechanism at different relative densities and ultrasonic vibration, we first investigated the microscopic structure of the sands grains adhering to the surface of the ultrasonic CPT cone tip, owing to the high stresses and intense vibration in this region. Subsequently, the sand particle breakage along the ultrasonic CPT probe was studied by the breakage index . Finally, a quantitative comparison of particle breakage between ultrasonic-assisted CPT and conventional CPT is conducted.
Fig. 11Microstructural characteristics and average particle size of the sands grains adhering to the cone tip at different relative densities. The photos were taken by Zhehong Shen at Shaoxing University on November 8, 2024
a) 30 %
b) 45 %
c) 60 %

d) 75 %
e) 90 %
f) Average particle size (mean ± standard deviation) of sand grains adhered to the cone tip
4.1. Particle breakage of the sand under different relative densities
4.1.1. Particle breakage of the sand adhered to the ultrasonic CPT probe tip
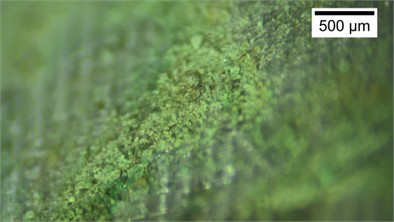
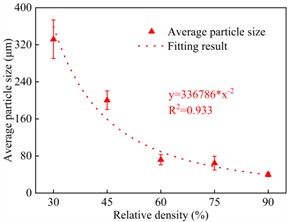
Figs. 11(a-e) show the microscopic structure of the sand grains adhered to the surface of the ultrasonic CPT cone tip at different relative densities. Based on the experimental results, approximately 100 particles were measured for each relative density using ImageJ, from which the mean particle size and the standard deviation were obtained (Fig. 11(f)). At 30 %, both broken and unbroken grains are present at the tip. Beneath the larger unbroken grains, numerous small broken grains (0.1-0.25 mm) are closely attached to the cone surface. The broken grains exhibit sharp edges (Fig. 11(a)), with an average particle size of 331.8±41.6 μm. At 45 %, the overall characteristics of the sand particles are similar to those observed at 30 %, with broken and unbroken particles coexisting, but the average particle size decreases to 200.3±20.3 μm (Figs. 11(b, f)). For 60 %-90 %, particle size of the sand decreases significantly, and the grains appear more extensively crushed (Figs. 11(c-e)), with mean sizes of 71.8±11.1 μm ( 60 %), 64.6±14.8 μm (75 %), and 39.7±4.4 μm ( 90 %). Apart from a few larger grains, most particles have been crushed into fine powder, indicating a more uniform degree of breakage.
The results indicate that dense sand facilitates particle breakage around the cone tip. As sand relative density increases, the contact area between the sand and the CPT probe increases, Ultrasonic vibration effectively crushes the sand surrounding the probe, thereby enhancing the penetration capability of the CPT probe in sand. XRD analysis revealed that the sand consists primarily of quartz, feldspar, and mica. Contacts between the mineral particles tight packing (frictional contacts) and cemented bonds. In dense sand, particles are packed more tightly than in loose sand. Under ultrasonic vibration loading, stress is transmitted through the cementing materials and particles, leading to local stress concentrations. When the stress exceeds the tensile or shear strength of the cementing bonds, particles are broken. Additionally, repeated ultrasonic loading induces fatigue damage in the cementing bonds, ultimately increasing particle breakage (Fig. 12).
Fig. 12Breakage of sand grains under ultrasonic vibration
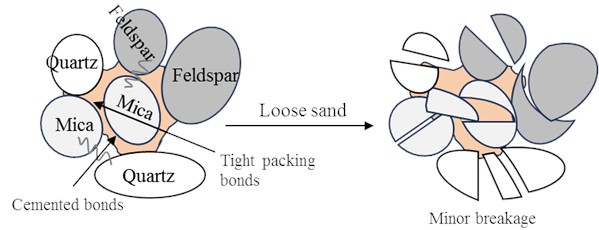
a) Loose sand
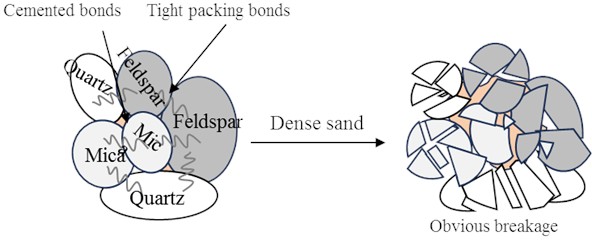
b) Dense sand
4.1.2. Sand particle breakage along the ultrasonic CPT probe
Under the combined effects of the penetration of CPT probe and ultrasonic wave, the sands surrounding the probe are broken. Currently, the breakage index is commonly used to define the degree of particle breakage. This index was first introduced by Marsal [48]:
where and are the mass percentage of particles in the size range before and after the breakage, respectively, is the total number of size ranges for a particle sample. stands for adding up the mass percentage from the largest particle to the smallest one.
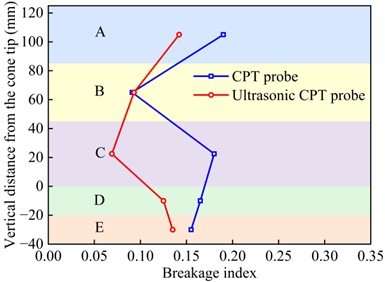
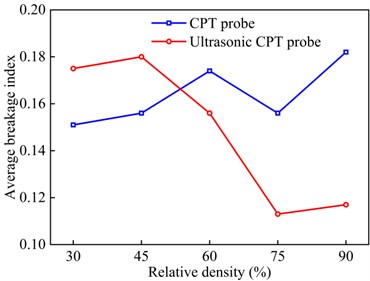
After sieving the sand samples from different regions, the breakage index () was computed for regions along the ultrasonic CPT probe. Fig. 13(a) illustrates the variation of with the mean depth of regions A-E at different realtive densities. The results indicate that generally increases with depth, with the highest value occurring in region D, adjacent to the cone tip. Additionally, the average breakage index for regions A-E was calculated at different relative densities. As shown in Fig. 13(b), the average breakage index generally decreases as relative density increases.
Fig. 13Particle breakage rate of sandy soil

a) Breakage indexes of sandy soil at different depths
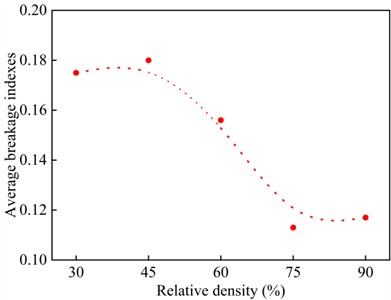
b) Average breakage indexes of sandy soil adjacent to the cone tip under different relative densities
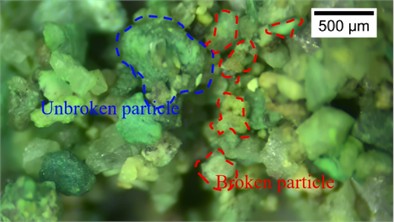
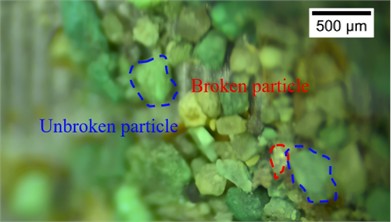
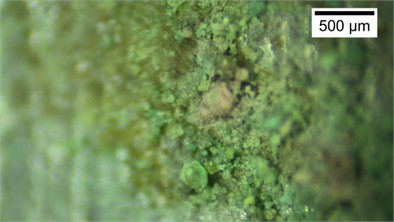
Fig. 14The microstructure of sand grains along the ultrasonic CPT probe (Dr= 75 %). There photos were taken by Zhehong Shen at Shaoxing University on November 8, 2024
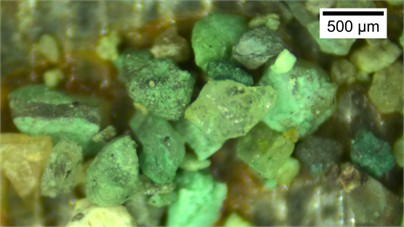
a) Region A
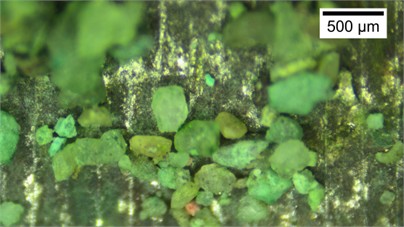
b) Region B
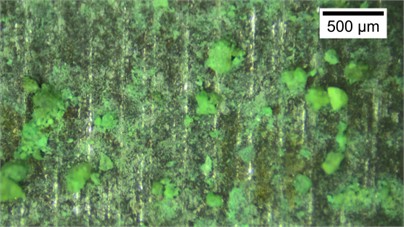
c) Region C
d) Region D
Since particle fragmentation primarily occurs near the CPT probe, we further analyzed its characteristics by examining the microstructure of sand grains adhering to regions A-C and the cone tip with a stereomicroscope after the penetration test. As shown in Fig. 14, using sand at 75 % as an example, in region A, unbroken sand grains with diameters of 0.2-0.5 mm were adhered to the probe surface (Fig. 14(a)). In region B, the adhering particles are generally smaller than those in region A, and broken sand grains with diameters of 0.074-0.25 mm were observed (Fig. 14(b)). In region C, numerous broken sand grains with diameters of 0.074-0.25 mm were observed, indicating significant breakage (Fig. 14(c)). At the cone tip, abundant sand powder was observed, exhibiting the smallest average particle size (Fig. 14(d)). Therefore, breakage is concentrated at the cone tip owing to the intense ultrasonic vibration.
4.2. Particle breakage characteristics under ultrasonic-static coupling
Similar to section 4.1.2, the breakage indexes for zones A, B, C, D, and E under CPT and ultrasonic CPT were calculated by Eq. (11), with the results shown in Figs. 15(a-e). Additionally, the average breakage indexes for zones A, B, C, D, and E for sand with different relative densities are presented in Fig. 14(f). Overall, under ultrasonic vibration, in zones A, B, C, D, and E gradually increases, which is consistent with the microstructures of the sand adhering to the CPT probe. However, the for ultrasonic CPT and CPT differ. Specifically, when 30 % and 45 %, the trends of under ultrasonic CPT are similar to those under CPT, increases with depth and reaching its peak in region D. Additionally, under ultrasonic CPT is generally higher than that under CPT (Figs. 15(a-b)). However, when 45 %, the in zone D (beneath the cone tip) is slightly lower under ultrasonic CPT than under traditional CPT. When 60 %, in zones D and E (beneath the cone tip) under ultrasonic CPT is slightly lower than that under CPT (Fig. 15(c)). When 75 % and 90 %, under ultrasonic CPT is significantly lower than that under CPT (Figs. 15(d-e)). As shown in Fig. 15 (f), when 30 % and 45 %, the average in regions A, B, C, D, and E under ultrasonic CPT are higher than those under CPT. In contrast, when 60 %, 75 % and 90 %, the average under ultrasonic CPT are lower than those under CPT.
5. Discussions
Base on ultrasonic CPT conducted in sand with different relative densities, we investigated the effects of relative density and ultrasonic vibration on the penetration load and particle breakage. Essentially, under the ultrasonic-static coupling, particles are prone to break, the interaction between the ultrasonic CPT probe and the sand is altered. Thus, cone-tip resistance and the friction between the probe and the sand decrease, thereby reducing load acting on the probe. In this section, we elucidate the particle breakage mechanism under the ultrasonic-static coupling. Subsequently, based on the experimental results, we investigated the probe-sand interaction under ultrasonic vibration.
5.1. Particle breakage mechanism under the ultrasonic-static coupling
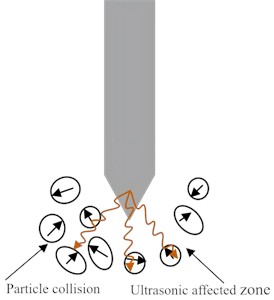
According to the experimental results, particle breakage mechanism under the ultrasonic-static coupling are illustrated in Fig. 16.
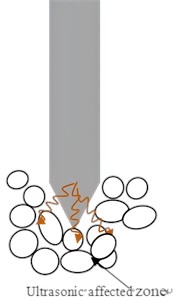
(1) Ultrahigh-frequency impacts between particles and the cone tip. The large voids between particles allow high-frequency vibrations of the sand under the ultrasonic excitation, causing particle movement and rotation (Fig. 16(a)). During motion, sand particles collide with the cone tip at high frequency, promoting particle breakage. The maximum acceleration of the vibrating cone tip is given by: . Substituting 1 μm and 30.71 kHz, the calculated maximum acceleration 3.7×10⁴ m/s2, which is far greater than gravitational acceleration . Under the influence of high acceleration, sand particles around the cone tip experience ultrahigh-frequency impacts, leading to localized breakage. The breakage increases sand compressibility, resulting in a reduction in penetration load.
Fig. 15Comparison of breakage index between CPT and ultrasonic CPT
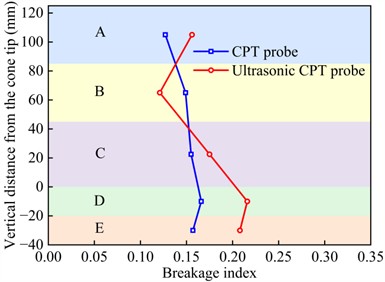
a) 30 %
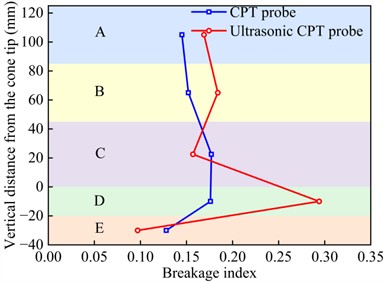
a) 45 %
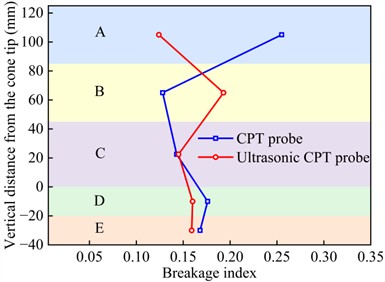
c) 60 %
d) 75 %
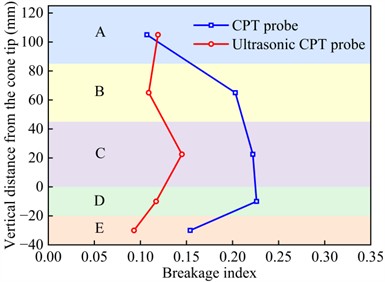
e) 90 %
f) Average breakage index
Particle breakage caused by ultrasonic vibration can be attributed to: (a) Stress-wave propagation: High-frequency stress waves generated by ultrasonic vibration propagate through the sand, creating localized high-pressure and low-stress zones between particles. The rapid variation in local stress weakens the frictional and cohesive forces between sand particles, thereby further promoting particle breakage. (b) Resonance effect: When the ultrasonic vibration frequency aligns with the sand’s resonance frequency of the sand, the internal vibration amplitude increases significantly, further reducing frictional forces between particles, making them more susceptible to breakage. (c) Fatigue-damage accumulation: Prolonged ultrasonic vibration induces fatigue damage in sandy soil. Under repeated vibrational loading, microcracks and pores within the sand particles gradually expand, eventually leading to structural failure of the soil. This cumulative fatigue damage process makes the sand particles more prone to breakage.
(2) Reduction in local sandy density near the cone tip due to ultrahigh-frequency vibration. Assuming the penetration velocity of the CPT probe. Under the vibration, the velocity of the probe varies between (, ). Given the ultrasonic vibration frequency 30.71 kHz and the amplitude 1 μm, the maximum vibration velocity of the cone tip can be calculated, 0.19 m/s. When the penetration velocity ), the relative velocity range between the cone tip and the surrounding sand falls within (, 0), indicating periodic separation between the cone tip and the sand. This separation, along with particle movement and rotation, results in a decrease in local sand density. Since the experimental penetration velocity satisfies the separation condition ( 0.19 m/s), the penetration load is reduced.
(3) Vertical stress and shear stresses from the CPT probe cause sand-particle breakage. In sand with medium to high relative density, the voids between particles are smaller, and particles are difficult to move and rotate under ultrasonic vibration. Consequently, high-frequency collisions between sand particles and the cone tip are suppressed. In high-density sand, the propagation range of ultrasonic waves is reduced, meaning that the outer soil layers are less affected by ultrasonic vibrations, leading to a lower breakage rate. At this stage, the primary effect of ultrasonic vibration is to loosen the compacted sand surrounding the probe (Fig. 16(b)).
Fig. 16Schematic diagram of the interaction mechanism between ultrasonic CPT probe
a) Loose sand
b) Dense sand
5.2. Interaction between probe and sand under ultrasonic vibration
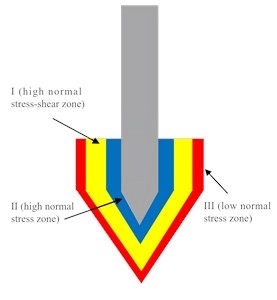
During penetration, the stress state of the sand surrounding the probe varies. According to observations by Yang et al. [24], [54], on particles in the cone-tip region, the area can be divided into three zones: Zone I (high-normal-stress-shear coexisting zone), Zone II (high-normal-stress zone) and Zone III (low-normal-stress zone) (Fig. 17(a)). Tovar-Valencia [54] found that fragmentation mainly occurs in Zones I and II during penetration. In Zone I, the sand is simultaneously subjected to both normal and shear stresses. Due to the relative movement of the surrounding sand, a shear band forms around the cone tip, within which significant fragmentation occurs [24. 54]. In Zone II, the normal stress is lower than in Zone I, and because sidewall friction is reduced, the sand in this zone is scarcely affected by shear stress. Previous studies have shown that particles are more prone to fragmentation under shear than under compression [55-57], consequently, the fragmentation rate in Zone II is lower than. In Region III, the normal stress further decreases, and it is primarily composed of unbroken sand and debris, which are migrated from Regions I and II through particle migration [54].
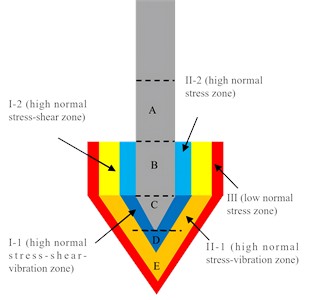
However, the stress state of the sand surrounding the ultrasonic CPT probe differs, and the can be further subdivided into: Zone I-1 (high normal stress-shear-vibration zone), Zone I-2 (high-normal-stress-shear zone), Zone II-1 (high-normal-stress-vibration zone), Zone II-2 (high-normal-stress zone) and Zone III (low-normal-stress zone) (Fig. 17(b)). In Zone I-1, sand beneath the cone tip experiences high normal and shear stress but also subjected to high-frequency ultrasonic vibration induced, leading to further breakage. Therefore, this zone is defined as the high-normal-stress-shear-vibration zone and corresponds to experimental regions C and D, where the overall sand breakage rate is relatively high. In Zone I-2, the stresses are similar to those in Zone I around the conventional CPT probe, sand is subjected to high normal and shear stress, but ultrasonic vibration is negligible. In Zone II-1, the sand is affected by both high normal stress and ultrasonic vibration, while the shear stress is negligible. The sand in Zone II-2 is subjected to high normal stress. Due to the limited propagation of ultrasonic waves, the stress conditions in Zone III are similar to those around a conventional CPT probe, normal stress is low and ultrasonic vibration is negligible.
Fig. 17The stress around the CPT probe during the penetration
a) Conventional CPT probe
b) Ultrasonic CPT probe
6. Conclusions
To overcome the limitation of the conventional CPT in dense sand layer, a novel ultrasonic CPT probe was developed based on ultrasonic drilling technology. To verify its effectiveness, a series of laboratory CPTs were conducted in sand at different relative densities, and the effects of relative density and ultrasonic vibration on penetration load and particle breakage were investigated. The key conclusions are as follows:
1) The ultrasonic CPT probe integrates an ultrasonic vibration unit into a dual-bridge CPT probe. The ultrasonic CPT probe consists of the cone tip, extension sleeve, ultrasonic transducer, ultrasonic generator, friction sleeve, metal rod and sensors. During penetration, ultrasonic vibration is transmitted to the cone tip, reducing the penetration load acting the probe.
2) The penetration load for both conventional and ultrasonic vibration penetration increases with the relative density of the sand. For conventional penetration, the load increases from 539 N at 30 % to 4410 N at 90 %; for ultrasonic-assisted penetration, it increases from 215.6 N at 30 % to 3635.8 N at 90 %. Ultrasonic vibration effectively reduces penetration load, thereby enhancing the CPT penetration capability. However, the load reduction is lower in dense sand compared to loose sand, the load reduction decreases from 60 % to 18 % when increases from 30 % to 90 %.
3) Increasing the relative density of the sand facilitates the particle breakage around the cone tip, the closer to cone tip, the higher the breakage rate. However, the average breakage along the probe is limited. Image-J statistics show that the mean size of grains adhered to the cone tip decreases from 331.9±41.6 μm (30 %) to 39.7±4.4 μm (90 %), indicating progressively stronger and more uniform breaking at higher relative densities. Under ultrasonic vibration, the breakage index exceeds that of conventional CPT probe at 30 % and 45 %, but becomes lower when 60 %.
4) The particle breakage mechanism under the ultrasonic-static coupling involves: (i) ultrahigh-frequency impacts between particles and the cone tip, (ii) a reduction in the local sand density of near the cone tip due to ultrahigh-frequency vibration, (iii) the effects of normal stress and shear stress around the probe.
5) The stress of the sand around the ultrasonic CPT probe can be further divided into: Zone I-1 (high-normal-stress-shear-vibration zone), Zone I-2 (high-normal-stress-shear zone), Zone II-1 (high-normal-stress-vibration zone), Zone II-2 (high normal stress zone) and Zone III (low normal stress zone).
Of course, there are still shortcomings in this study, and further works can be done:
1) Optimizing ultrasonic excitation parameters to further enhance resistance reduction in dense sands, such as frequency, amplitude, and power.
2) Particle Image Velocimetry (PIV), X-ray tomography and discrete element method (DEM) can be employed to quantitatively characterize the spatial evolution of the breakage zone and stress near the cone tip under vibration. Therefore, micro penetration mechanisms and macro penetration resistance can be combined together.
3) In-situ tests can be conducted in different soil types (silty sand and calcareous/coral sand) and varying saturation conditions to validate the engineering applicability of ultrasonic CPT probe.
References
-
Z. Wang, “The Chinese CPT and the prospect of penetration tests,” (in Chinese), Chinese Journal of Geotechnical Engineering, Vol. 22, No. 5, pp. 517–522, 2000.
-
Z. Cao et al., “A efficient optimization identification method for soil stratification based on cone penetration test and joint posterior distribution of variable dimensionality,” (in Chinese), Chinese Journal of Geotechnical Engineering, Vol. 47, No. 2, pp. 346–354, 2025, https://doi.org/10.11779/cjge20230715
-
L. Song, F. Y. Liu, and N. Li, “On mechanism of rotary cone penetration test,” (in Chinese), Rock and Soil Mechanics, Vol. 32, 2011, https://doi.org/10.16285/j.rsm.2011.s1.071
-
M. Martinelli, A. Tsetas, A. B. Fărăgău, A. Metrikine, and A. Tsouvalas, “Soil resistance during vibratory pile installation: Experimental findings from lab-scale tests,” Soil Dynamics and Earthquake Engineering, Vol. 199, p. 109692, Dec. 2025, https://doi.org/10.1016/j.soildyn.2025.109692
-
K. Rainer Massarsch, C. Wersäll, and B. H. Fellenius, “Vibratory driving of piles and sheet piles – state of practice,” Proceedings of the Institution of Civil Engineers – Geotechnical Engineering, Vol. 175, No. 1, pp. 31–48, Feb. 2022, https://doi.org/10.1680/jgeen.20.00127
-
S. Moriyasu, S.-I. Kobayashi, and T. Matsumoto, “Experimental study on friction fatigue of vibratory driven piles by in situ model tests,” Soils and Foundations, Vol. 58, No. 4, pp. 853–865, Aug. 2018, https://doi.org/10.1016/j.sandf.2018.03.010
-
Z. Qin, L. Chen, C. Song, and L. Sun, “Field tests to investigate the penetration rate of piles driven by vibratory installation,” Shock and Vibration, Vol. 2017, No. 1, pp. 1–10, Jan. 2017, https://doi.org/10.1155/2017/7236956
-
Z. Qin, L. Chen, C. Song, and J. Zhang, “Field tests for investigating the extraction rate of piles using a vibratory technique,” Journal of Shanghai Jiaotong University (Science), Vol. 23, No. 4, pp. 482–489, Aug. 2018, https://doi.org/10.1007/s12204-018-1971-4
-
N. Denies, J. Canou, J. Roux, and A. Holeyman, “Sphere penetration experiments in vertically vibrated sand,” in International Conferences on Recent Advances in Geotechnical Earthquake Engineering and Soil Dynamics, Vol. 16, May 2010.
-
B. Darbois Texier, A. Ibarra, and F. Melo, “Low-resistive vibratory penetration in granular media,” PLOS ONE, Vol. 12, No. 4, p. e0175412, Apr. 2017, https://doi.org/10.1371/journal.pone.0175412
-
N. Denies, J. Canou, J.-N. Roux, and A. Holeyman, “Vibrocompaction properties of dry sand,” Canadian Geotechnical Journal, Vol. 51, No. 4, pp. 409–419, Apr. 2014, https://doi.org/10.1139/cgj-2012-0436
-
N. Denies and A. Holeyman, “Shear strength degradation of vibrated dry sand,” Soil Dynamics and Earthquake Engineering, Vol. 95, pp. 106–117, Apr. 2017, https://doi.org/10.1016/j.soildyn.2017.01.039
-
P. A. Johnson, H. Savage, M. Knuth, J. Gomberg, and C. Marone, “Effects of acoustic waves on stick-slip in granular media and implications for earthquakes,” Nature, Vol. 451, No. 7174, pp. 57–60, Jan. 2008, https://doi.org/10.1038/nature06440
-
P. A. Johnson et al., “Dynamically triggered slip leading to sustained fault gouge weakening under laboratory shear conditions,” Geophysical Research Letters, Vol. 43, No. 4, pp. 1559–1565, Feb. 2016, https://doi.org/10.1002/2015gl067056
-
H. Jiang, L. Fu. S. Zhou, P. Guo, and W. Ye, “Experimental study on critical state strength characteristics of granular material-structure interface under high-frequency vibration,” (in Chinese), Rock and Soil Mechanics, No. 3, pp. 810–820, Mar. 2023, https://doi.org/10.16285/j.rsm.2022.0496
-
W. Ye et al., “Experimental study on dynamic characteristics of granular materials under axial high-frequency vibration,” Acta Geotechnica, Vol. 17, No. 8, pp. 3211–3227, Feb. 2022, https://doi.org/10.1007/s11440-022-01474-z
-
X. Wang, X. Wang, J. Wang, and Z. Tian, “Feasibility study and prospects of rock fragmentation using ultrasonic vibration excitation,” Applied Sciences, Vol. 10, No. 17, p. 5868, Aug. 2020, https://doi.org/10.3390/app10175868
-
M. Wiercigroch, J. Wojewoda, and A. M. Krivtsov, “Dynamics of ultrasonic percussive drilling of hard rocks,” Journal of Sound and Vibration, Vol. 280, No. 3-5, pp. 739–757, Feb. 2005, https://doi.org/10.1016/j.jsv.2003.12.045
-
J. Huang, H. Wang, G. Ji, F. Zhao, Q. Ming, and Y. Hao, “The rock breaking mechanism of ultrasonic high frequency rotary-percussive drilling technology,” (in Chinese), Petroleum Drilling Techniques, No. 4, pp. 23–29, Mar. 2018, https://doi.org/10.11911/syztjs.2018097
-
Z. Lu, J. Zheng, Z. Jiang, and F. Zhao, “An experimen tal study on rock breaking efficiency with ultrasonic high-frequency rotary-percussive drilling technology,” (in Chinese), Petroleum Drilling Techniques, No. 1, pp. 20–15, Mar. 2021, https://doi.org/10.11911/syztjs.2020126
-
Y. Li, L. Yang, X. Zhang, Y. Pang, and W. Bai, “Research on rotational-impact ultrasonic sampling technology for simulated lunar regolith permafrost,” (in Chinese), Journal of Space Science and Experiment, No. 3, pp. 35–45, Mar. 2025, https://doi.org/10.19963/j.cnki.2097-4302.2025.03.004
-
W. Mao, H. Hamaguchi, and J. Koseki, “Discrimination of particle breakage below pile tip after model pile penetration in sand using image analysis,” International Journal of Geomechanics, Vol. 20, No. 1, p. 04019, Jan. 2020, https://doi.org/10.1061/(asce)gm.1943-5622.0001535
-
D. J. White and M. D. Bolton, “Displacement and strain paths during plane-strain model pile installation in sand,” Géotechnique, Vol. 54, No. 6, pp. 375–397, Aug. 2004, https://doi.org/10.1680/geot.2004.54.6.375
-
Z. X. Yang, R. J. Jardine, B. T. Zhu, P. Foray, and C. H. C. Tsuha, “Sand grain crushing and interface shearing during displacement pile installation in sand,” Géotechnique, Vol. 60, No. 6, pp. 469–482, Jun. 2010, https://doi.org/10.1680/geot.2010.60.6.469
-
I. M. Silva, G. Combe, P. Foray, F. Flin, and B. Lesaffre, “Postmortem analysis of sand grain crushing from pile interface using X-ray tomography,” in Powders and Grains 2013: Proceedings of the 7th International Conference on Micromechanics of Granular Media, Vol. 1542, No. 1, pp. 297–300, Jan. 2013, https://doi.org/10.1063/1.4811926
-
J. Doreau-Malioche et al., “Characterising processes at sand-pile interface using digital image analysis and X-ray CT,” Géotechnique Letters, Vol. 9, No. 4, pp. 254–262, Dec. 2019, https://doi.org/10.1680/jgele.18.00232
-
M. I. Arshad, F. S. Tehrani, M. Prezzi, and R. Salgado, “Experimental study of cone penetration in silica sand using digital image correlation,” Géotechnique, Vol. 64, No. 7, pp. 551–569, Jun. 2014, https://doi.org/10.1680/geot.13.p.179
-
Y. Peng, Z.-Y. Yin, and X. Ding, “Micromechanical analysis of the particle corner breakage effect on pile load performance in coral sand,” Acta Geotechnica, Vol. 18, No. 12, pp. 6353–6370, Jun. 2023, https://doi.org/10.1007/s11440-023-01975-5
-
W. Mao, S. Aoyama, and I. Towhata, “A study on particle breakage behavior during pile penetration process using acoustic emission source location,” Geoscience Frontiers, Vol. 11, No. 2, pp. 413–427, Mar. 2020, https://doi.org/10.1016/j.gsf.2019.04.006
-
W. Mao, J. Chen, and L. Pan, “Acoustic emission characteristics during pile penetration process in coral sand,” (in Chinese), Journal of Engineering Geology, Vol. 32, No. 5, pp. 1872–1879, Oct. 2024, https://doi.org/10.13544/j.cnki.jeg.2024-0370
-
W. Mao, S. Aoyama, and I. Towhata, “Feasibility study of using acoustic emission signals for investigation of pile spacing effect on group pile behavior,” Applied Acoustics, Vol. 139, pp. 189–202, Oct. 2018, https://doi.org/10.1016/j.apacoust.2018.05.001
-
W. Mao, Y. Yang, W. Lin, S. Aoyama, and I. Towhata, “High frequency acoustic emissions observed during model pile penetration in sand and implications for particle breakage behavior,” International Journal of Geomechanics, Vol. 18, No. 11, p. 04018, Nov. 2018, https://doi.org/10.1061/(asce)gm.1943-5622.0001287
-
M. J. Jiang, D. Harris, and H. H. Zhu, “Future continuum models for granular materials in penetration analyses,” Granular Matter, Vol. 9, No. 1-2, pp. 97–108, Nov. 2006, https://doi.org/10.1007/s10035-006-0026-y
-
O. Falagush, G. R. Mcdowell, H. S. Yu, and J. P. de Bono, “Discrete element modelling and cavity expansion analysis of cone penetration testing,” Granular Matter, Vol. 17, No. 4, pp. 483–495, Jun. 2015, https://doi.org/10.1007/s10035-015-0570-4
-
A. Sadrekarimi and S. Hashemi, “Effect of boundary conditions on CPT calibration chamber tests,” International Journal of Geomechanics, Vol. 25, No. 3, p. 04025, Mar. 2025, https://doi.org/10.1061/ijgnai.gmeng-10376
-
Y. Ge, A. Zhou, M. Nazem, and Y. Deng, “Numerical simulation of cone penetration test by using CFD-DEM coupled analysis,” Acta Geotechnica, Vol. 19, No. 11, pp. 7635–7653, Jul. 2024, https://doi.org/10.1007/s11440-024-02369-x
-
X. Huang et al., “Effects of strain rate and softening on the cone-tip resistance of CPT in soft clay,” Marine Georesources and Geotechnology, Vol. 43, No. 10, pp. 1876–1887, Oct. 2025, https://doi.org/10.1080/1064119x.2024.2439047
-
Y. Song, X. Gu, J. Hu, and X. Z., “DEM-FDM coupled simulation of cone penetration tests in a virtual calibration chamber with sand,” Chinese Journal of Geotechnical Engineering, Vol. 47, No. 6, pp. 1249–1258, 2025, https://doi.org/10.11779/cjge20240172
-
J. Gong et al., “Exploring the microscale mechanics of shear strength weakening in granular soils induced by vibrations: A DEM study,” Powder Technology, Vol. 456, p. 120819, Apr. 2025, https://doi.org/10.1016/j.powtec.2025.120819
-
H. Jiang, S. Zhou, L. Fu, Y. Shan, N. Dai, and P. Guo, “Vibro-induced weakening of interface friction between granular materials and textured surfaces: An experimental study with a modified direct shear apparatus,” Soil Dynamics and Earthquake Engineering, Vol. 158, p. 107289, Jul. 2022, https://doi.org/10.1016/j.soildyn.2022.107289
-
H. Lastakowski, J.-C. Géminard, and V. Vidal, “Granular friction: triggering large events with small vibrations,” Scientific Reports, Vol. 5, No. 1, p. 13455, Sep. 2015, https://doi.org/10.1038/srep13455
-
K. A. Taslagyan, D. H. Chan, and N. R. Morgenstern, “Vibrational fluidization of granular media,” International Journal of Geomechanics, Vol. 16, No. 3, p. 04015, Jun. 2016, https://doi.org/10.1061/(asce)gm.1943-5622.0000568
-
E. Bauer, “Modelling of the pressure and density sensitive behaviour of sand within the framework of hypoplasticity,” Task Quarterly, Vol. 4, No. 3, pp. 367–387, Sep. 2000.
-
C. M. Bingham, D. A. Stone, N. Schofield, D. Howe, and D. Peel, “Amplitude and frequency control of a vibratory pile driver,” IEEE Transactions on Industrial Electronics, Vol. 47, No. 3, pp. 623–631, Jun. 2000, https://doi.org/10.1109/41.847903
-
B. Yuan et al., “Effect of sand relative density on response of a laterally loaded pile and sand deformation,” Journal of Chemistry, Vol. 2015, No. 1, p. 89121, Jul. 2015, https://doi.org/10.1155/2015/891212
-
L. Fu, S. Zhou, P. Guo, S. Wang, and Z. Luo, “Induced force chain anisotropy of cohesionless granular materials during biaxial compression,” Granular Matter, Vol. 21, No. 3, p. 52, Jun. 2019, https://doi.org/10.1007/s10035-019-0899-1
-
Y. Guo, C. Zhao, V. Markine, C. Shi, G. Jing, and W. Zhai, “Discrete element modelling of railway ballast performance considering particle shape and rolling resistance,” Railway Engineering Science, Vol. 28, No. 4, pp. 382–407, Aug. 2020, https://doi.org/10.1007/s40534-020-00216-9
-
R. J. Marsal, “Large scale testing of rockfill materials,” Journal of the Soil Mechanics and Foundations Division, Vol. 93, No. 2, pp. 27–43, Mar. 1967, https://doi.org/10.1061/jsfeaq.0000958
-
H. Z. Khaleel et al., “Measurement enhancement of ultrasonic sensor using pelican optimization algorithm for robotic application,” Indonesian Journal of Science and Technology, Vol. 9, No. 1, pp. 145–162, Nov. 2023, https://doi.org/10.17509/ijost.v9i1.64843
-
A. Taher Azar et al., “Optimized model predictive control for unmanned aerial vehicles with sensor uncertainties,” in 2022 International Conference on Control, Automation and Diagnosis (ICCAD), pp. 1–6, Jul. 2022, https://doi.org/10.1109/iccad55197.2022.9869421
-
F. Liu, L. Zhong, and Y. Zhong, “Effects of different particle arrangements on mechanical properties of sand,” (in Chinese), Chinese Journal of Geotechnical Engineering, Vol. 43, No. S1, pp. 155–160, Jul. 2021.
-
D. Hao, C. Yue, R. Chen, J. R., and F. C., “Shear characteristics and stress-dilation relation of medium sand under normal to high pressures.,” (in Chinese), Chinese Journal of Geotechnical Engineering, Vol. 42, No. 4, pp. 765–772, Apr. 2020.
-
D. Su, Z. Wu, G. Lei, and M. Zhu, “Numerical study on the installation effect of a jacked pile in sands on the pile vertical bearing capacities,” Computers and Geotechnics, Vol. 145, p. 104690, May 2022, https://doi.org/10.1016/j.compgeo.2022.104690
-
R. D. Tovar-Valencia, A. Galvis-Castro, R. Salgado, M. Prezzi, and D. Fridman, “Experimental measurement of particle crushing around model piles jacked in a calibration chamber,” Acta Geotechnica, Vol. 18, No. 3, pp. 1331–1351, Sep. 2022, https://doi.org/10.1007/s11440-022-01681-8
-
G. Ma, W. Zhou, X.-L. Chang, T.-T. Ng, and L.-F. Yang, “Formation of shear bands in crushable and irregularly shaped granular materials and the associated microstructural evolution,” Powder Technology, Vol. 301, pp. 118–130, Nov. 2016, https://doi.org/10.1016/j.powtec.2016.05.068
-
G. Ma, R. A. Regueiro, W. Zhou, Q. Wang, and J. Liu, “Role of particle crushing on particle kinematics and shear banding in granular materials,” Acta Geotechnica, Vol. 13, No. 3, pp. 601–618, Jan. 2018, https://doi.org/10.1007/s11440-017-0621-6
-
F. Yu, “Particle breakage and the drained shear behavior of sands,” International Journal of Geomechanics, Vol. 17, No. 8, p. 04017, Aug. 2017, https://doi.org/10.1061/(asce)gm.1943-5622.0000919
About this article

The study was supported by the National Natural Science Foundation of China (U2244228), Major Project of the National Natural Science Foundation of China (41831290), the Central Government's Guidance Fund Projects for Local Science and Technology Development (2024ZY01041, 2025ZY01028), the Zhejiang Provincial Natural Science Foundation of China (LTGS23E040001, LY22D020001), Science and Technology Plan Project of Shaoxing (2024A11014) and Construction Research Project of Zhejiang Provincial Department of Housing and Urban Rural Development (2023K263), which is gratefully acknowledged.
The datasets generated during and/or analyzed during the current study are available from the corresponding author on reasonable request.
Faquan Wu, Fang Zhang, Bolong liu, Jie Wu: conceptualization. Weihong Chen, Zhongli Xu: methodology. Zhehong Shen, Yuanlong Li, Yuqi Lang: writing-original draft. Bolong Liu, Zhongqing Chen, Zihao Zhu, Enjie Xu: writing-review and editing. All authors read and approved the manuscript.
The authors declare that they have no conflict of interest.
